





Trusted by 1,600+ marketing teams and agencies


What you can do with this influencer dashboard
Click a job to see it on demo data, then paste its prompt into Claude.
See which creators pay back their fee
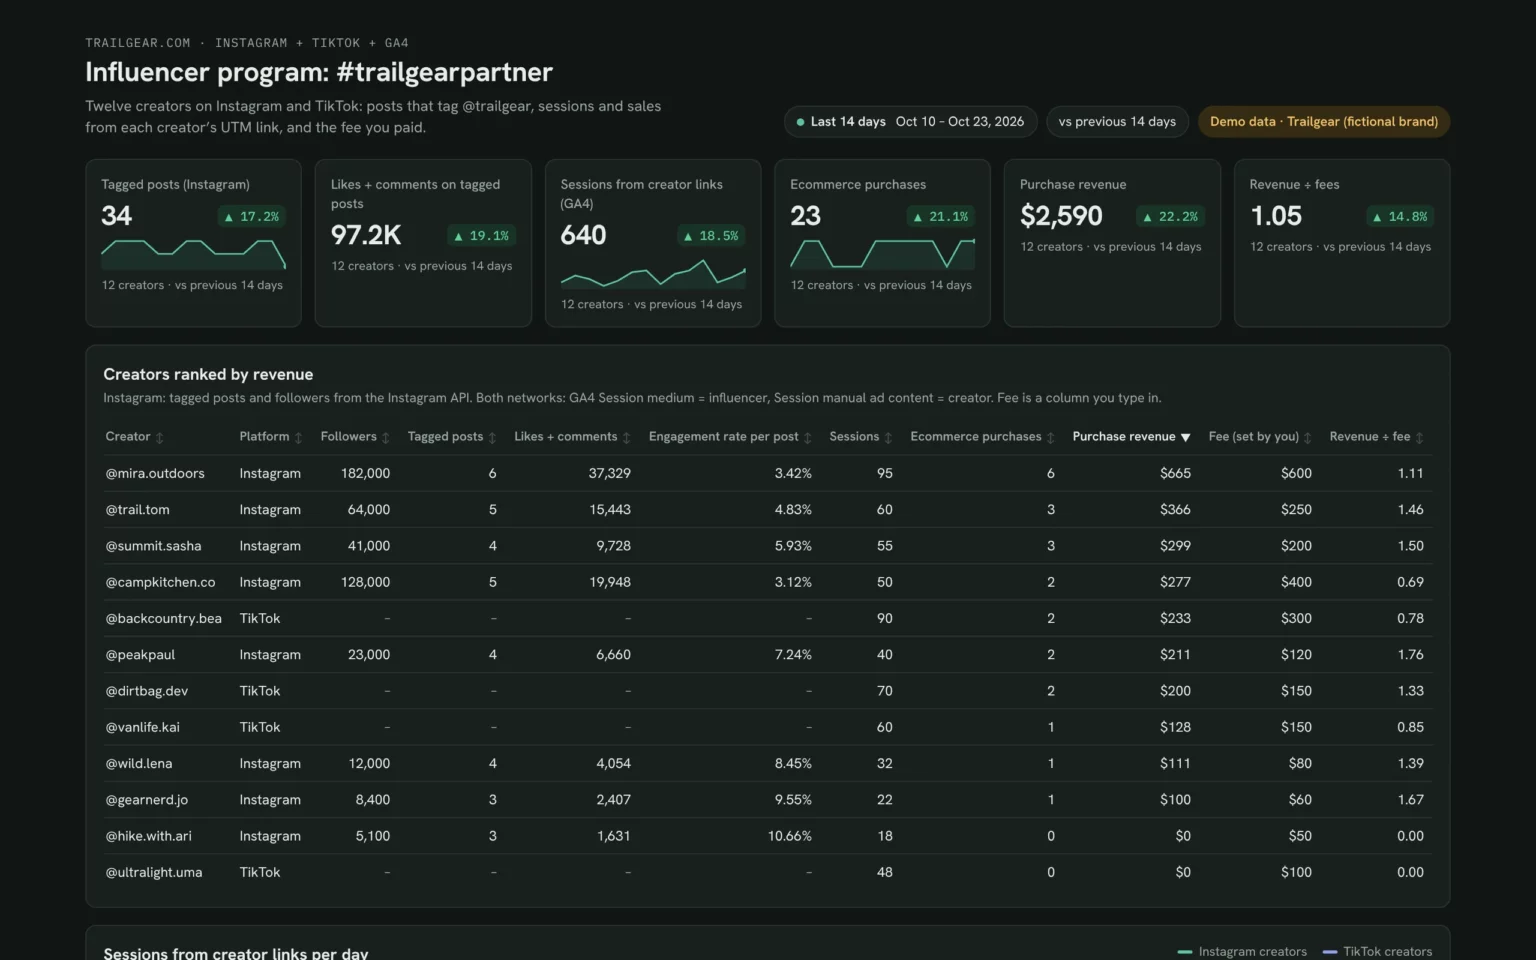
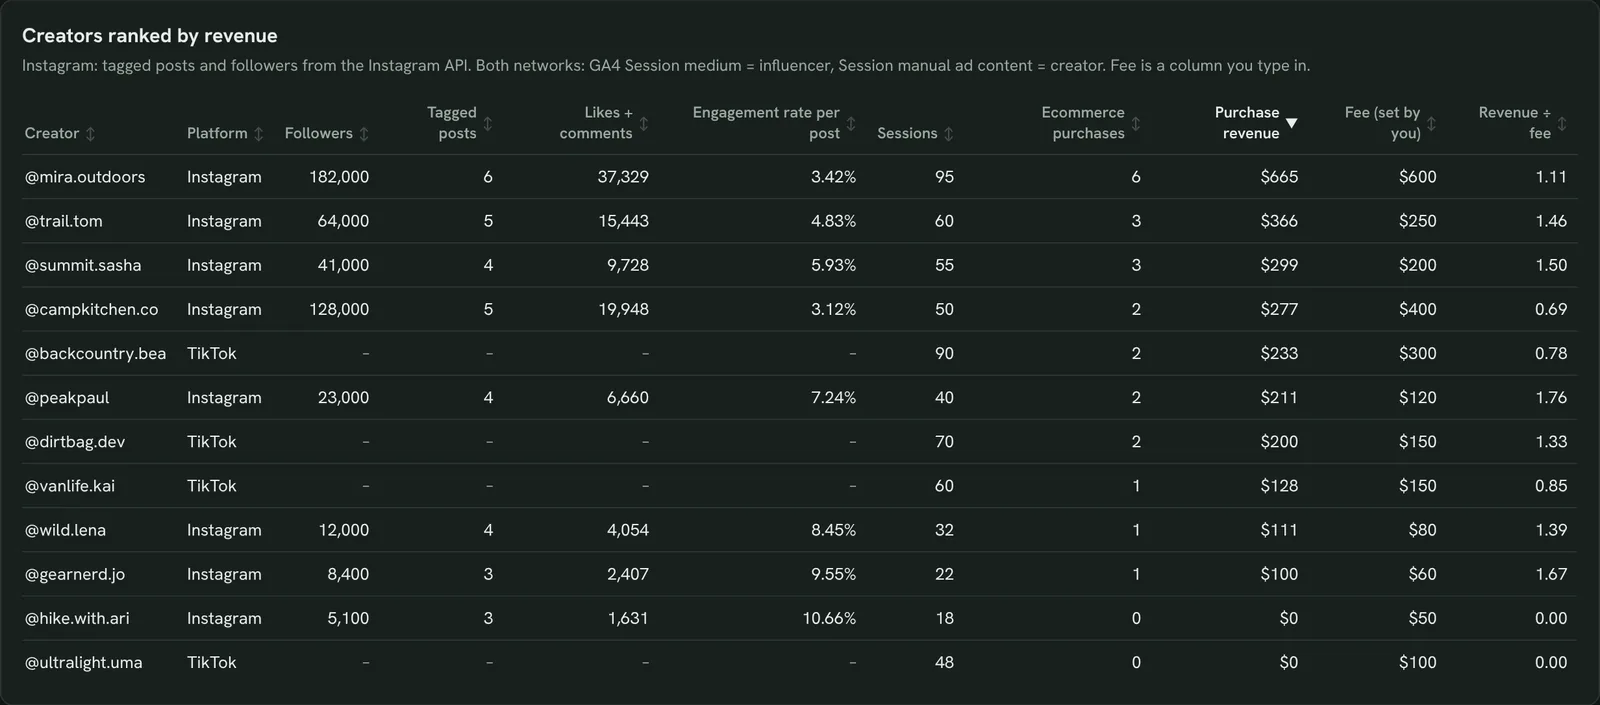
Sessions, purchases and revenue from each creator’s link next to the fee you paid, so you renew the right ones.
- Who brings the most revenue?
- Who earned less than their fee?
From GA4, show sessions, ecommerce purchases and purchase revenue by session manual ad content where session medium is influencer for the last 14 days, with a Fee column I fill in.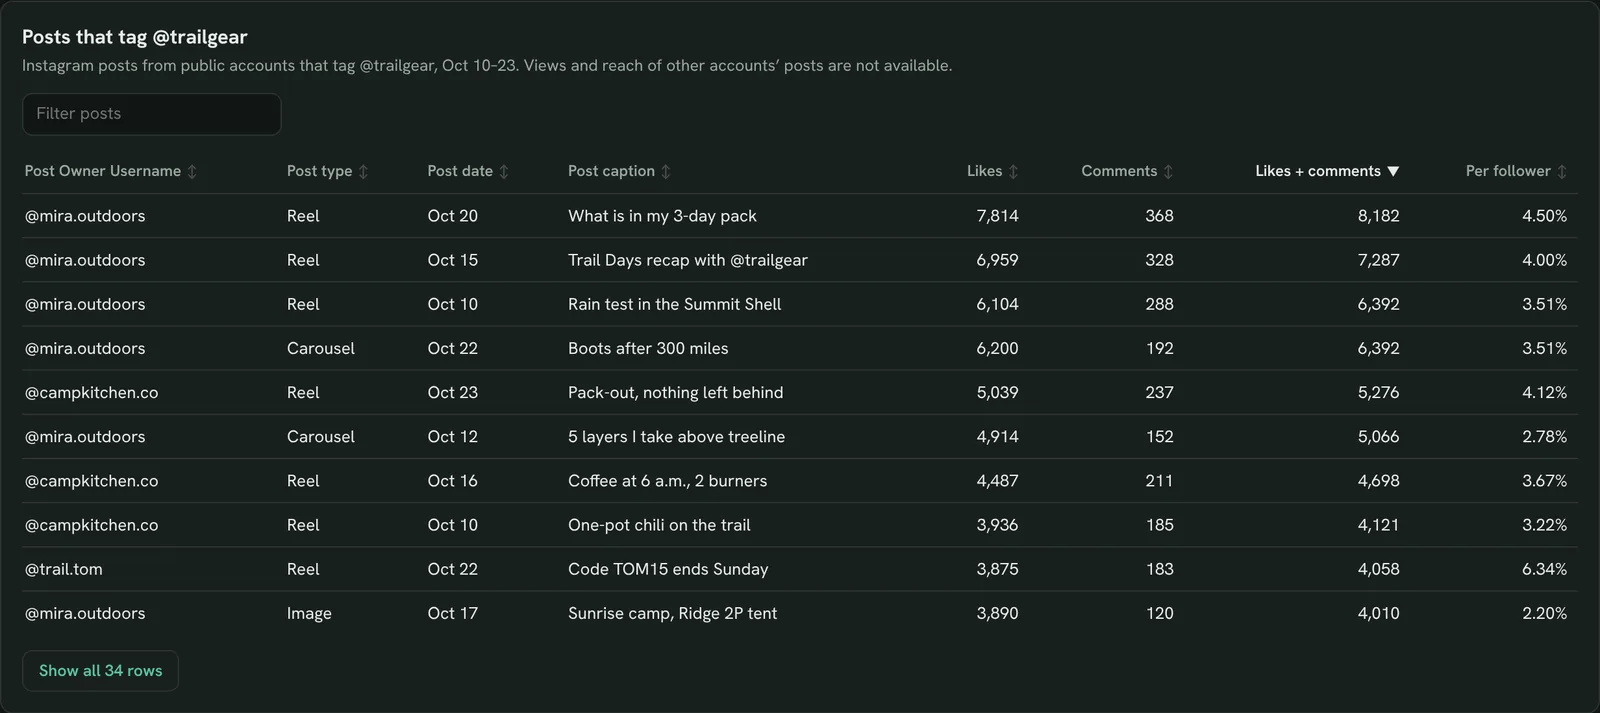
Find the creator posts that land
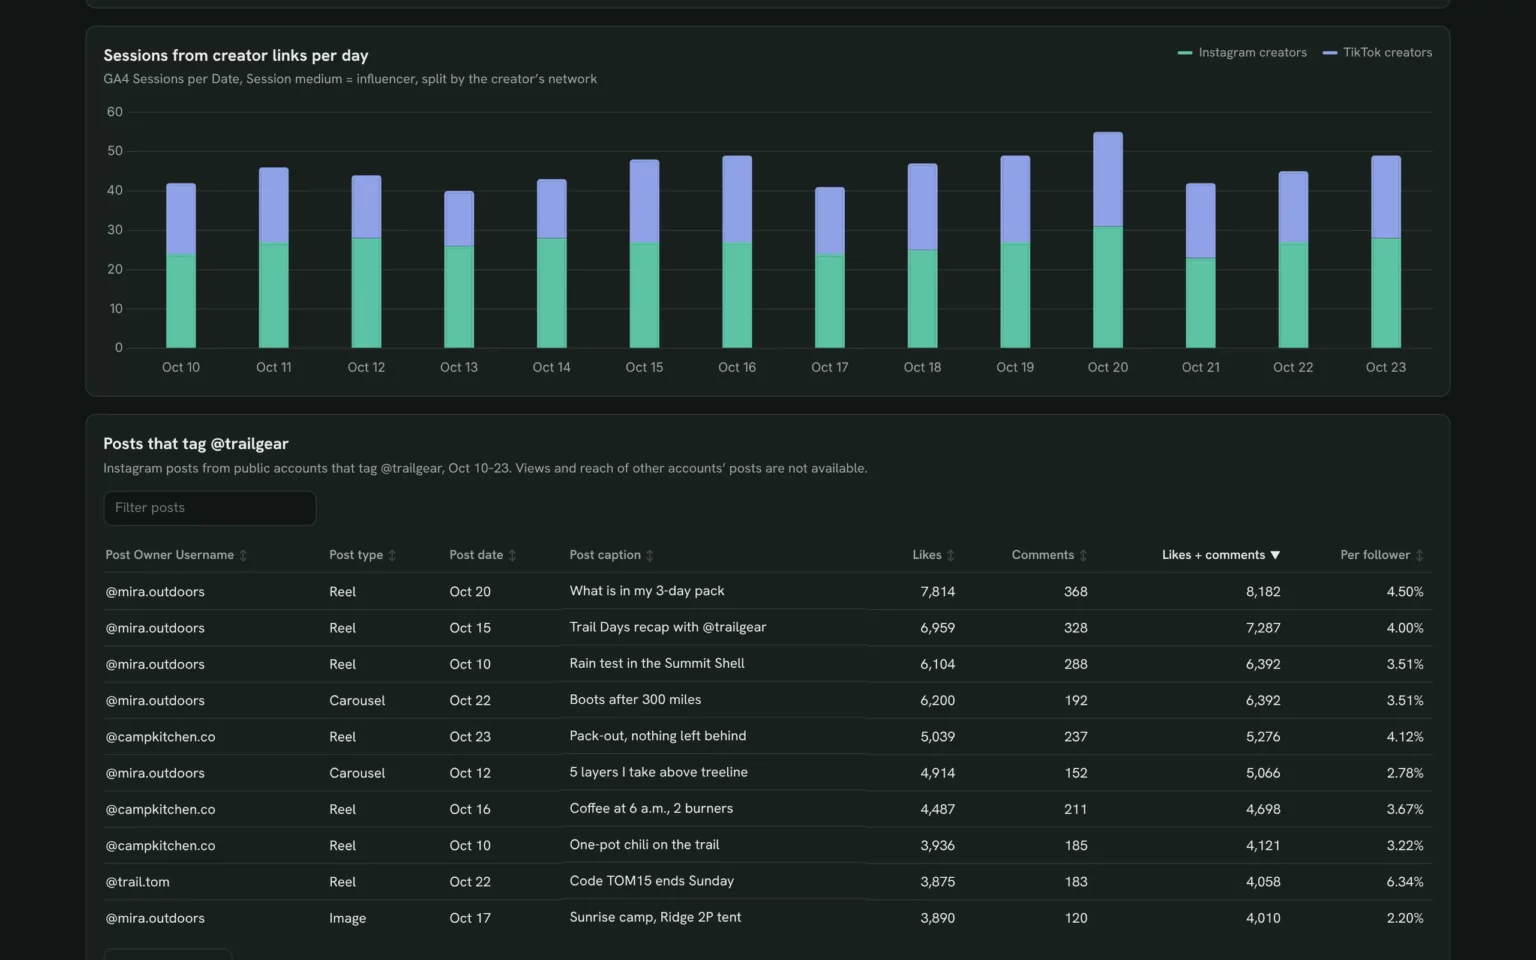
Every Instagram post that tags you, ranked by likes and comments, so you know which idea to brief again.
- Which tagged posts got the most likes and comments?
- Do Reels beat carousels?
List the Instagram posts that tagged our account in the last 14 days with username, post type, date, caption, likes and comments.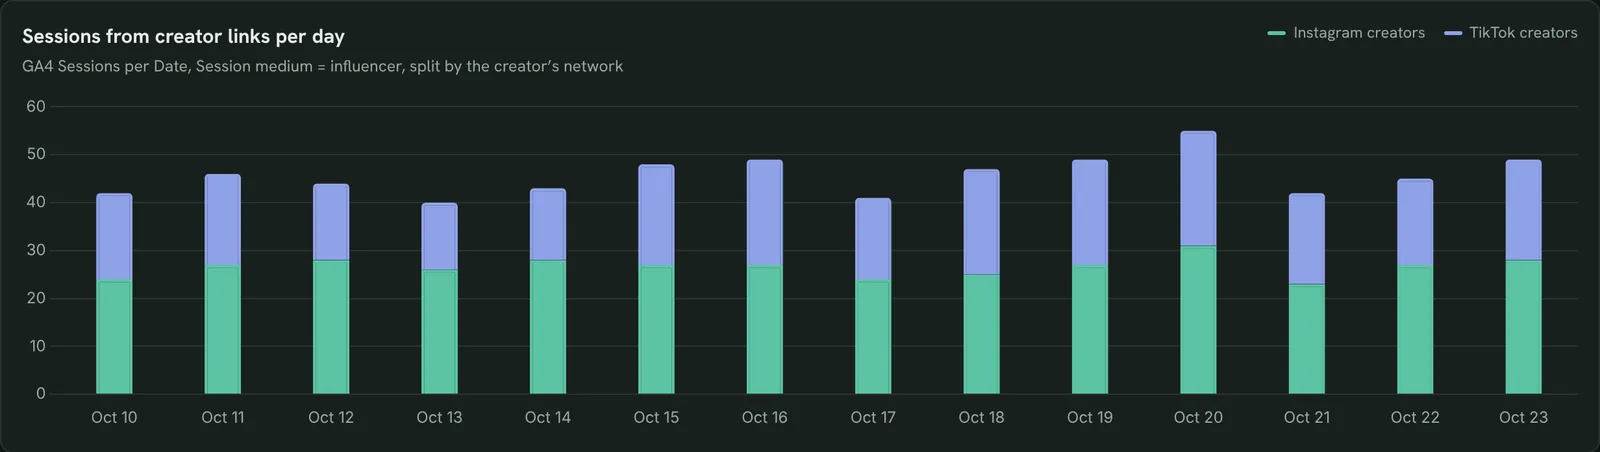
See which days creator links bring visits
Sessions from creator links per day, split by Instagram and TikTok creators, so you can match spikes to posts.
- Which days spiked?
- Do TikTok creators send more visits?
Chart GA4 sessions per day where session medium is influencer for the last 14 days, split by the creator’s network.
Check whether smaller creators engage better
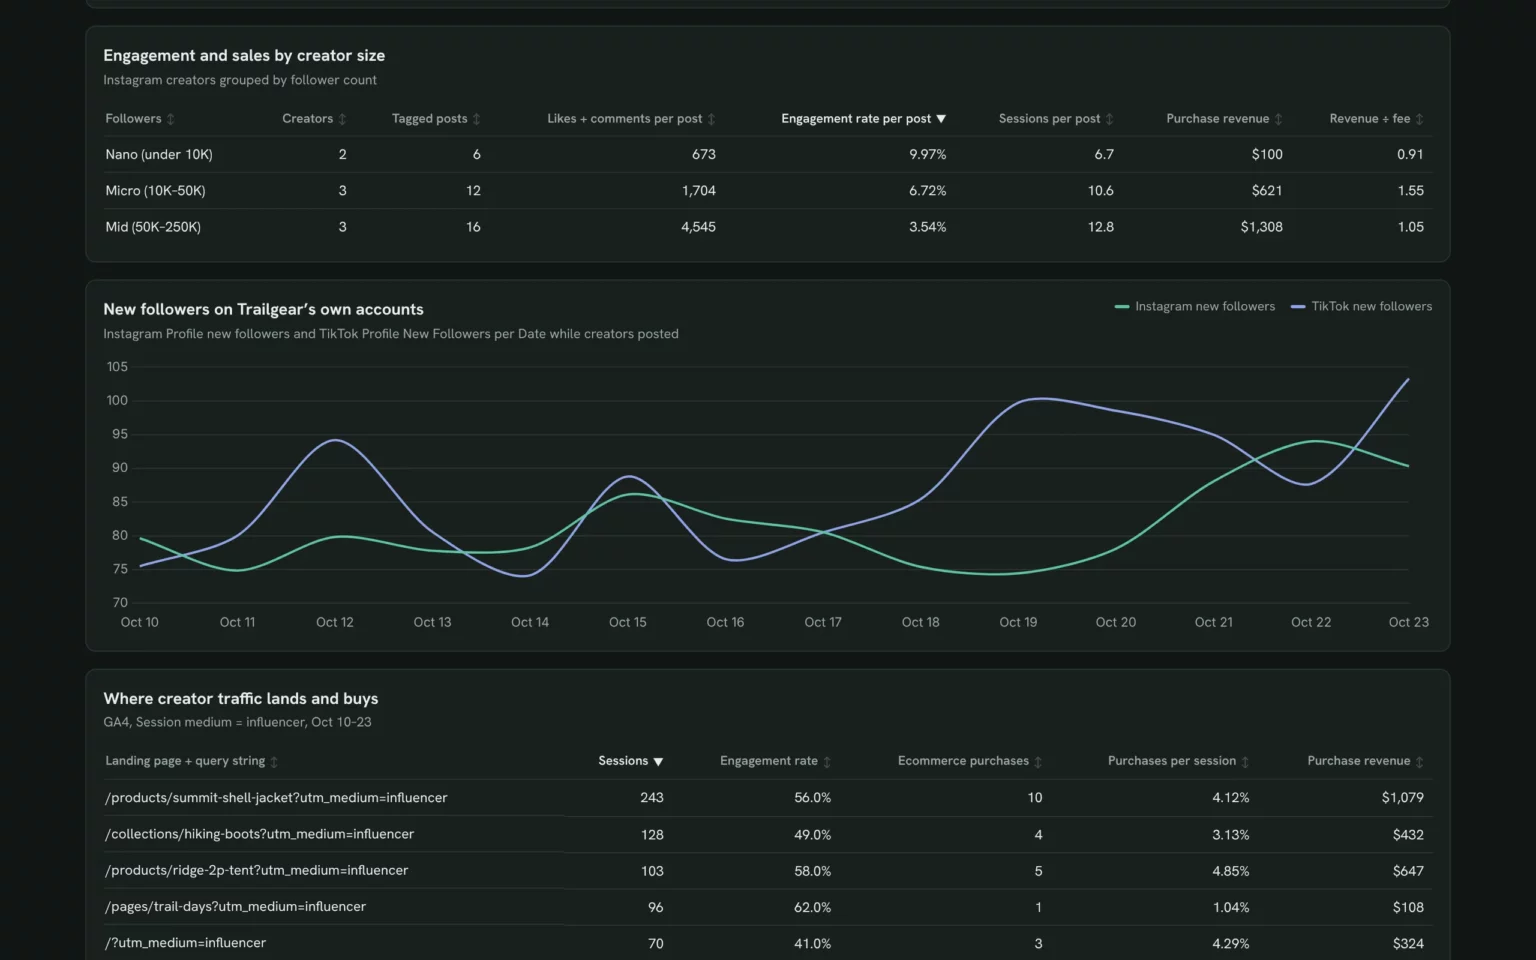
Likes and comments per follower by creator size, so you know whether to book more small creators.
- Do micro creators beat bigger ones per follower?
- Which size pays back its fee?
Group our Instagram creators by follower count (under 10K, 10K–50K, 50K–250K) with tagged posts, likes and comments per post, engagement rate, sessions and revenue.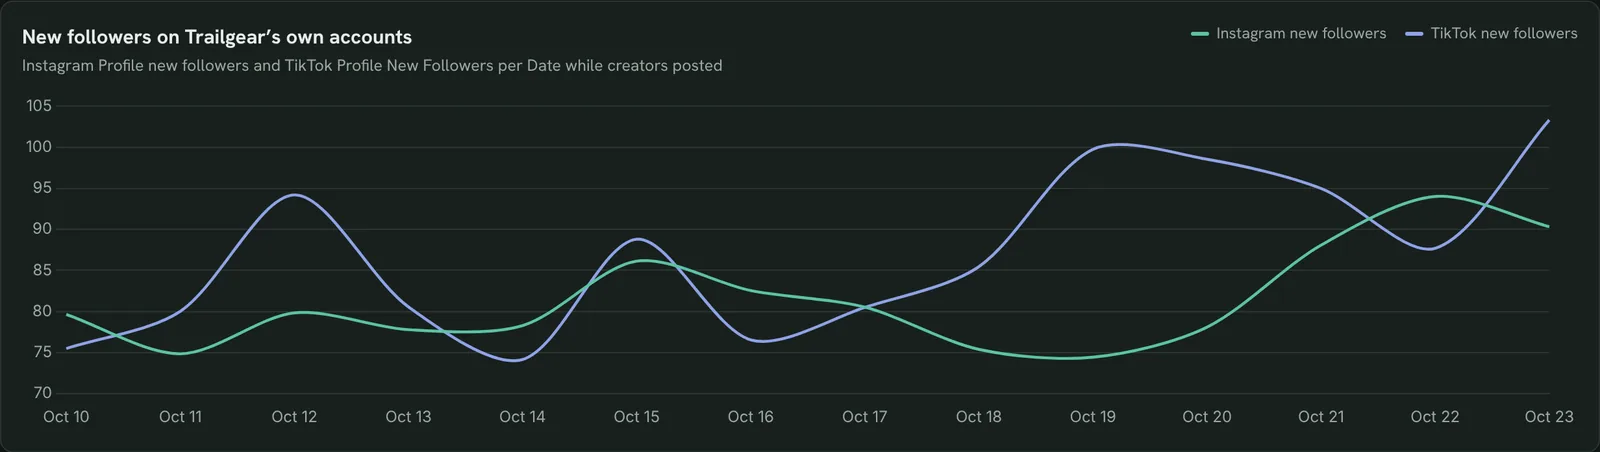
See if creators grow your own accounts
New followers on your own Instagram and TikTok per day while creators post, so you see the halo past the link.
- Did we gain followers while creators posted?
- Which network moved more?
Chart our Instagram Profile new followers and TikTok Profile New Followers per day for the last 14 days.Also built for this: Social media dashboard template
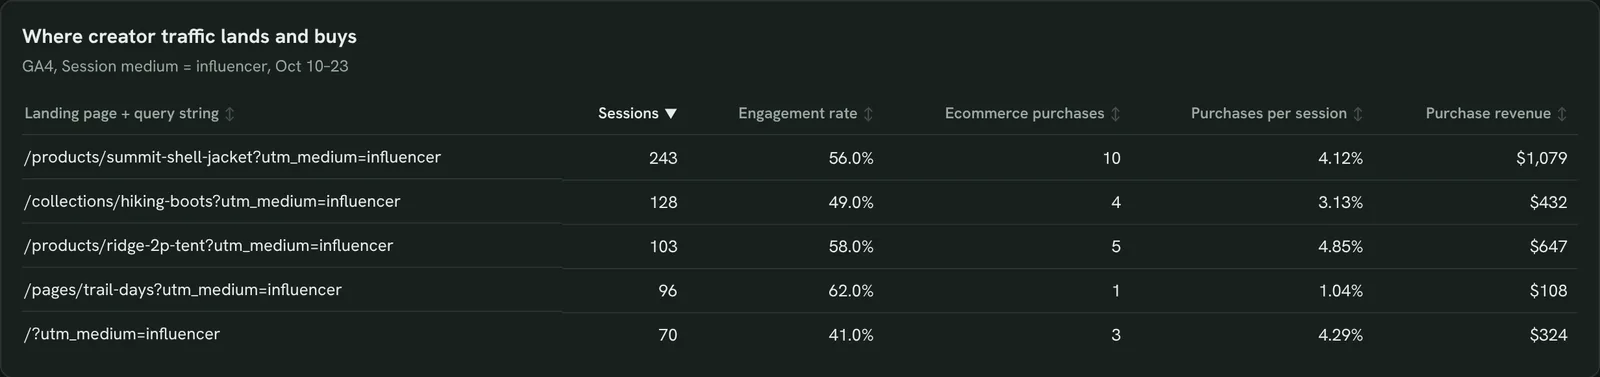
See where creator traffic lands and buys
Landing pages from creator links with purchases per session, so a weak page doesn’t waste a good post.
- Which page converts creator visits best?
- Which link needs a better page?
From GA4, show landing page + query string, sessions, engagement rate, ecommerce purchases and purchase revenue where session medium is influencer for the last 14 days.How to set up the influencer dashboard in Claude
You need an Instagram Business account linked to a Facebook Page, your TikTok and GA4, a free Porter account and a paid Claude plan. Setup takes about 15 minutes.
Connect your accounts and tag your links
Sign up free at Porter, connect Instagram, TikTok and GA4. Give each creator a link with utm_medium=influencer and utm_content set to their handle; Google explains how to build campaign URLs. The Instagram and TikTok tutorials show each click.
Add Porter to Claude
In Claude, go to Customize → Connectors → Add custom connector, paste https://mcp.portermetrics.com/mcp and name it Porter Metrics. Then sign in to Porter and allow access.
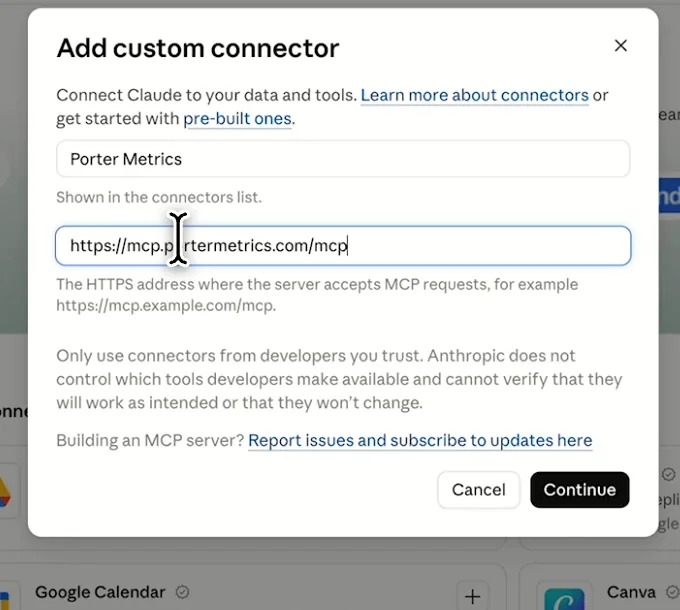
In Claude: Customize, Connectors, Add custom connector, then paste Porter’s MCP URL Paste the install prompt
Paste this prompt into a new chat, swap in your brand and type each creator’s fee when Claude asks. The Free plan covers the last 15 days; comparisons need the trial.
Install promptDuplicate this Claude dashboard template and keep its layout, views and styling: https://claude.ai/artifact/7HBuj3LRGAa1XHC8jcxukD Then rebuild it with my own data through Porter: an influencer dashboard for [brand] for the last 14 days: Instagram posts that tag our account with likes and comments; each creator’s follower count; GA4 sessions, ecommerce purchases and purchase revenue where session medium is influencer, by session manual ad content, with a Fee column I fill in; sessions per day by the creator’s network; creators grouped by follower size; our own Instagram and TikTok new followers per day; and landing pages from creator links. Open in Claude with this prompt

The first thing Claude builds: KPI cards for your creator program. Demo data shown.
How to connect Instagram to Claude (no code)
Influencer fields and data
Instagram gives likes, comments and follower counts on posts that tag you; GA4 gives the visits and sales from each creator link on both networks.
Top 5 influencer KPIs to watch
Trailgear demo data · last 14 days vs the 14 before
- Purchase revenue$2,590+22.2%
Revenue per creator, not total reach, decides who gets the next brief.
- Revenue ÷ fee1.05+14.8%
Below 1, a creator costs more than the sales their link brings; check reach goals before you drop them.
- Sessions from creator links640+18.5%
Few sessions on a post with high likes means the link is missing or buried; ask for it in the caption.
- Likes + comments per post2,859+1.6%
A drop on the same creator usually means the brief, not the audience, changed.
- Engagement rate per post4.06%
Compare it by creator size; a high rate with few sessions means people like the post but skip the link.
How the numbers are calculated
- Revenue ÷ fee
- Purchase revenue from a creator’s link ÷ the fee you typed in.
- Engagement rate per post
- (Likes + comments) ÷ posts ÷ the creator’s followers.
- Sessions from creator links
- GA4 sessions where Session medium = influencer, by Session manual ad content.
- Purchases per session
- Ecommerce purchases ÷ sessions.
- Change
- (This period − previous period) ÷ previous period.
Metrics
 Post total likes
- Post comments count
- Total followers
- Profile new followers
 Profile New Followers
 Sessions
- Engagement rate
- Ecommerce purchases
- Purchase revenue
Dimensions
- Post Owner Username
- Post type
- Post date
- Post caption
- Date
- Session medium
- Session manual ad content
- Landing page + query string
See all fields:Instagram Insights · 104 fieldsTikTok Organic · 88 fieldsGoogle Analytics 4 · 285 fields
What makes this influencer dashboard different
Influencer tools charge per seat and spreadsheets need copy-paste. This pulls tagged posts and creator sales into one live view.
See sales per creator, not just likes
GA4 revenue from each creator’s link sits next to their posts.
Stop copying post stats by hand
Instagram posts that tag you come in on their own.
Put fees next to revenue
Type each fee once and see what every creator returns.
Ask why a creator flopped in the same chat
Ask Claude which post or page held them back.
Send the brand a report on your logo
Email it with your logo on the day you choose.
Share it without account access
Anyone with the link sees it, no logins handed out.
What the dashboard includes
- Six KPI cards for the program
- Creators ranked by revenue, with your fees
- Daily sessions by creator network
- Instagram posts that tag you
- Results by creator size
- New followers on your own accounts
- Landing pages from creator links
- Share by link, PDF or email
Related dashboard templates
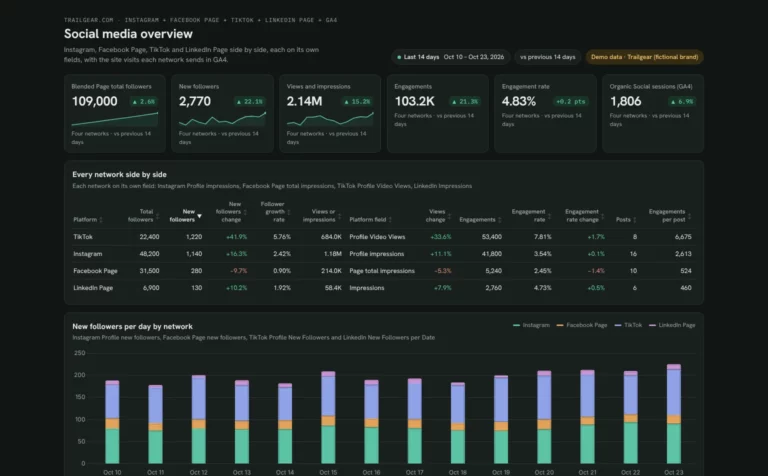 Claude


Social media dashboard template
Compare Instagram, Facebook, TikTok and LinkedIn growth, engagement and top posts, and see which network sends site visits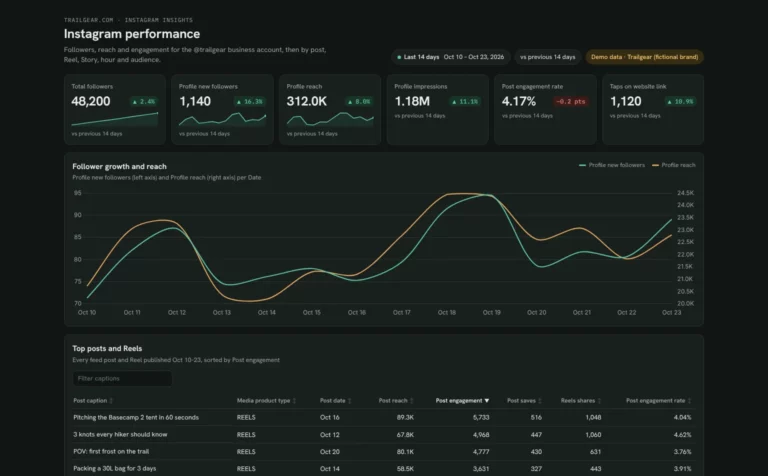 Claude
Instagram dashboard template
See which posts, Reels and Stories grow your account and when your followers are online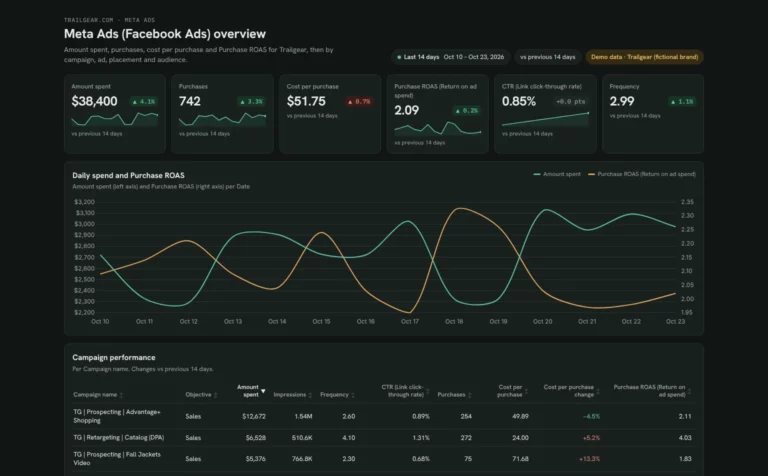 Claude

Meta Ads dashboard template
Track Meta Ads spend, ROAS and cost per purchase by campaign, ad and placement, and catch ad fatigue early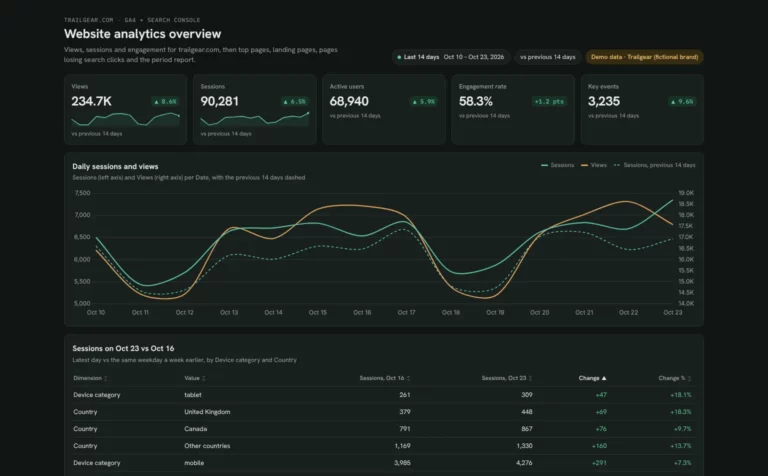 Claude

Web analytics dashboard template
See which pages win visits, which landing pages convert and which pages lose search clicksBrowse more Claude dashboard templates
 Data Studio
 ChatGPT
Get your free influencer dashboard
Connect your accounts, tag your creator links and paste the prompt. Your creators fill the same layout.
Free plan · 14-day trial · No card needed