





Trusted by 1,600+ marketing teams and agencies


What you can do with this weekly SEO report
Five checks for the start of the week. Click one to see its view on demo data, then paste its prompt into the same Claude chat.
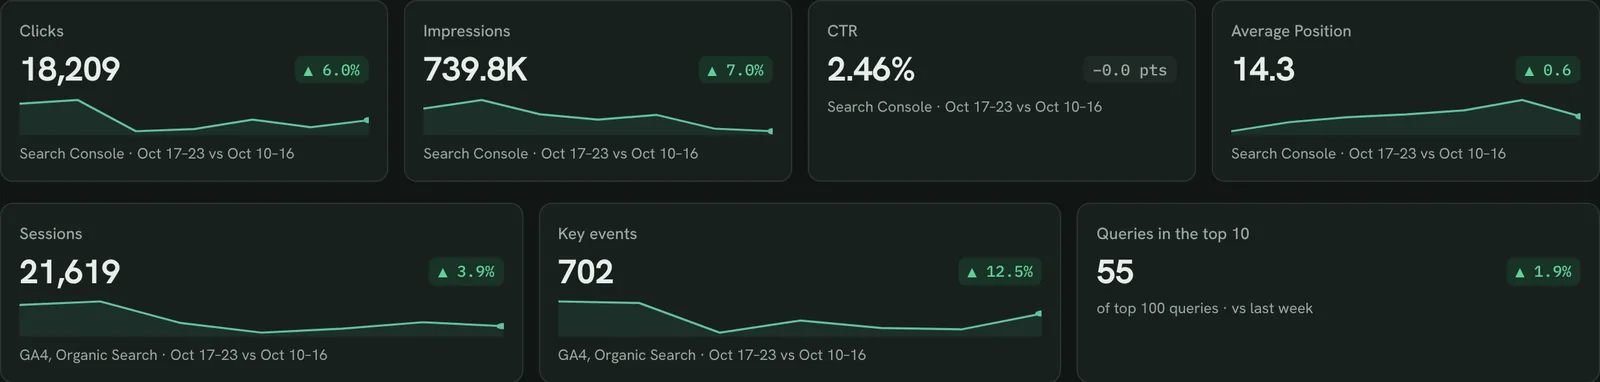
Run the Monday check in one view
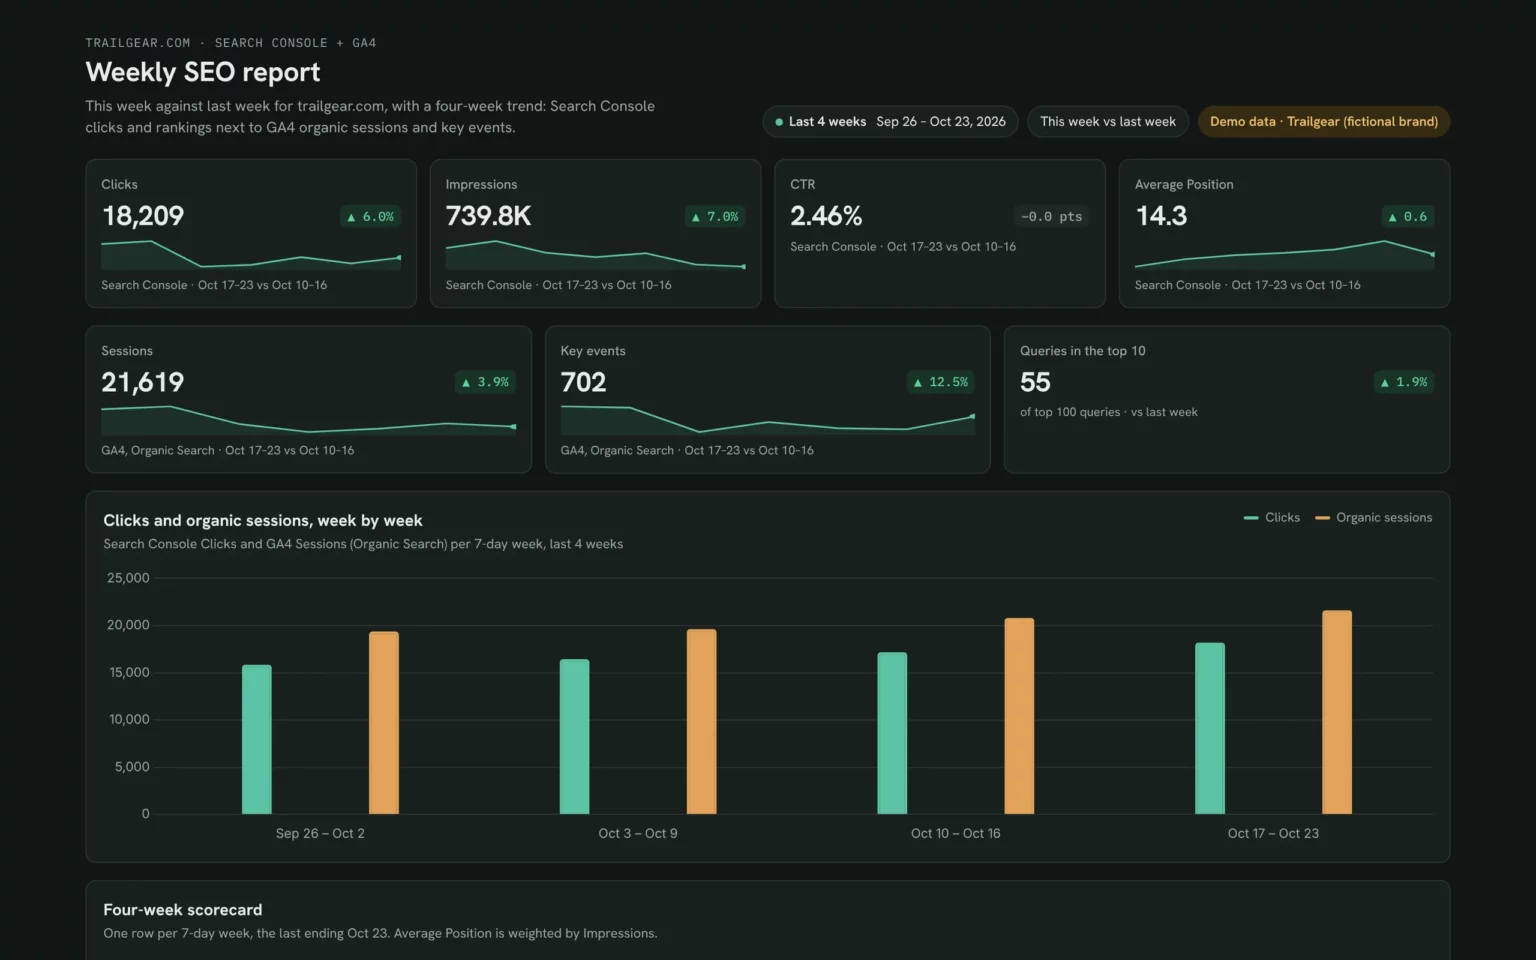
Clicks, rankings, organic sessions and key events for this week against last, so the stand-up starts with the same numbers every time.
- Did clicks, sessions and key events grow this week?
- Did more queries reach the top 10?
Show clicks, impressions, CTR and average position from Search Console and organic sessions and key events from GA4 for the last 7 days against the 7 days before.Also built for this: Monthly SEO dashboard template
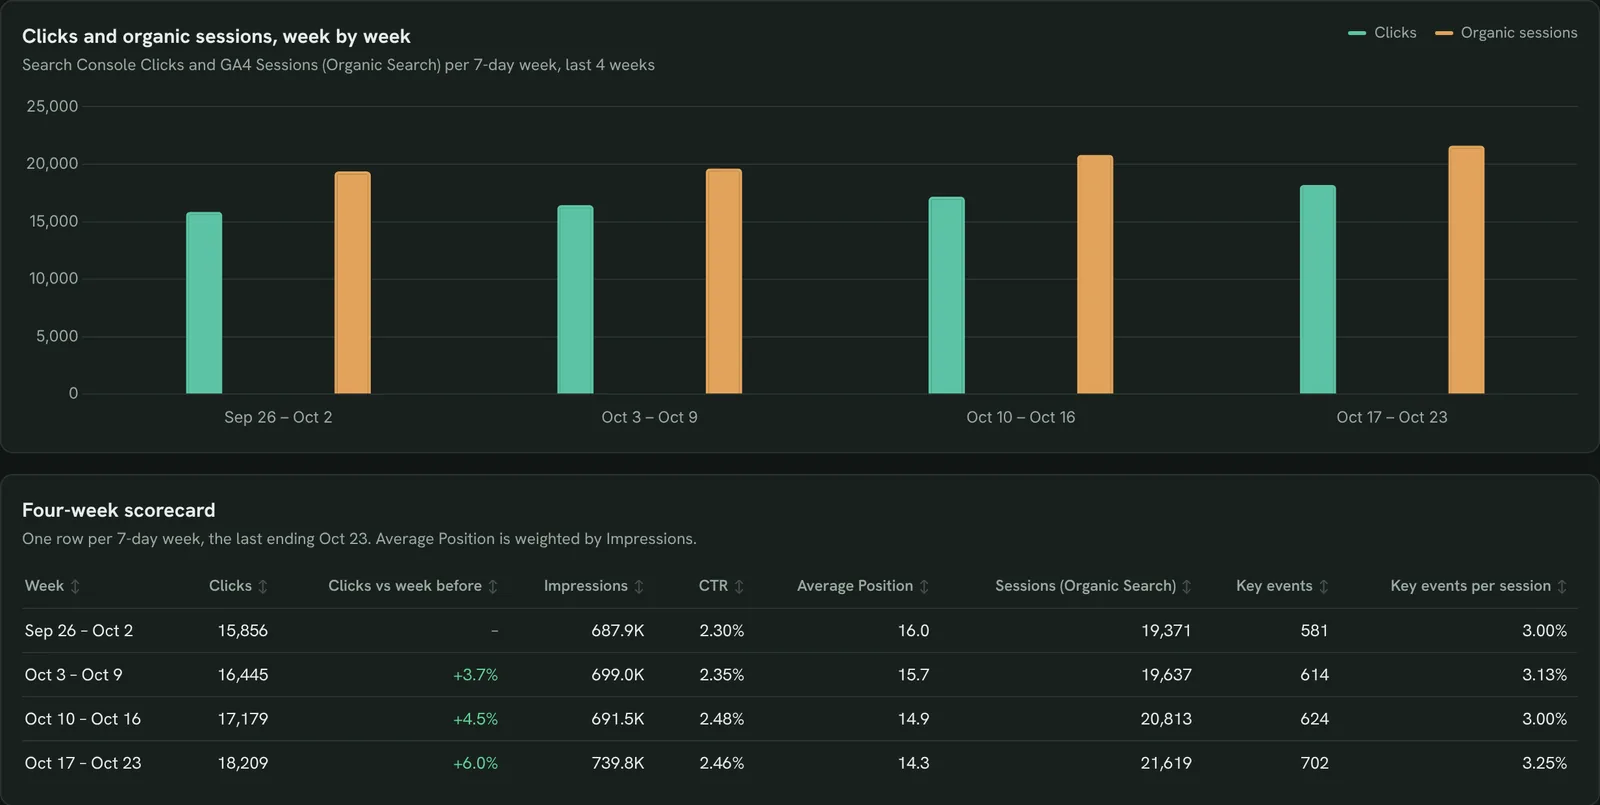
See the last four weeks at a glance
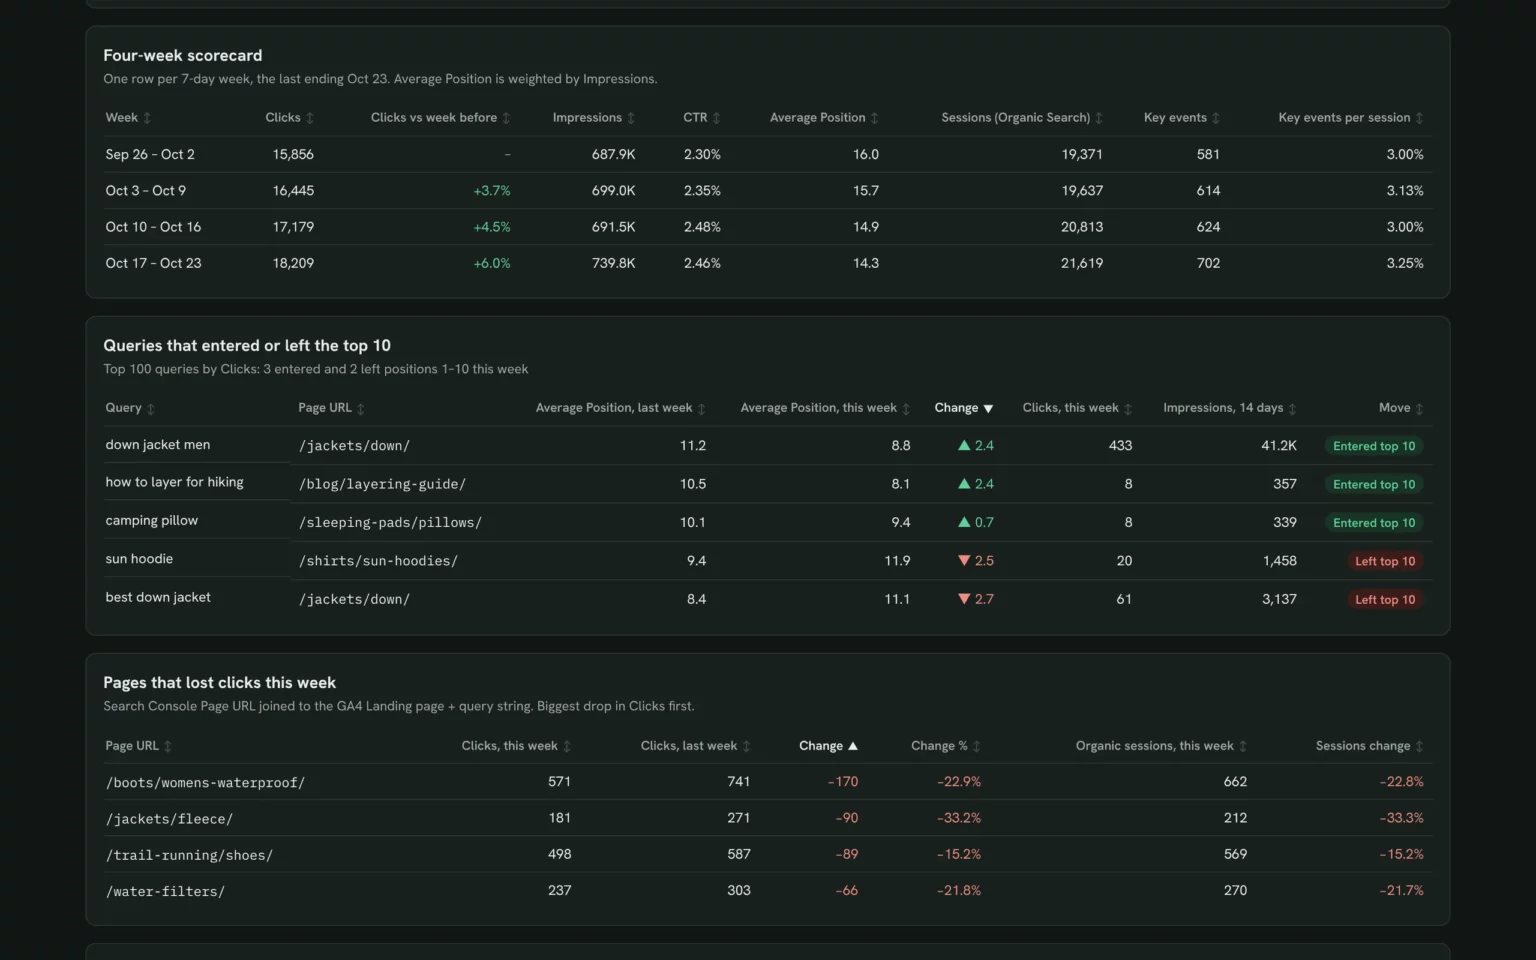
One row per week for clicks, rankings, organic sessions and key events, so you can tell a trend from one odd week.
- Is this week part of a trend or a blip?
- Which week did the change start?
Make a week-by-week table for the last 4 weeks with clicks, change vs the week before, impressions, CTR, average position, organic sessions and key events.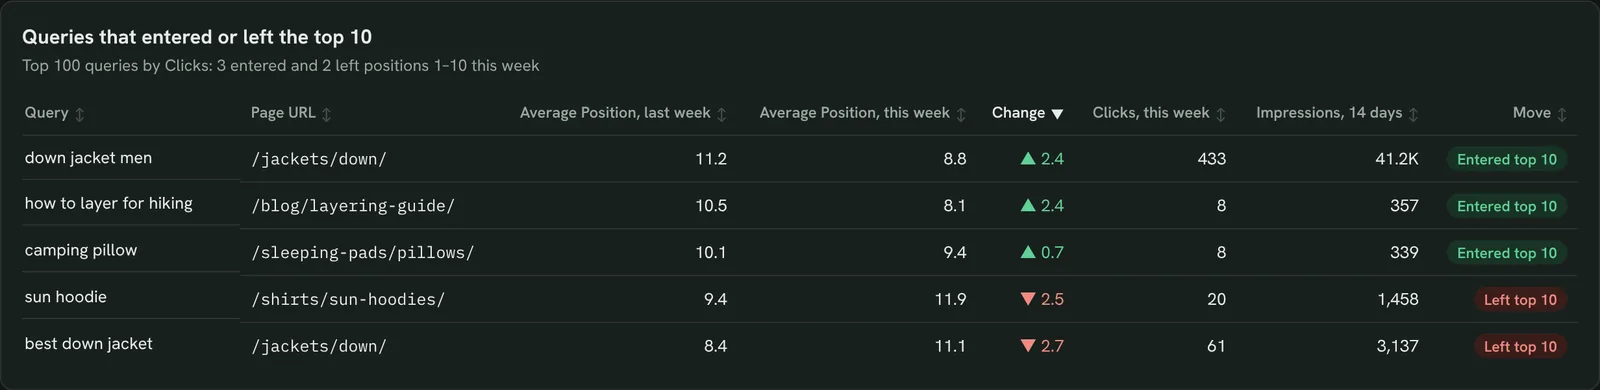
Catch queries entering or leaving the top 10
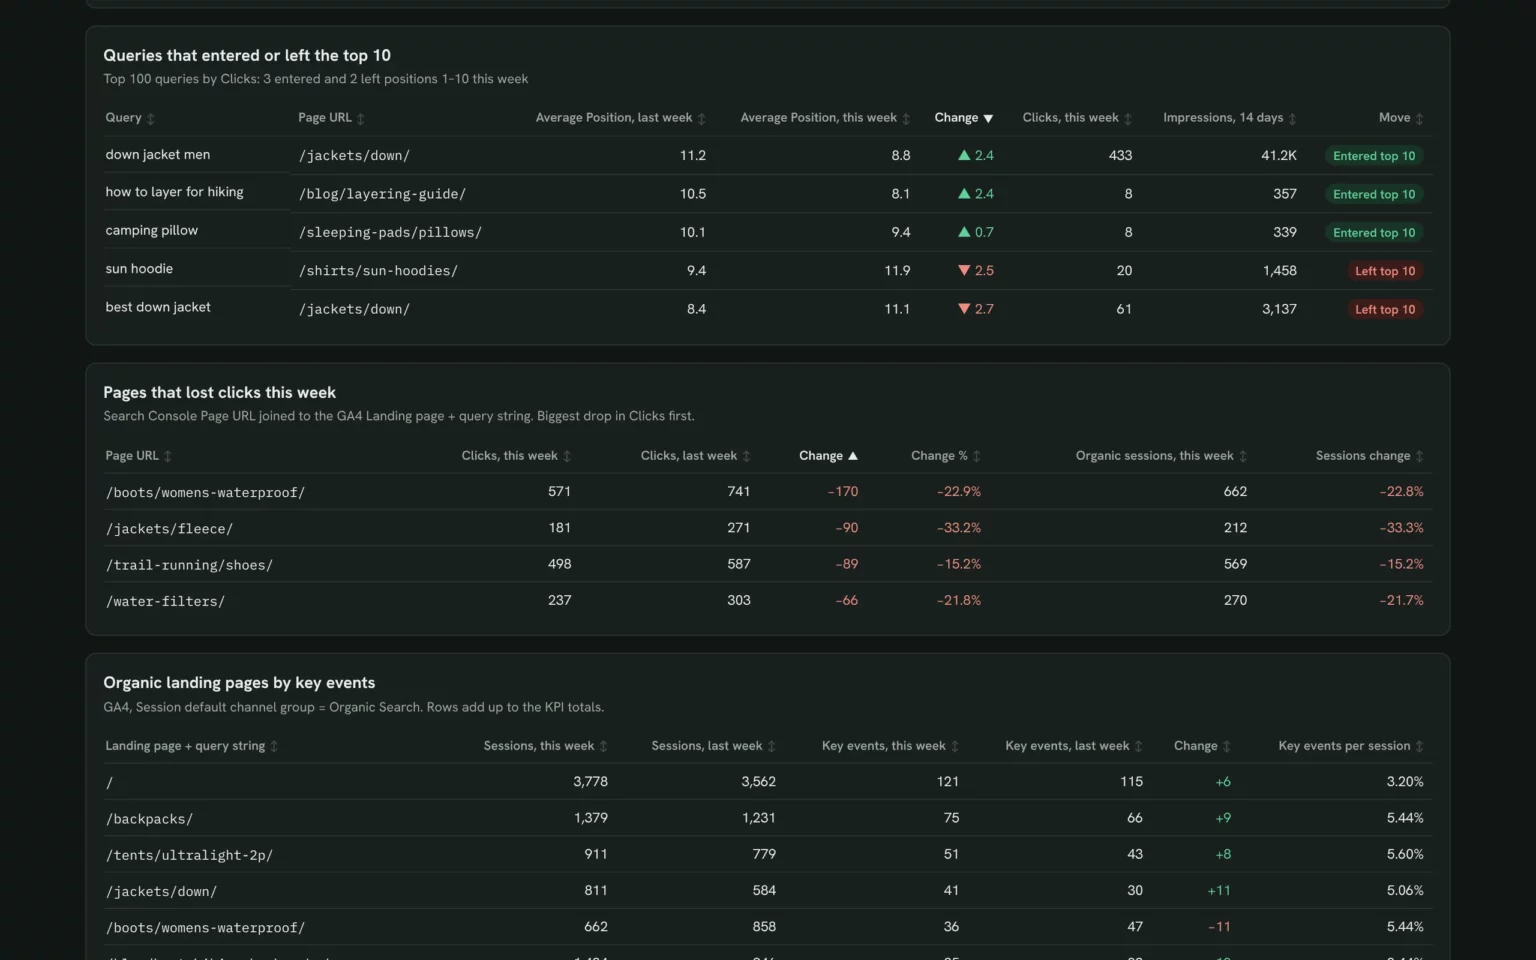
Queries that crossed into or fell out of positions 1 to 10 this week, so you see page-one wins and losses before they show in traffic.
- Which queries reached page one this week?
- Which ones slipped off it?
From my top 100 queries by clicks, list the ones whose average position crossed 10 between last week and this week, with the ranking page, both positions and clicks.Also built for this: Keyword ranking dashboard template
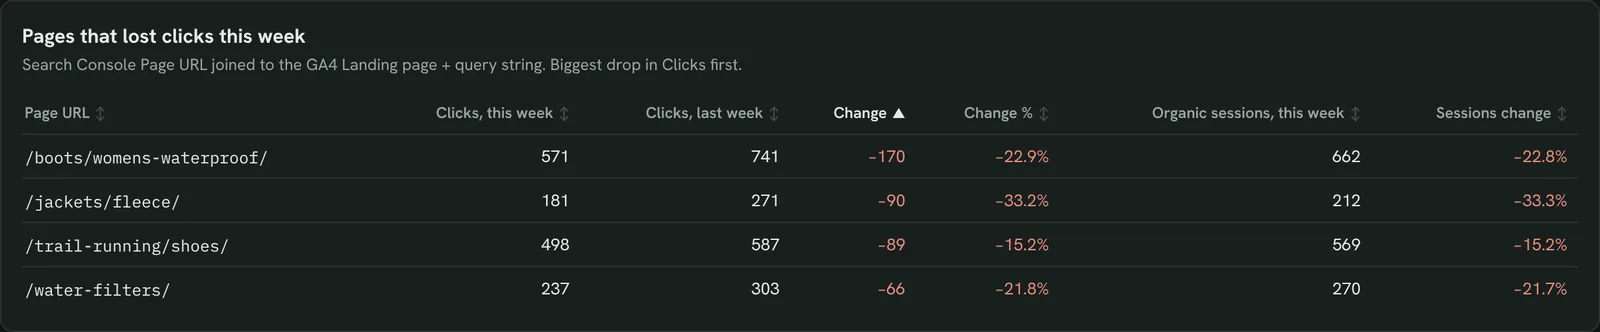
Find pages that lost clicks and visits
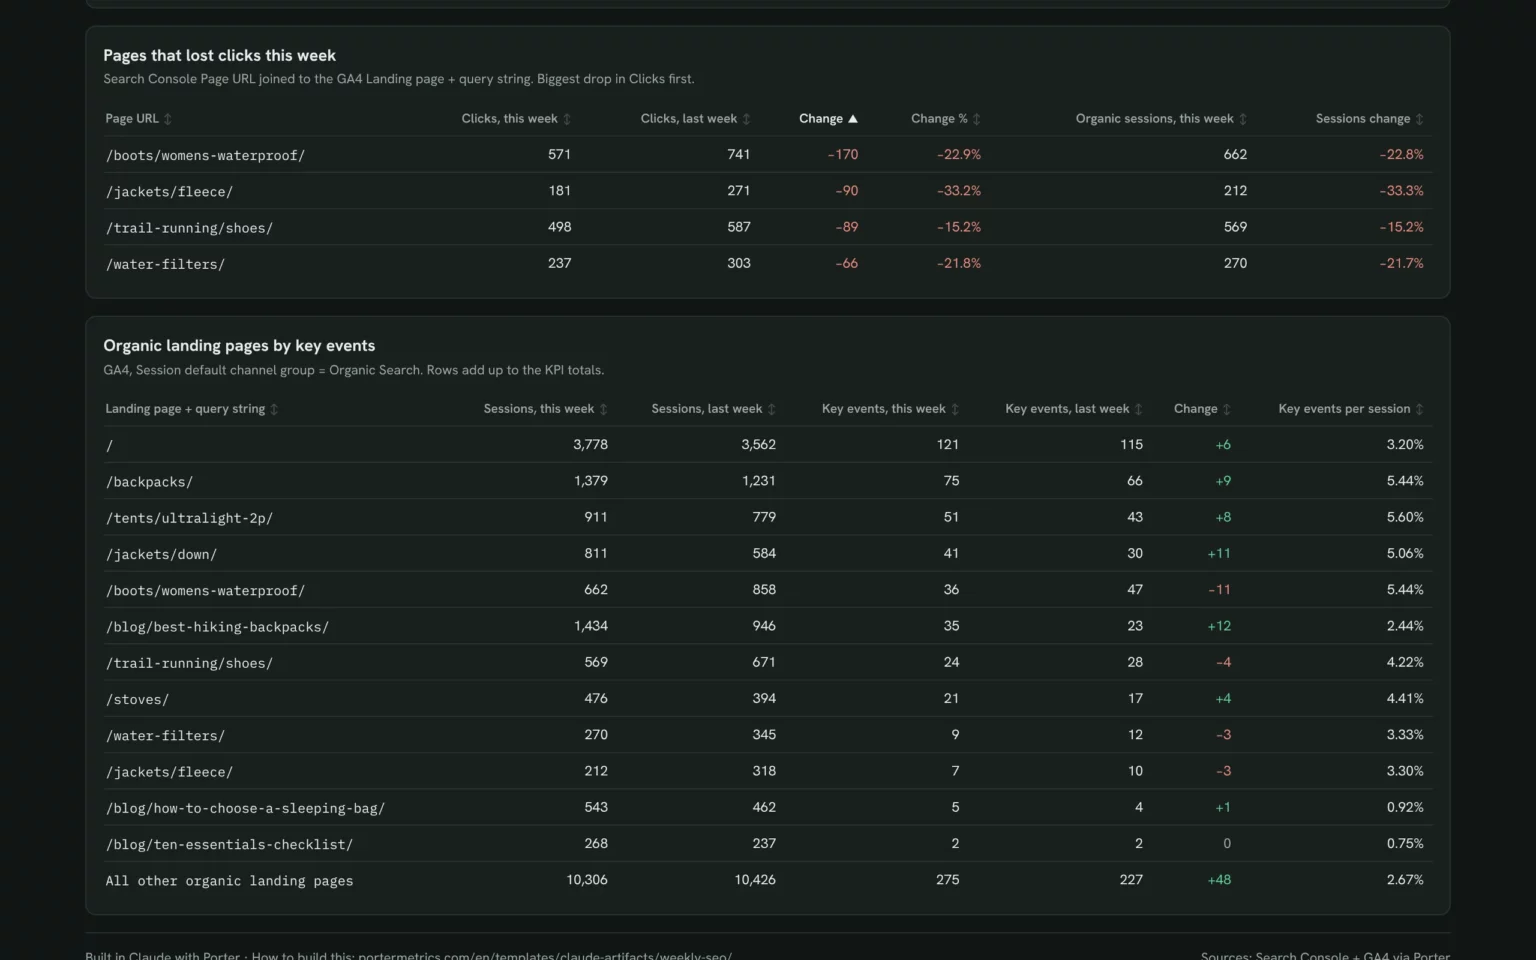
Pages with fewer clicks than last week next to their organic sessions, so you know which drops reached the site and need a look first.
- Which pages lost the most clicks this week?
- Did their organic sessions fall too?
List pages with fewer Search Console clicks this week than last, biggest drop first, with GA4 organic sessions for the same landing page and their change.Also built for this: SEO dashboard template
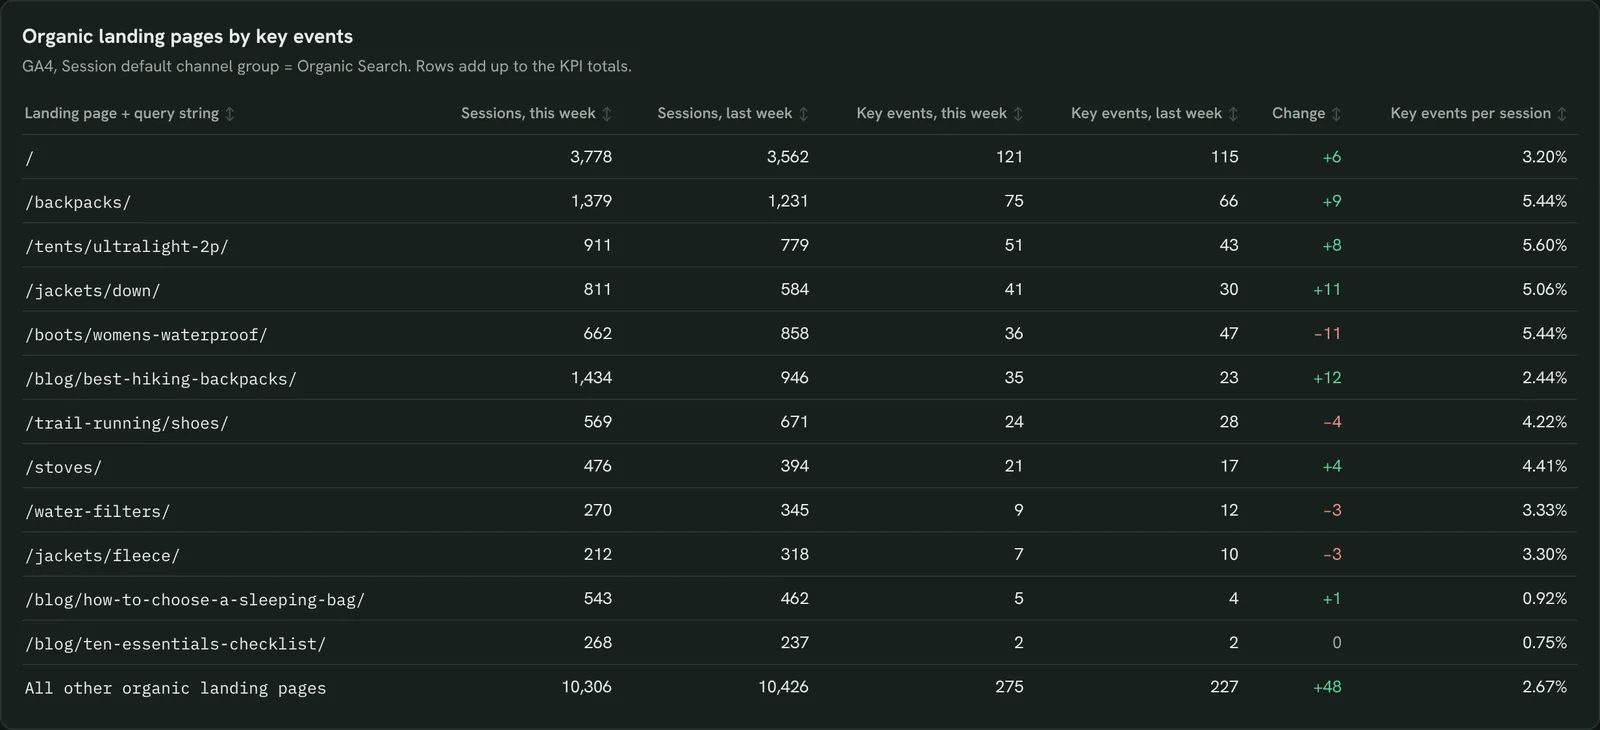
See which landing pages brought key events
Organic sessions and key events per landing page this week against last, so wins in clicks get checked against results.
- Which pages brought the most key events this week?
- Which converted better than last week?
Show GA4 organic sessions and key events by landing page + query string for this week and last week, with key events per session.Also built for this: GA4 SEO dashboard template
How to set up the weekly SEO report in Claude
You need a Search Console and a GA4 property your Google account can open, a free Porter account and Claude Pro, Max, Team or Enterprise for Claude Dashboards. Setup takes about 10 minutes.
Connect Search Console and GA4 in Porter
Sign up free at Porter, open Data sources, connect Google Search Console and Google Analytics 4 and choose your property in each. The Search Console to Claude tutorial and the GA4 to Claude tutorial show each click.
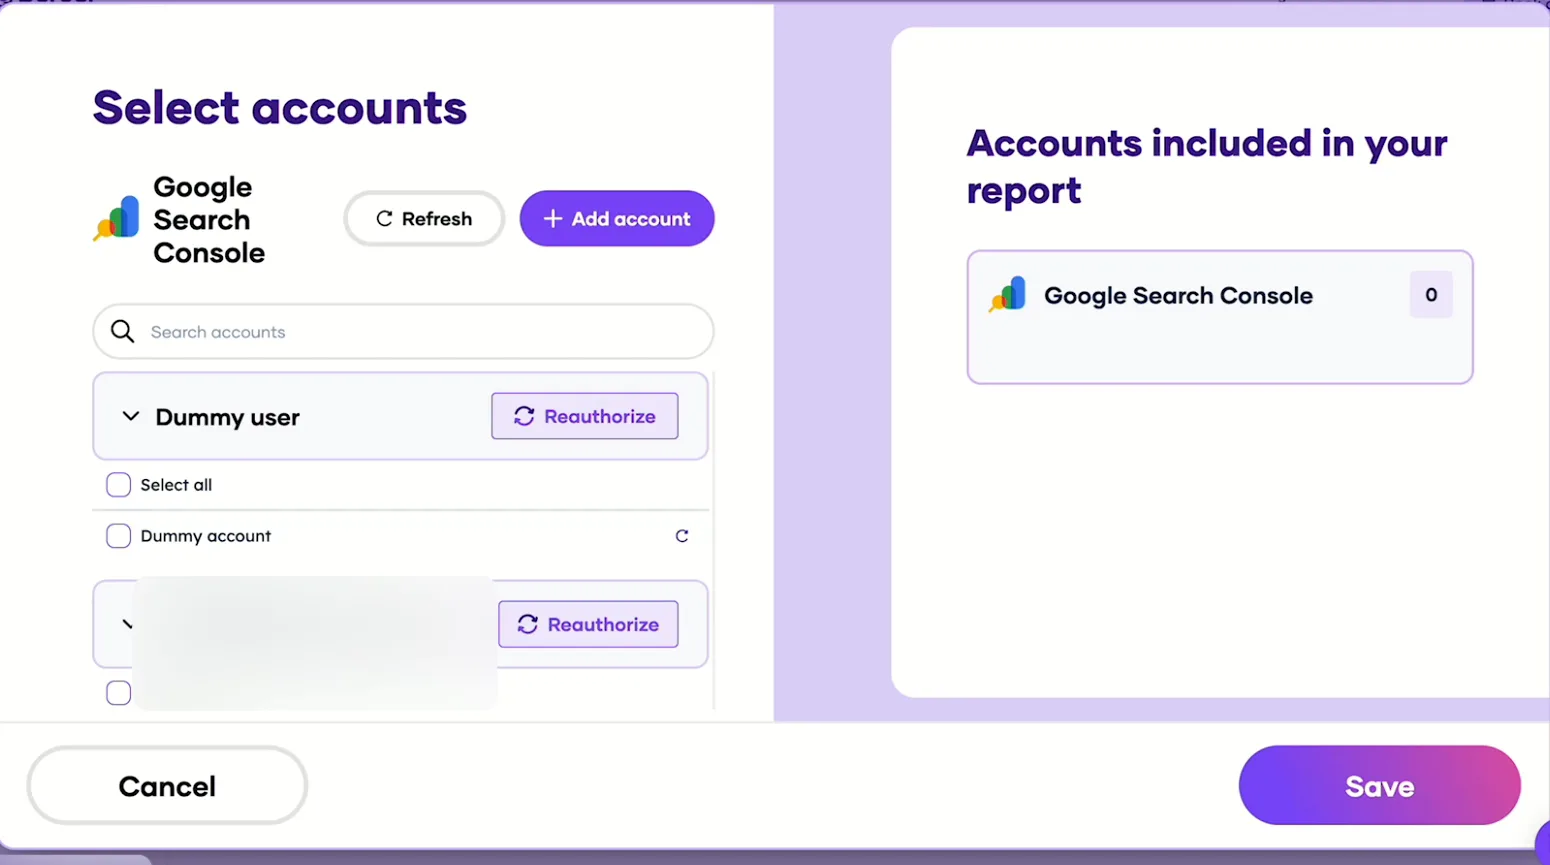
Pick the Search Console sites Claude can read, then save. Add Porter to Claude
In Claude, go to Customize → Connectors → Add custom connector, paste https://mcp.portermetrics.com/mcp and name it Porter Metrics. Click Continue, then sign in to Porter and allow access.
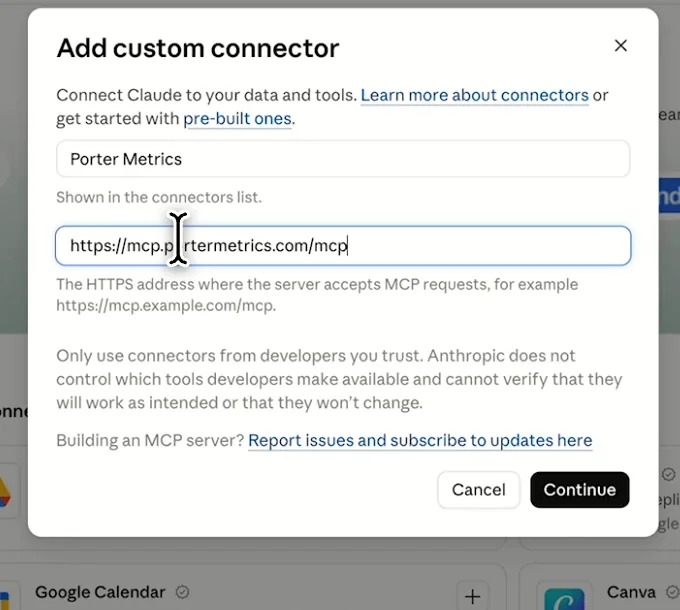
In Claude: Customize, Connectors, Add custom connector, then paste Porter’s MCP URL Paste the install prompt
Open a new chat in Claude, paste this prompt and replace the site in brackets. Claude reads both sources through Porter and builds the report.
Install promptDuplicate this Claude dashboard template and keep its layout, views and styling: https://claude.ai/artifact/PvcMqjyoS7pFe32RVgwZEo Then rebuild it with my own data through Porter: a weekly SEO report for [site]: the last 7 days against the 7 days before for Search Console clicks, impressions, CTR and average position and GA4 organic sessions and key events; the queries from my top 100 that entered or left the top 10; pages that lost clicks with their organic sessions; and organic landing pages by sessions and key events. If my plan reads 28 days of data, add a week-by-week table and chart for the last 4 weeks. Open in Claude with this prompt
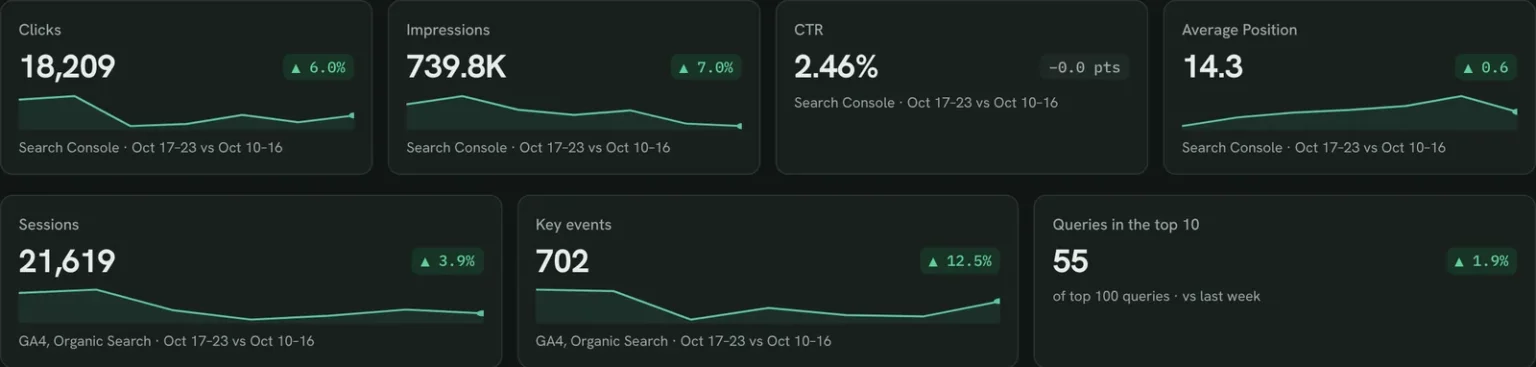
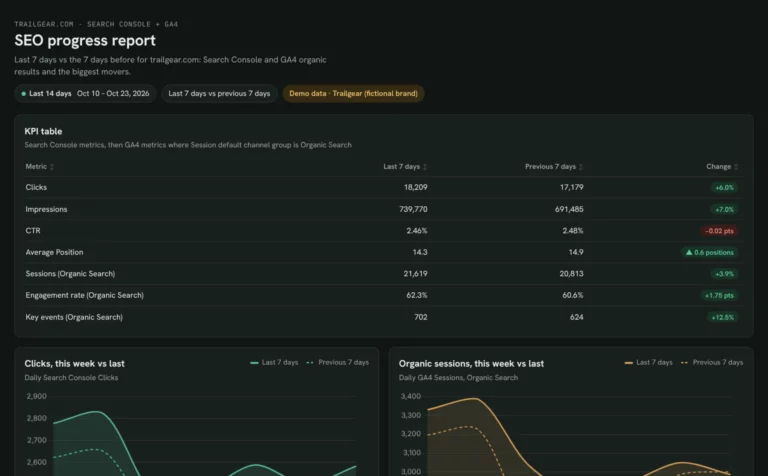
The first thing Claude builds: this week vs last for your own site. Demo data shown.
Build a Google Search Console dashboard with Claude
Weekly SEO report fields and data
The report puts Search Console Performance data next to GA4 sessions from the Organic Search channel, matched by page. Porter reads 27 Search Console fields and 285 GA4 fields if you need more.
Top 5 weekly SEO KPIs to watch
Trailgear demo data · Oct 17–23 vs Oct 10–16
- Clicks18,209+6.0%
Compare with last week first; a rise that only came from branded queries is not an SEO win.
- Organic sessions21,619+3.9%
Should move with clicks. If clicks rise and sessions don’t, check tracking on the landing pages.
- Key events702+12.5%
The week’s result. Check it per landing page before you report a traffic gain as a win.
- Queries in the top 1055+1
A page-one gain shows here a week or two before it shows in clicks.
- Average Position14.30.6 better
One week is noise; act when it moves the same way two or three weeks in a row.
How the numbers are calculated
- Change
- (This week − last week) ÷ last week. Position change shows as “better” when the number drops.
- Week
- 7 days ending on the last full day of data; Search Console data lags 2–3 days.
- Queries in the top 10
- Count of your top 100 queries by clicks with an average position of 10 or better.
- Organic sessions
- GA4 sessions where Session default channel group is Organic Search.
- Key events per session
- Key events ÷ organic sessions for the same landing page.
Data sources
Metrics
 Clicks
- Impressions
- CTR
- Average Position
 Sessions
- Key events
Dimensions
- Date
- Query
- Page URL
- Session default channel group
- Landing page + query string
See all fields:Google Search Console · 27 fieldsGoogle Analytics 4 · 285 fields
What makes this weekly SEO report different
What you get that a Monday export from Search Console and GA4 can’t give you.
Skip the Monday exports
The report refreshes Search Console and GA4 together, so the stand-up starts with current numbers.
Pick any week in one sentence
Ask for last week, the week before a launch or the same week last year; paid plans read the full history.
See clicks and visits on one row
Search Console pages are matched to GA4 landing pages, so a drop in clicks and a drop in visits sit side by side.
Ask why a page dropped on the spot
Ask Claude for that page’s queries and positions and get them in the same chat.
Get it in your inbox every Monday
Publish it as a Porter dashboard to add your logo and email it on a set day.
Share a link instead of a screenshot
Your team opens the published dashboard in the browser, without a Claude account.
What the report includes
- KPI cards for this week against last
- Weekly clicks and organic sessions for the last 4 weeks
- A four-week scorecard
- Queries that entered or left the top 10
- Pages that lost clicks, with organic sessions
- Organic landing pages by key events
- Share by link, PDF and scheduled email once published in Porter
Related dashboard templates
 Claude
Monthly SEO dashboard template
Show month-on-month SEO results and the pages that moved them.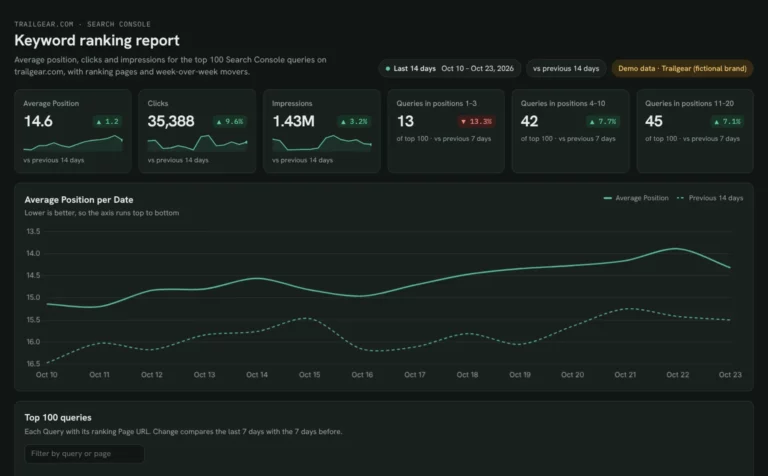 Claude
Keyword ranking dashboard template
Track which keywords reach page one and what moved this week.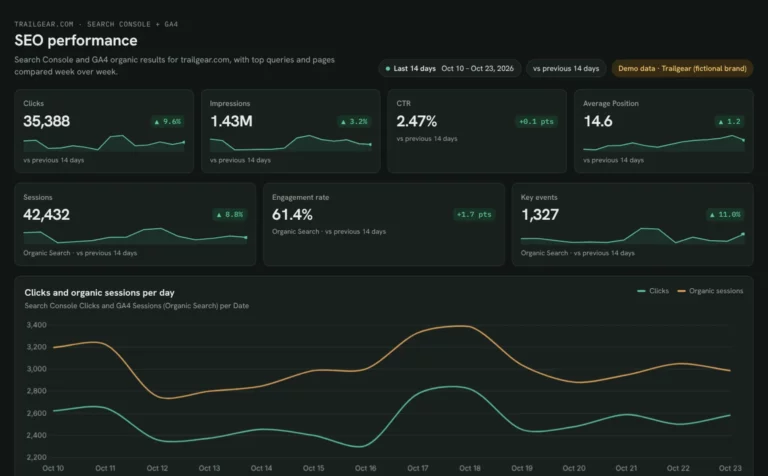 Claude
SEO dashboard template
See which Search Console clicks turn into GA4 sessions and key events.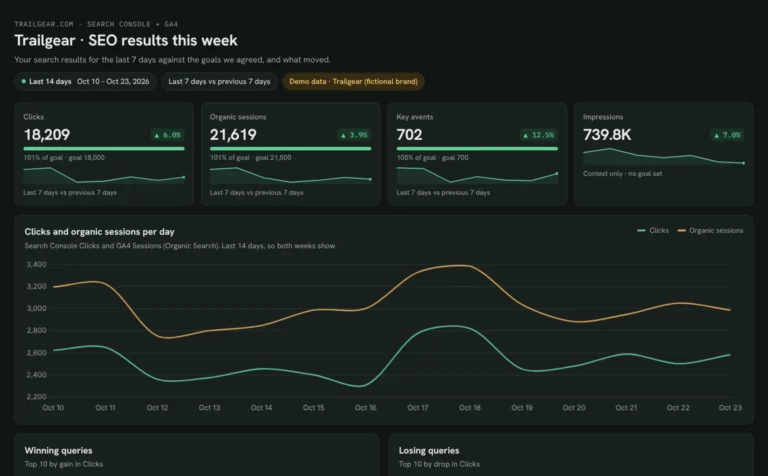 Claude
Client SEO dashboard template
Report clicks, sessions and key events against each client’s goals.Browse more Claude dashboard templates
 Data Studio
 Google Sheets
 ChatGPT
Get your free weekly SEO report
Sign up free, connect Search Console and GA4 and paste the prompt. Your own data fills the same layout as the demo, ready for next Monday.
Free plan · 14-day trial · No card needed