

Browse 20 Sales Pipeline Report Templates for Data Studio
Choose from our library of free, white-label sales pipeline templates. Each template tracks the full marketing funnel: visibility (impressions, reach), engagement (CTR, interactions), and conversion (leads, revenue). Organized following the SUMAS framework with breakdowns by channel, campaign, audience, and time period.
B2B Funnel Report template for Data Studio by Porter
Track account reach, ad impressions → content engagement, demo requests → pipeline value, deal velocity. Segment by account tier, channel.
B2B KPI tracker Report template for Data Studio by Porter
Track account reach, ad impressions → content engagement, demo requests → pipeline value, deal velocity. Segment by account tier, channel.
B2B Marketing performance Report template for Data Studio by Porter
Track account reach, impressions → engagement by account → MQLs, SQLs, pipeline contribution. Segment by account, campaign, stage.
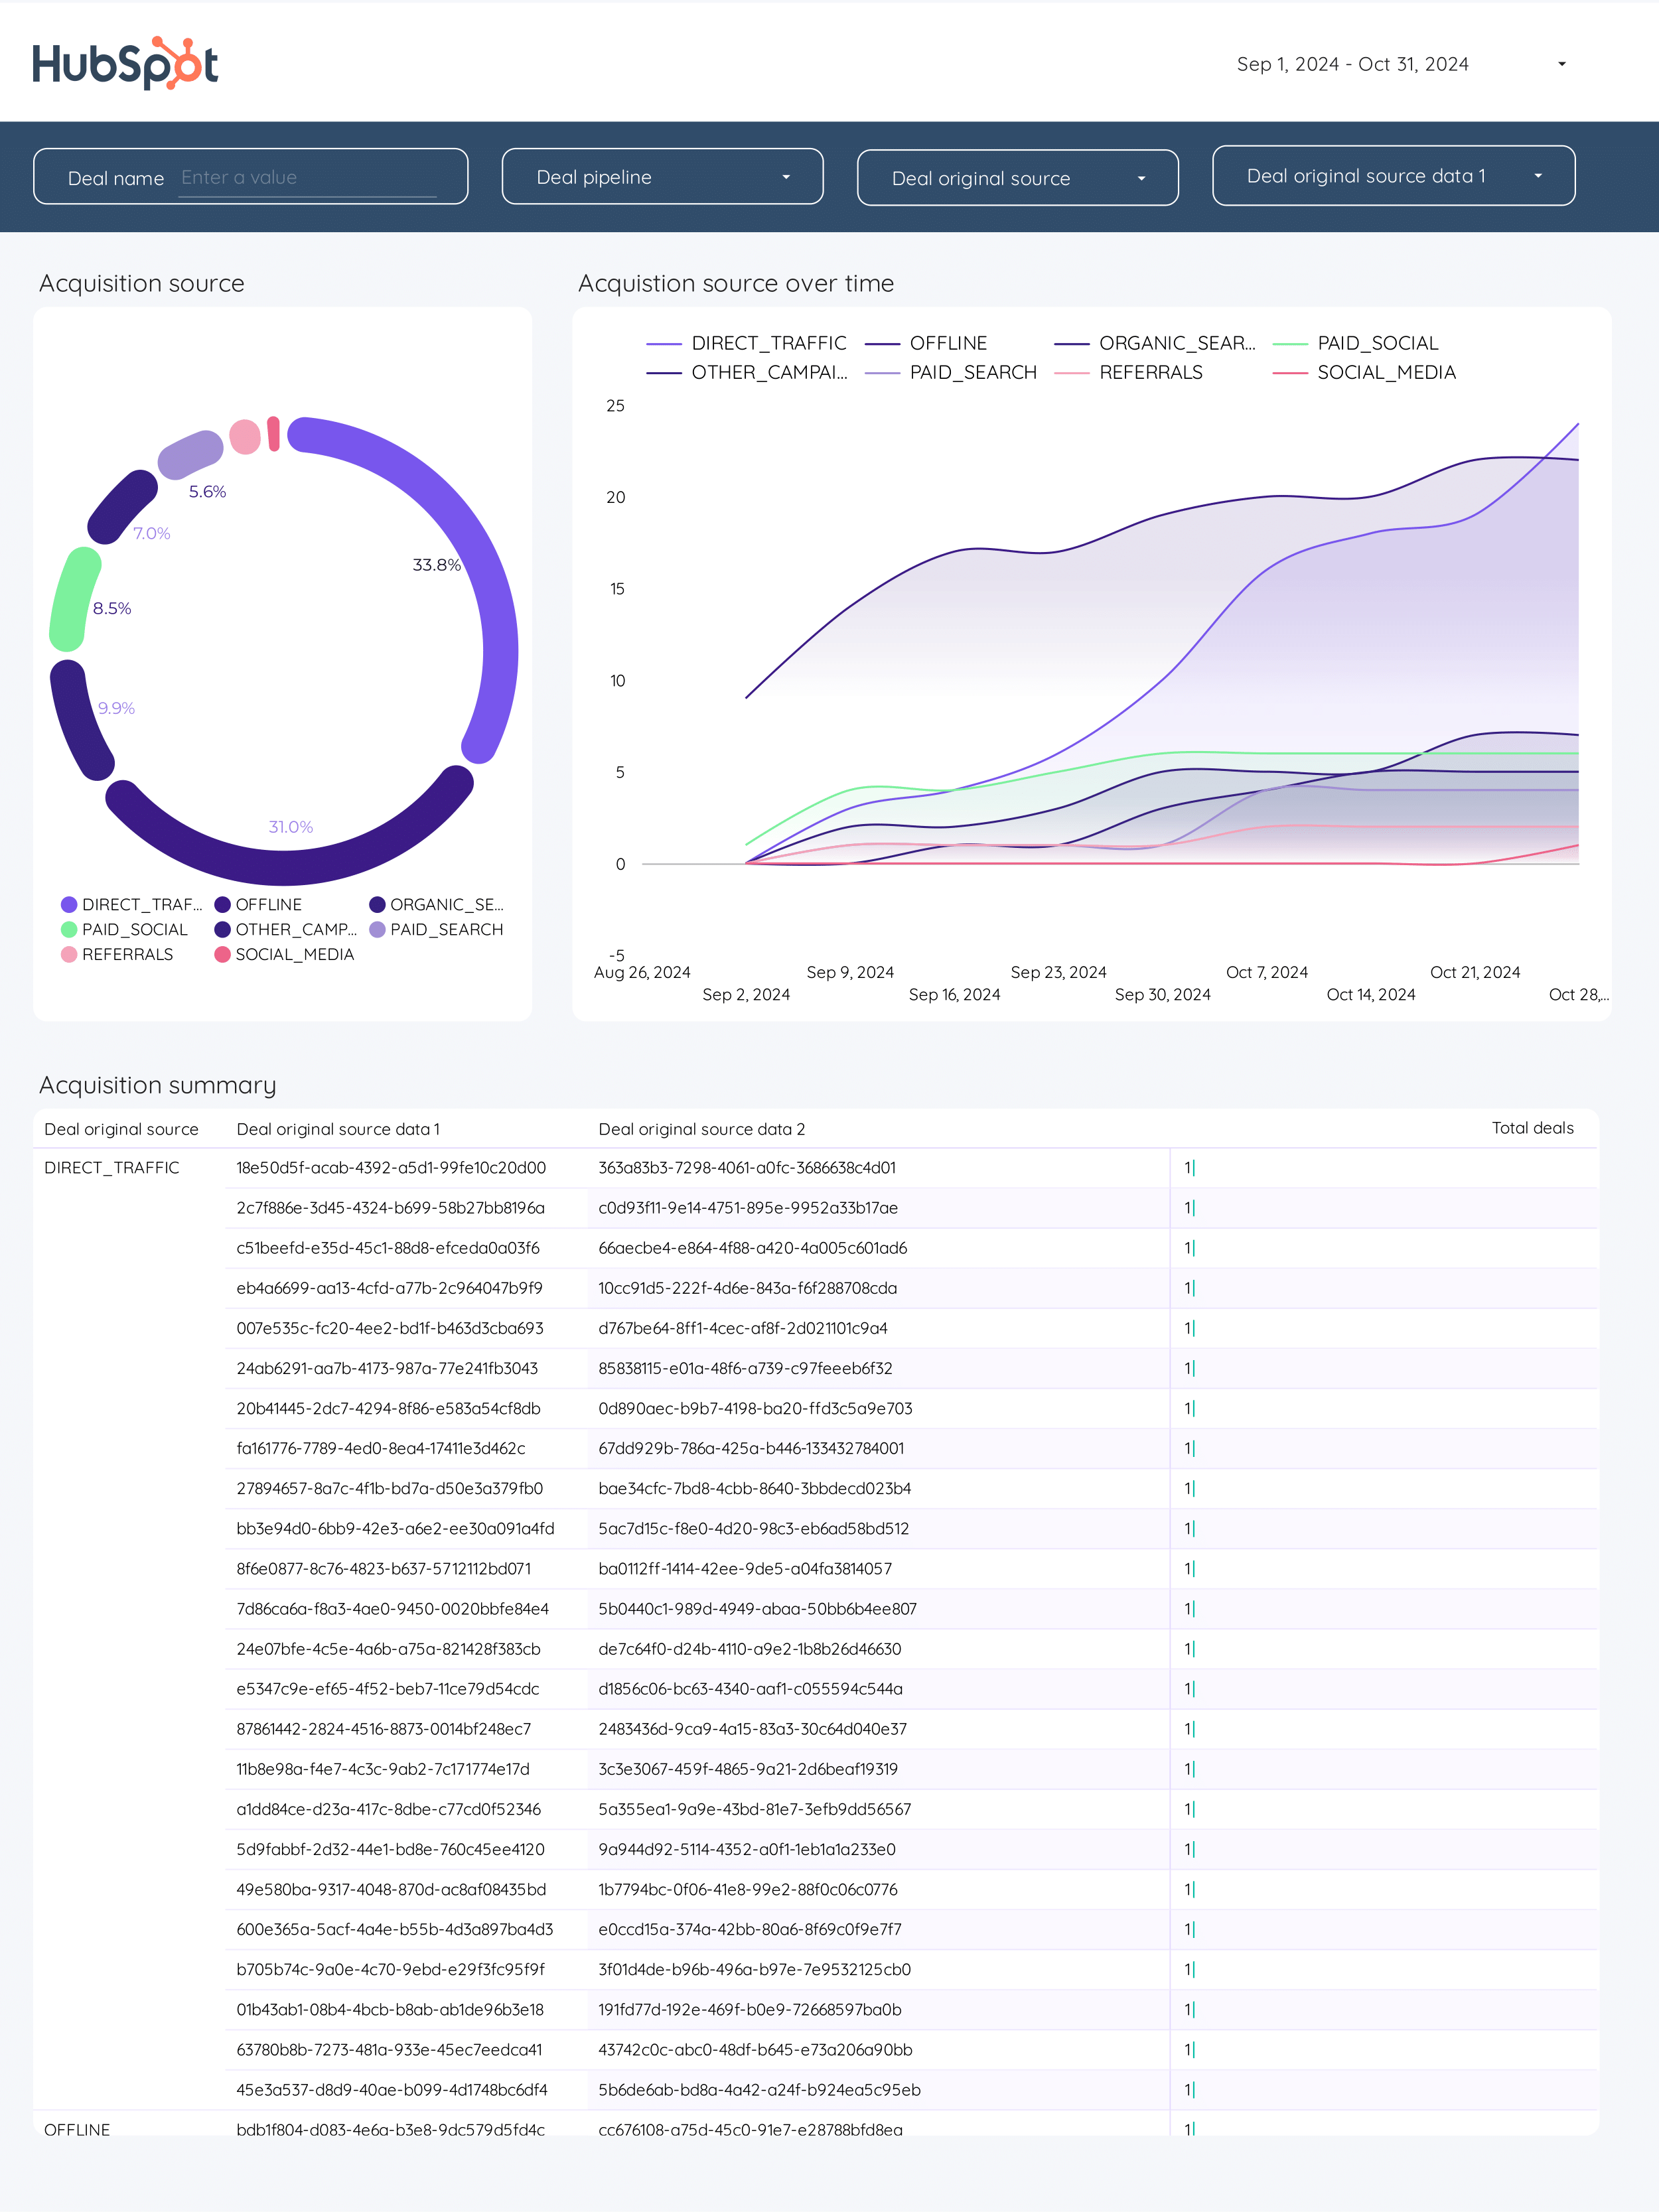
CRM Report template for Data Studio by Porter
Track new contacts, account coverage → touchpoints per deal, response rate → close rate, revenue per rep. Segment by rep, stage, source.
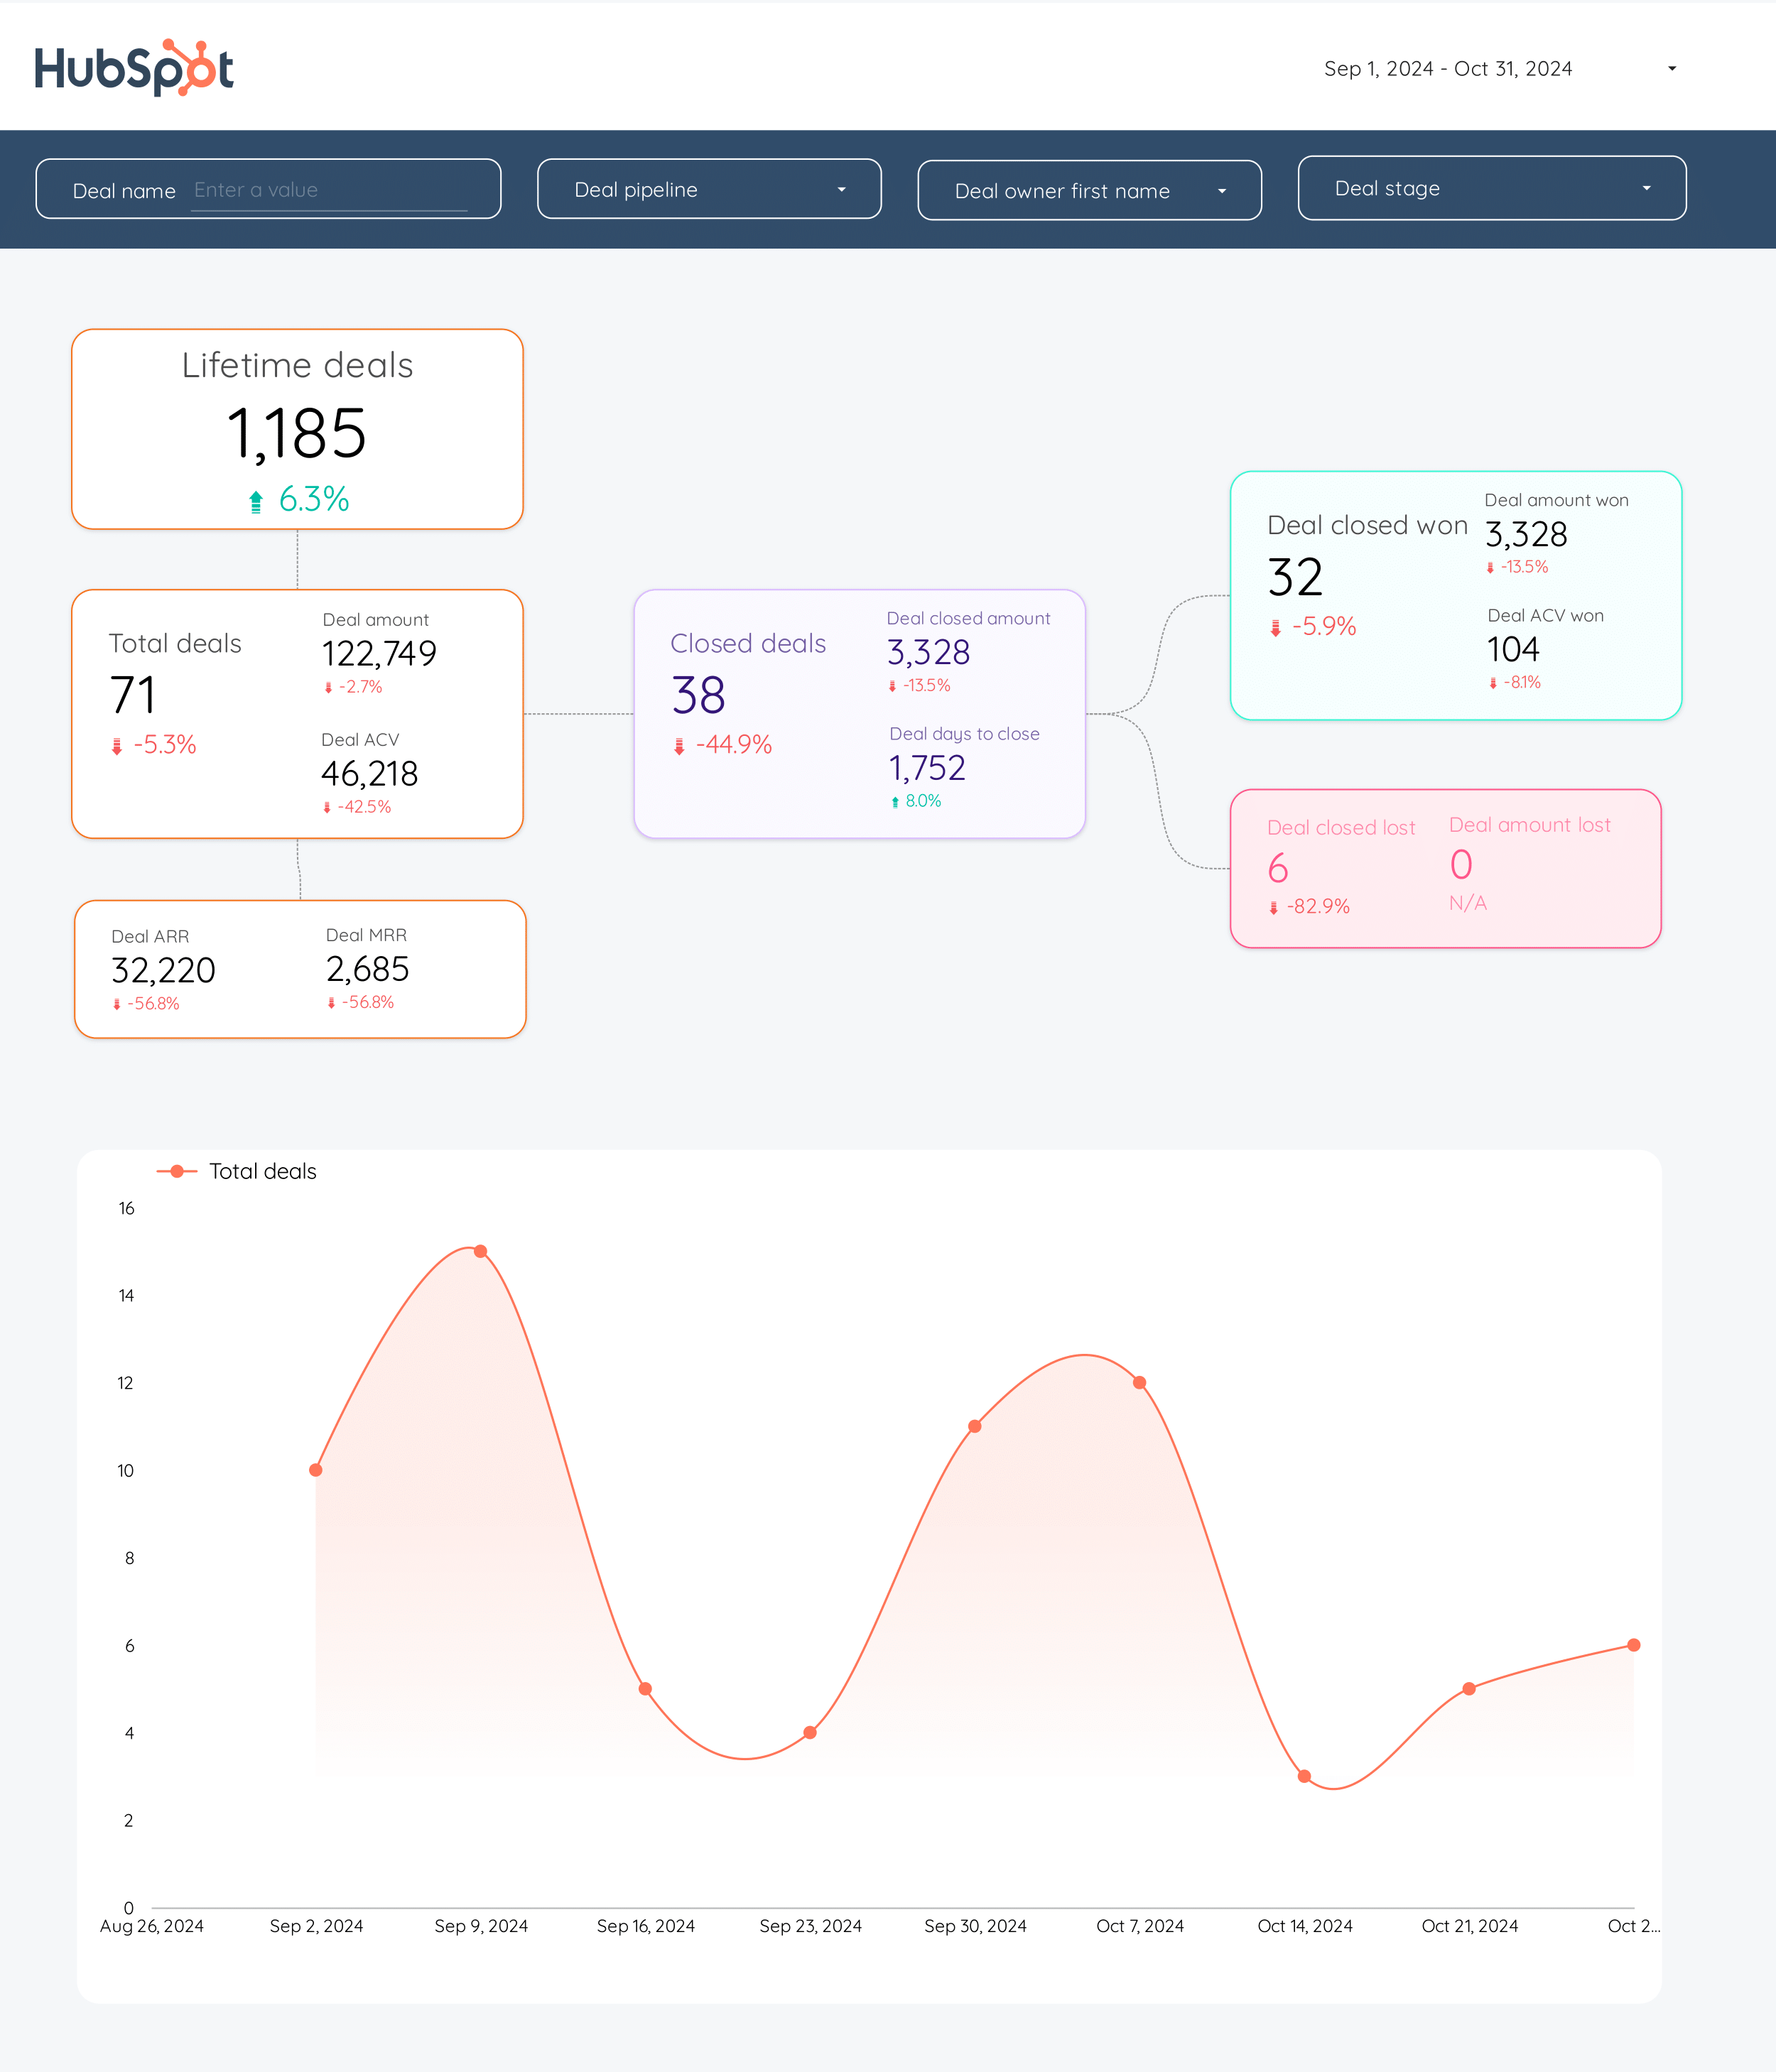
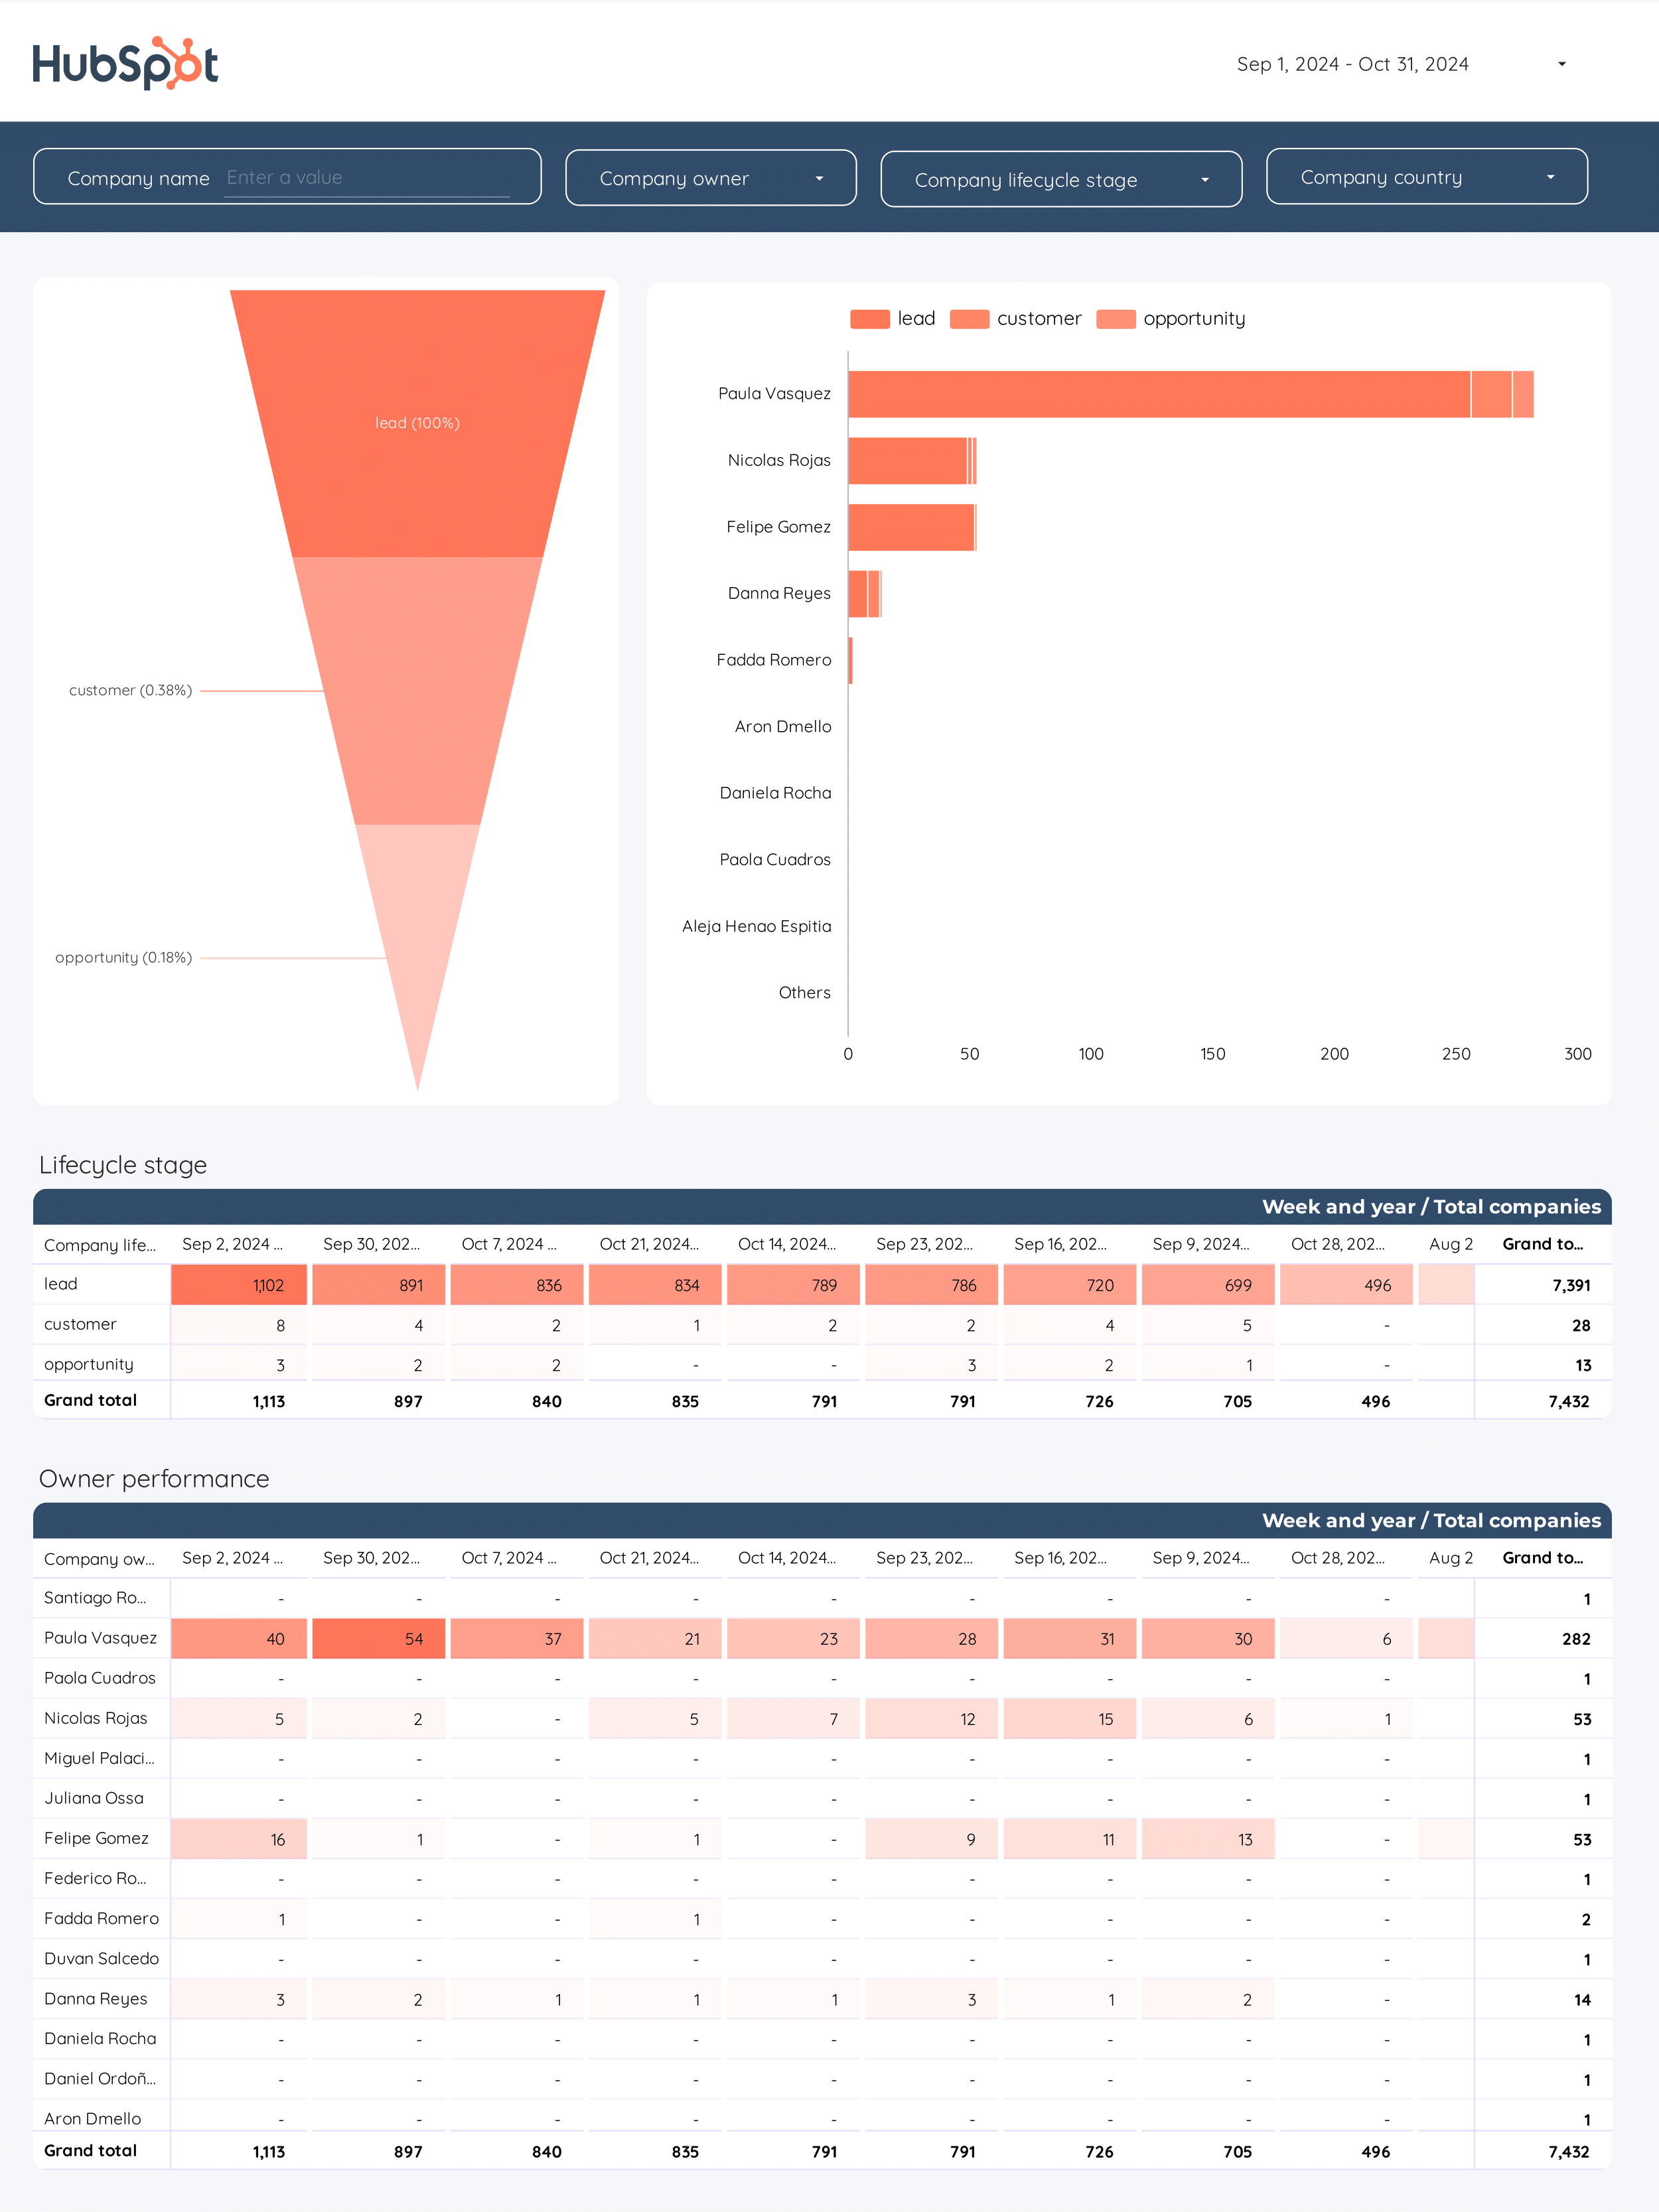
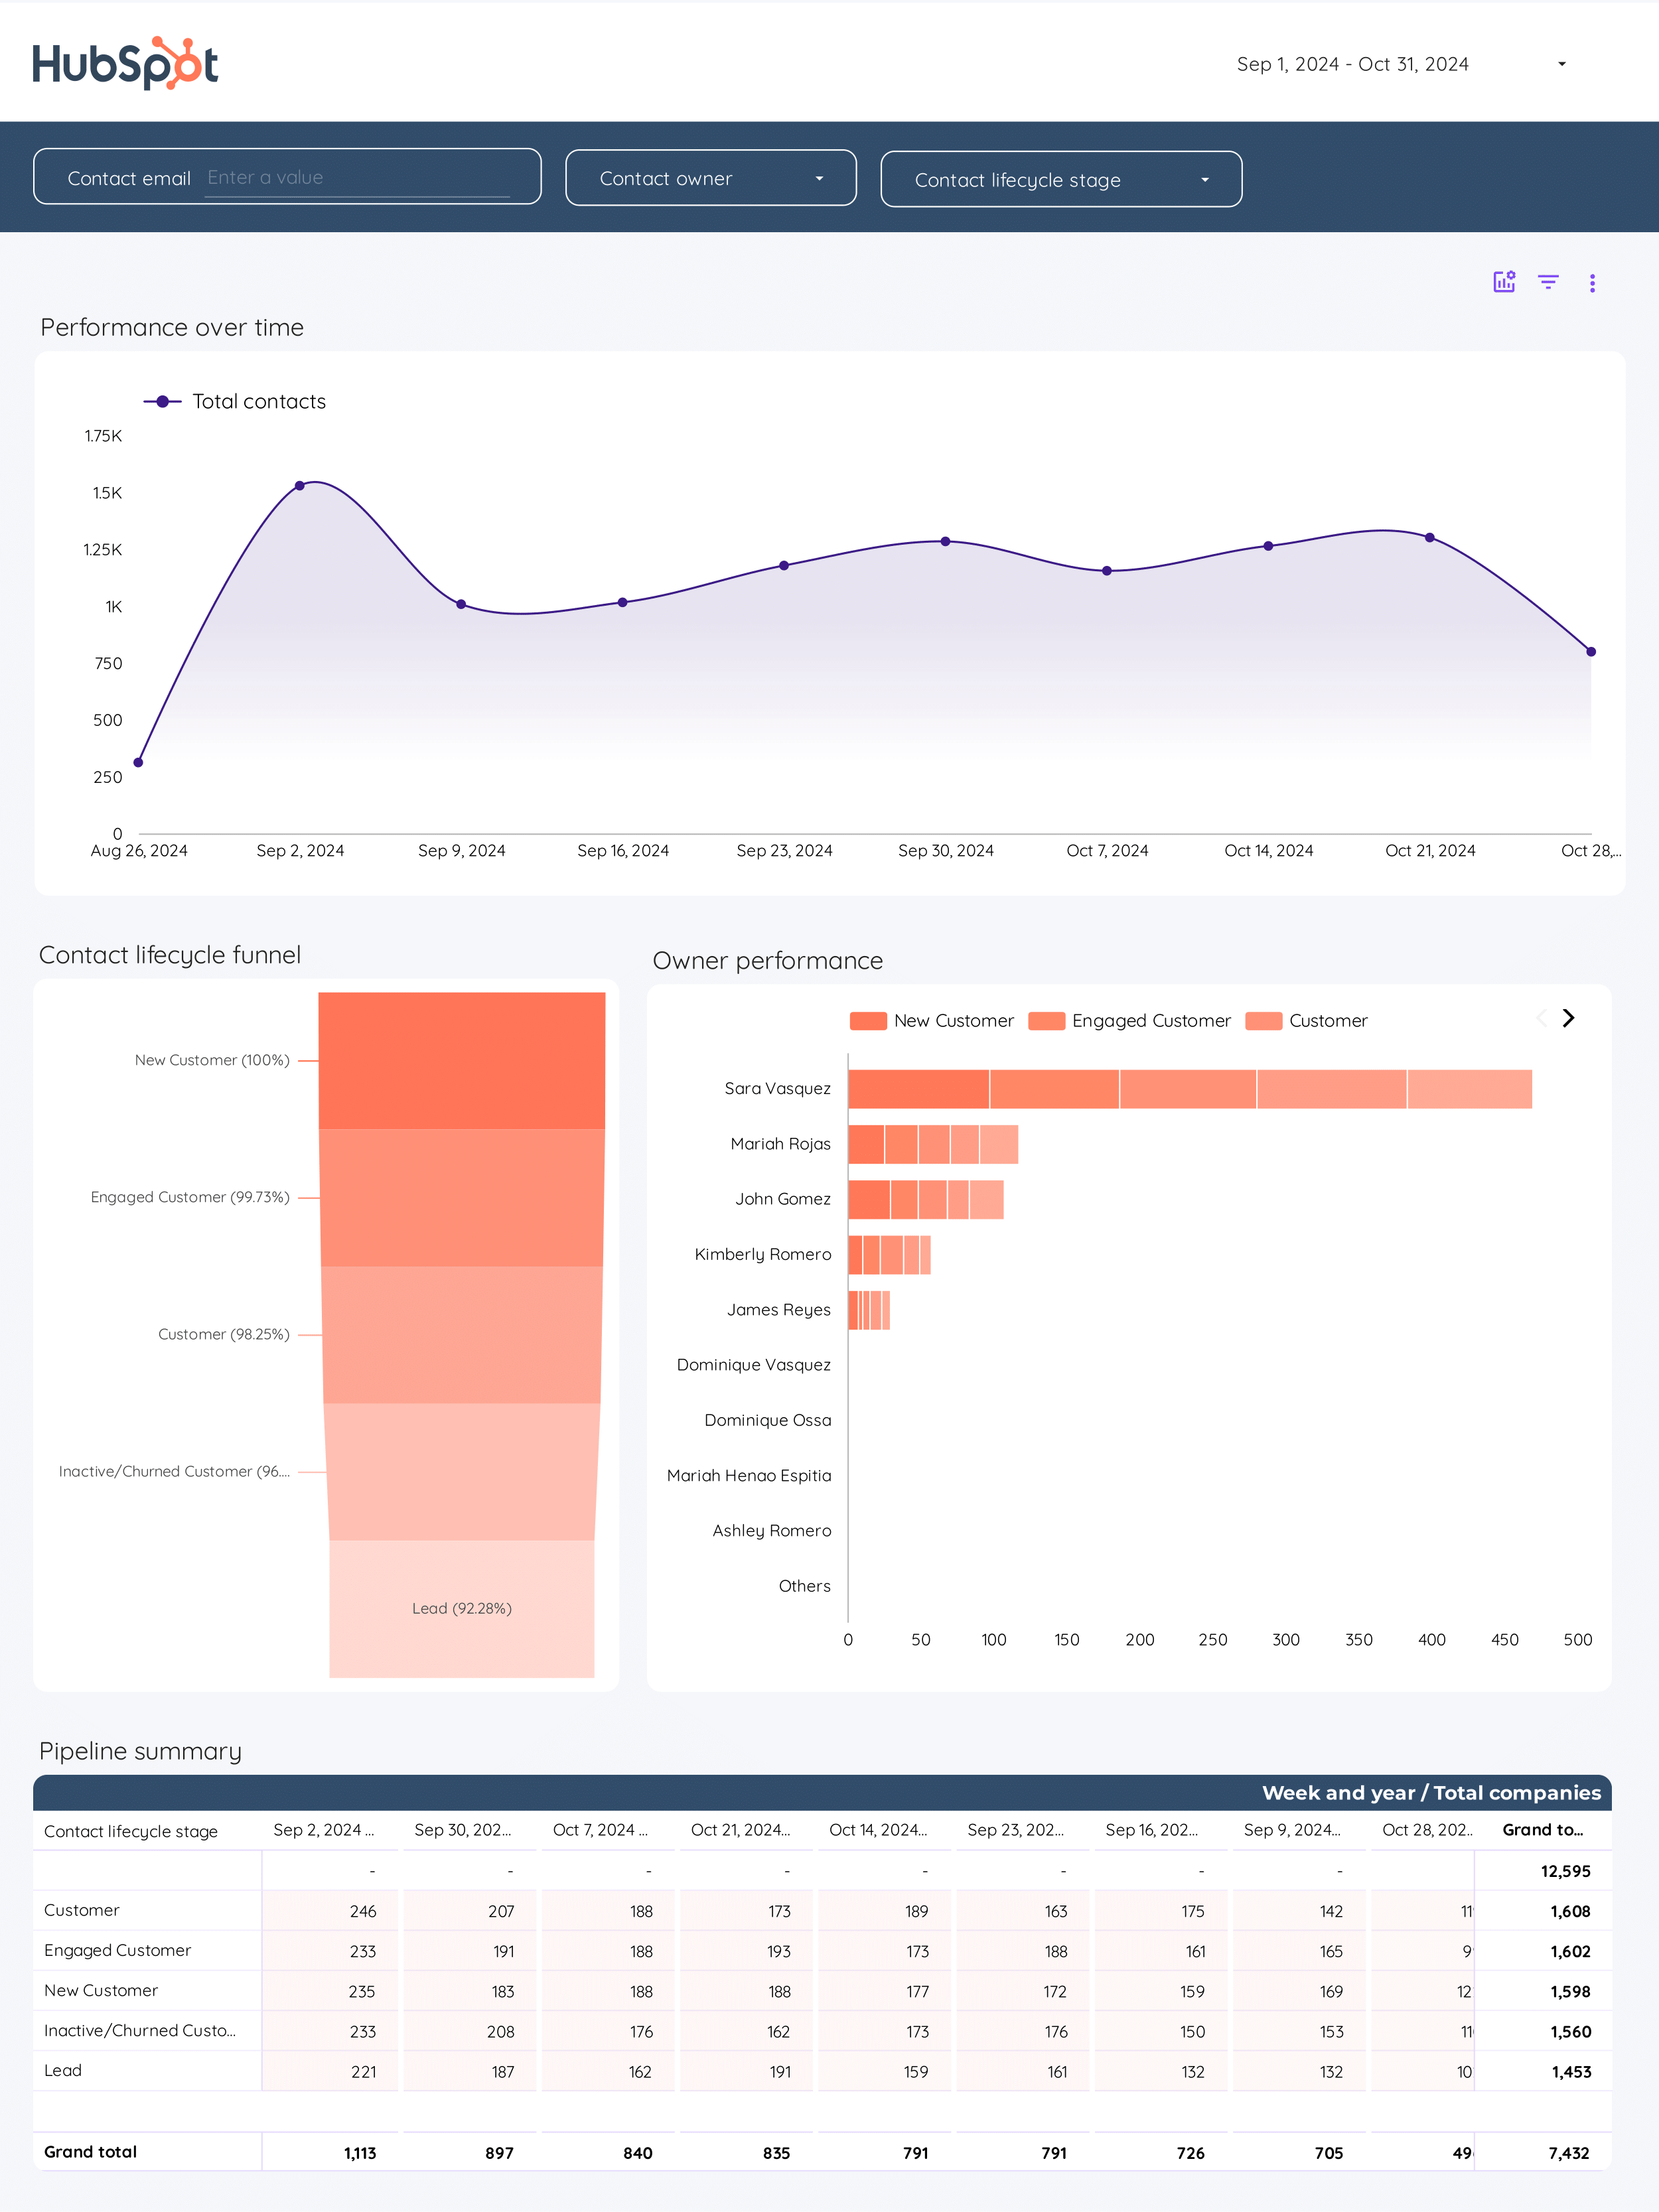
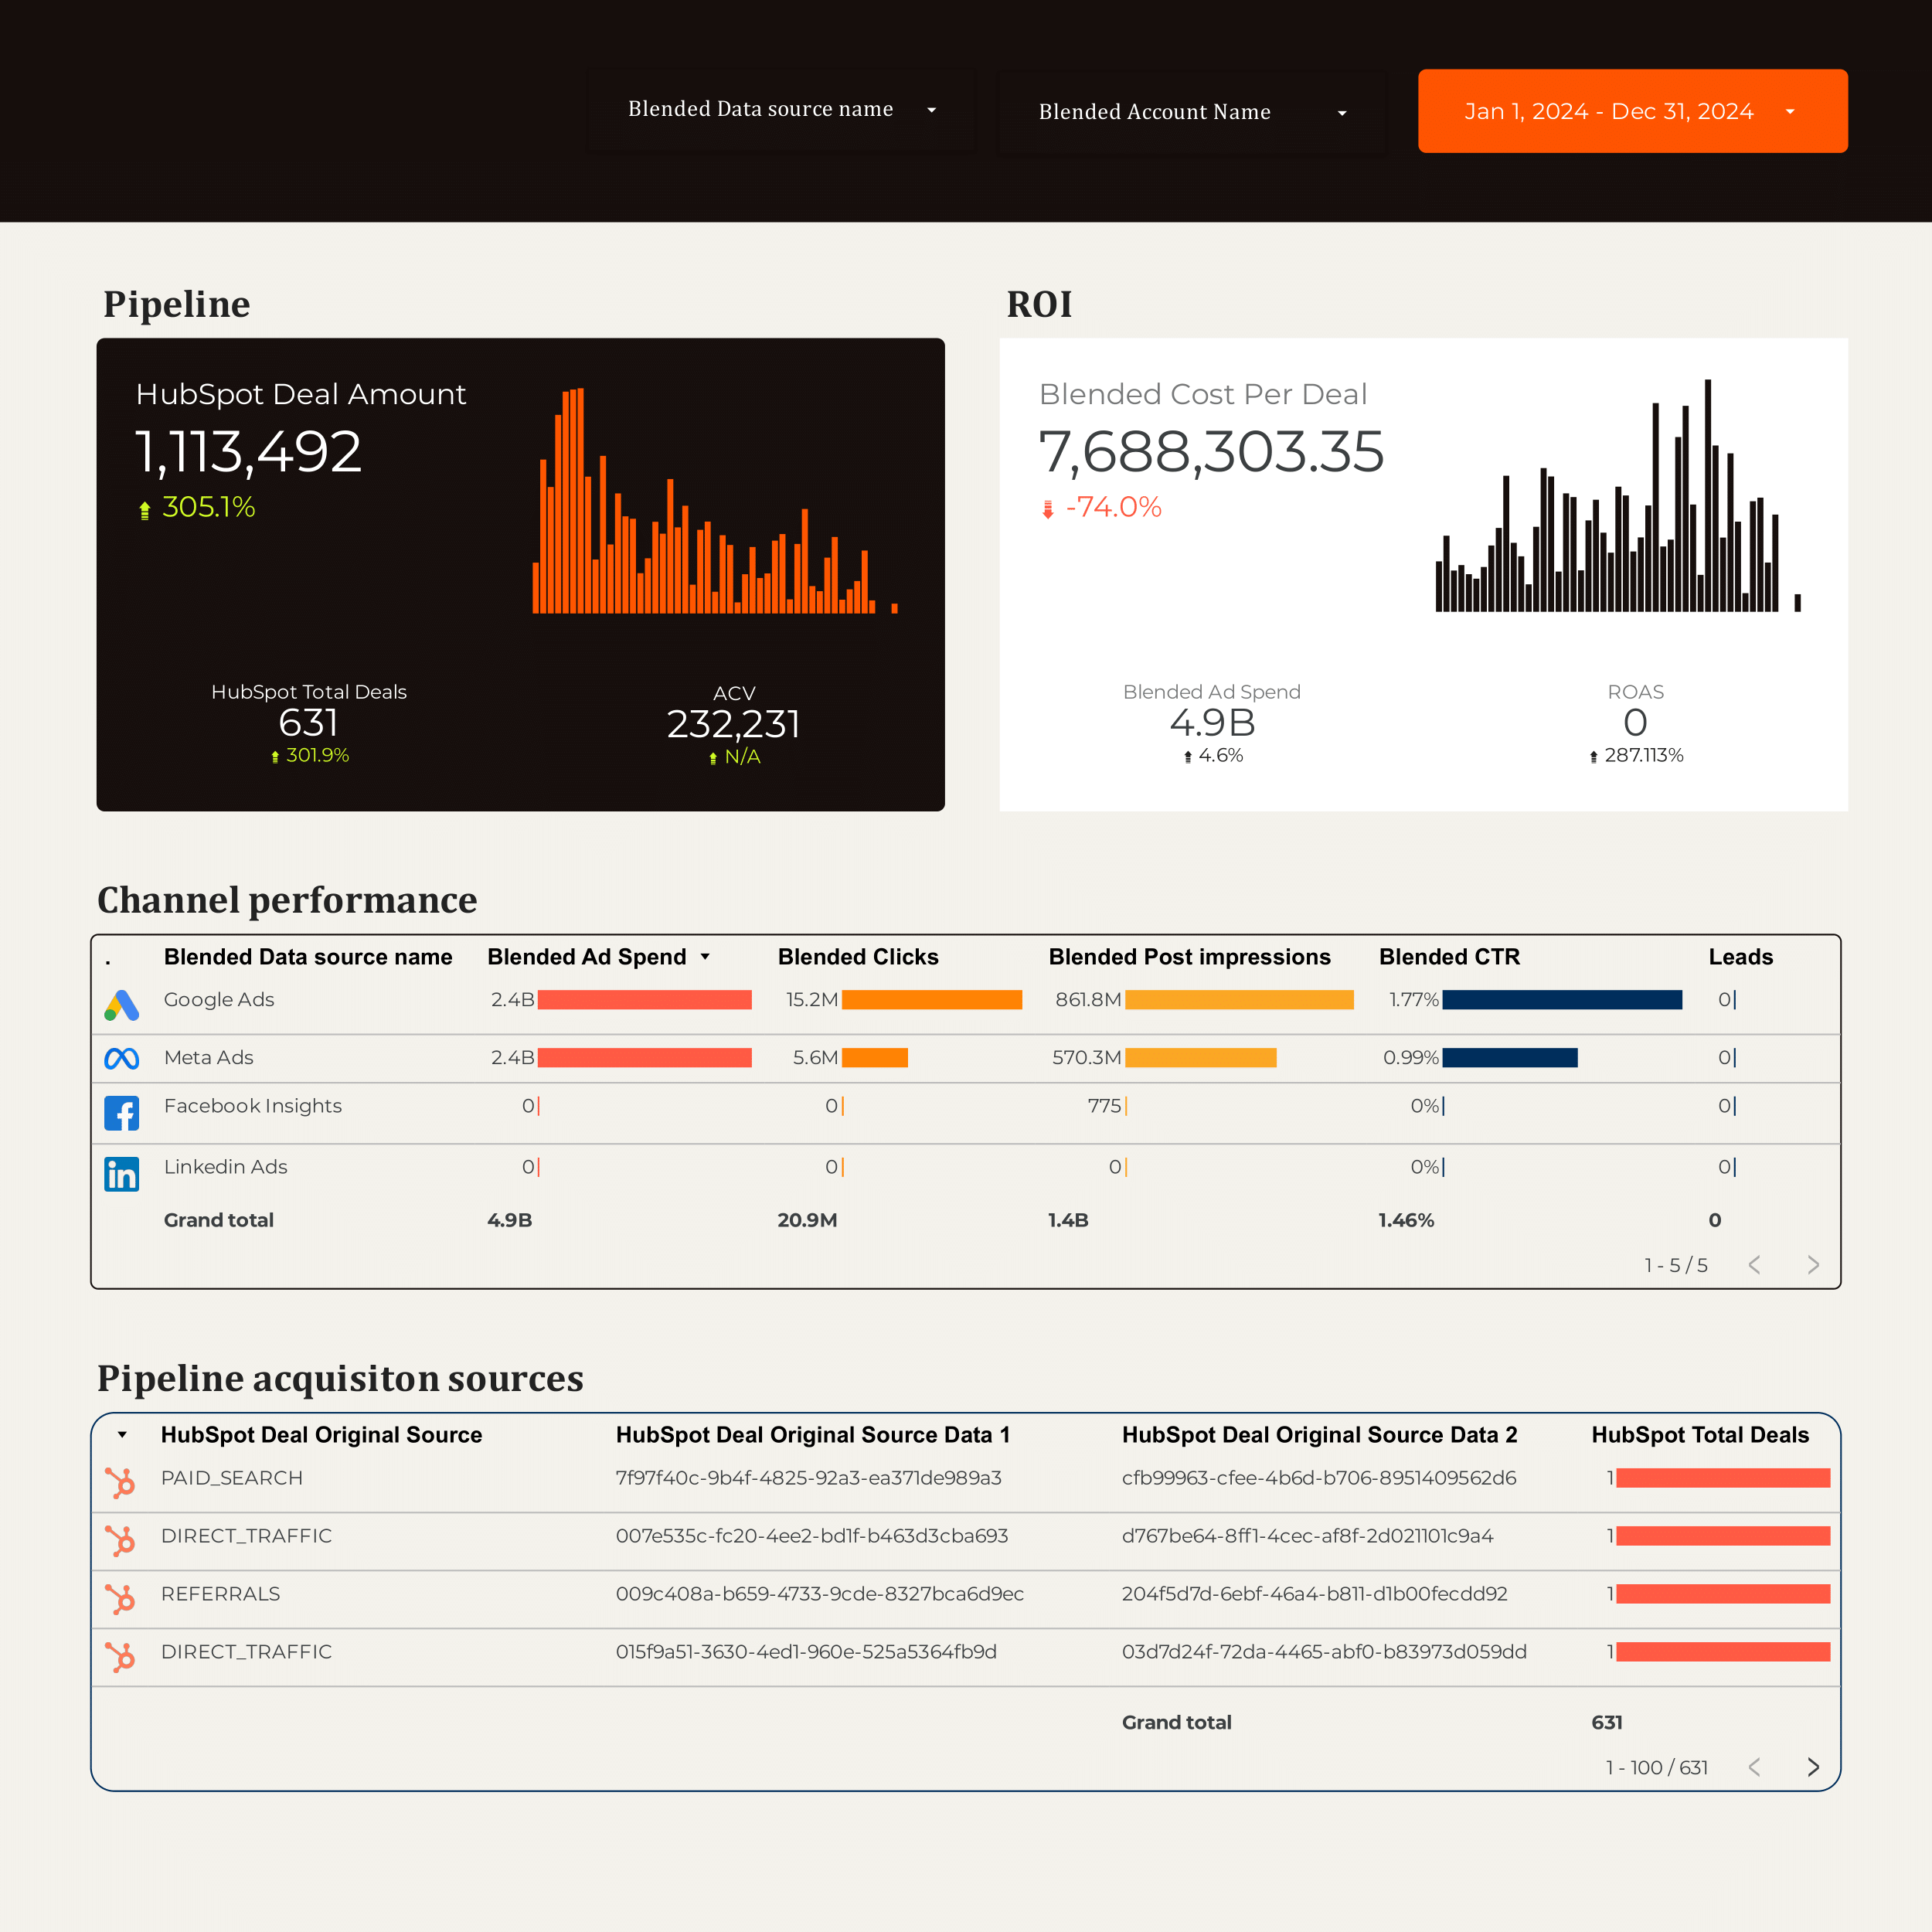
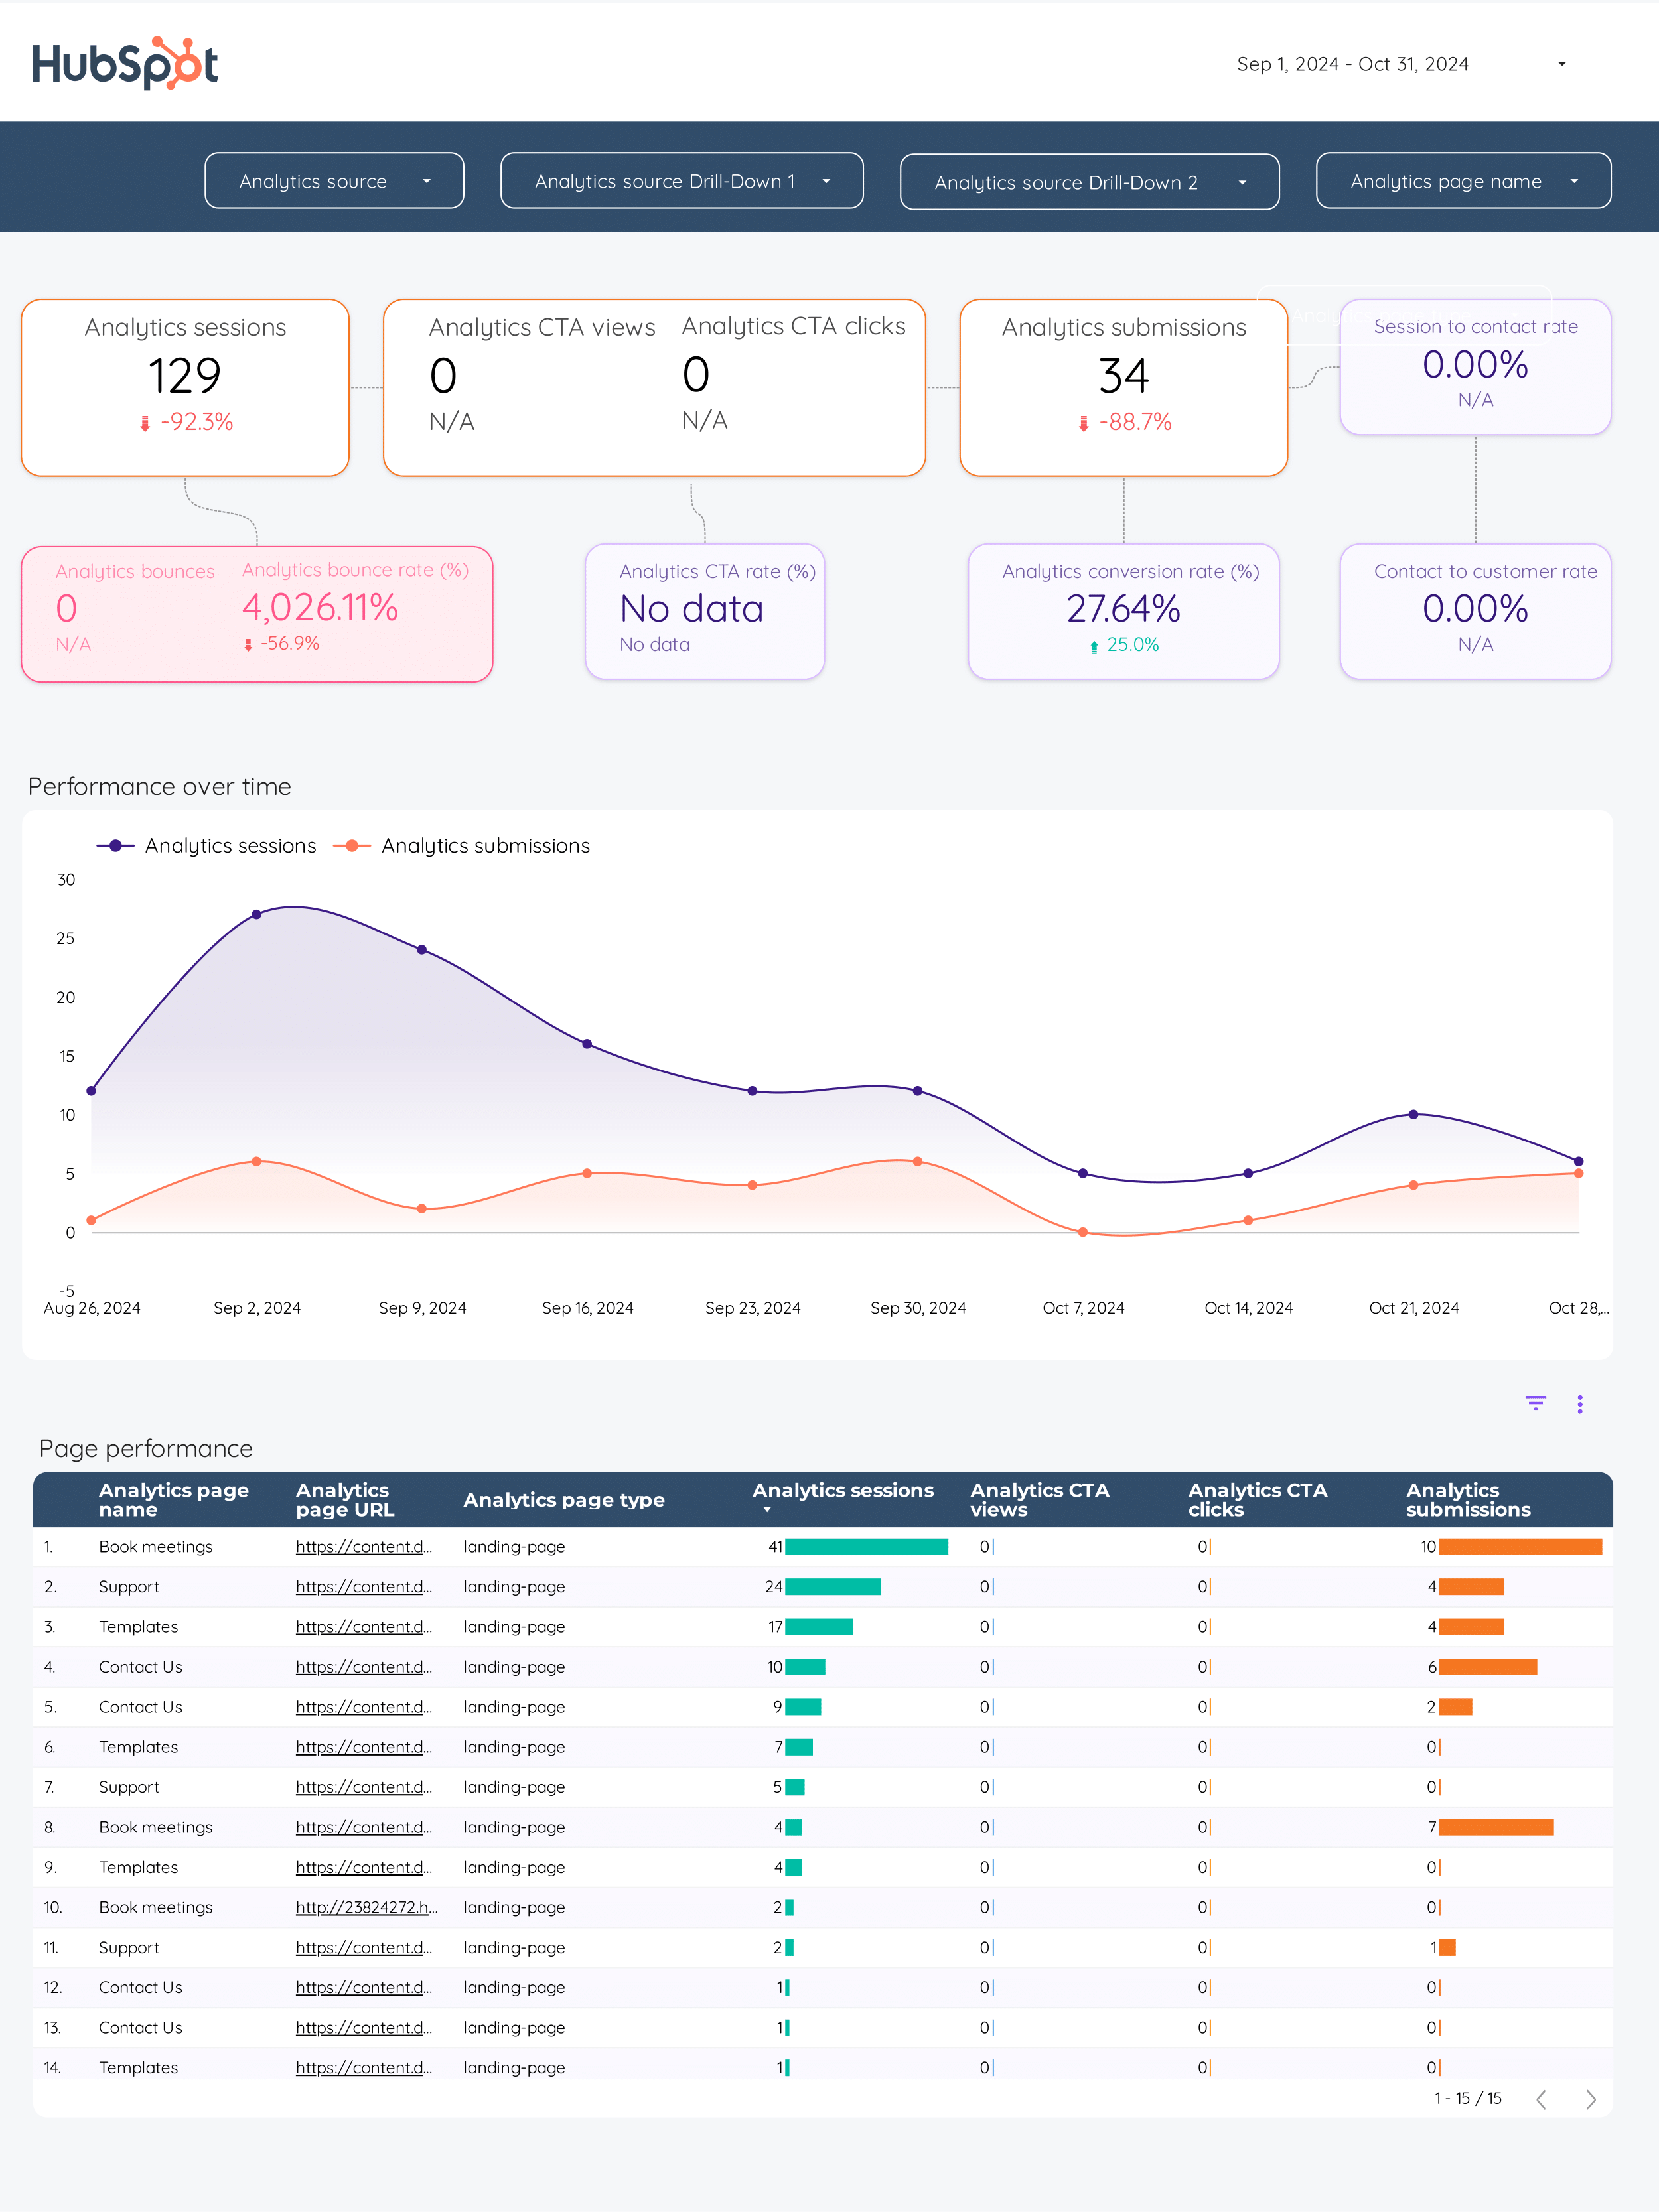
HubSpot Report template for Data Studio by Porter
Track contacts created, deliverability → email opens, form submissions → deals closed, revenue. Segment by lifecycle stage, deal stage.
LTV Report template for Data Studio by Porter
Track customer base size, cohort size → repeat purchase rate, frequency → lifetime revenue, payback period. Segment by cohort, acquisition channel.
B2B Report template for Data Studio by Porter
Track account reach, impressions → engagement by account → MQLs, SQLs, pipeline contribution. Segment by account, campaign, stage.
Sales Report template for Data Studio by Porter
Track pipeline coverage, opportunities → deal activity, touchpoints/deal → win rate, revenue, quota. Segment by rep, product, region.
Demand generation Report template for Data Studio by Porter
Track content reach, ad impressions → webinar registrations, downloads → pipeline value, opportunity rate. Segment by campaign, content type, stage.
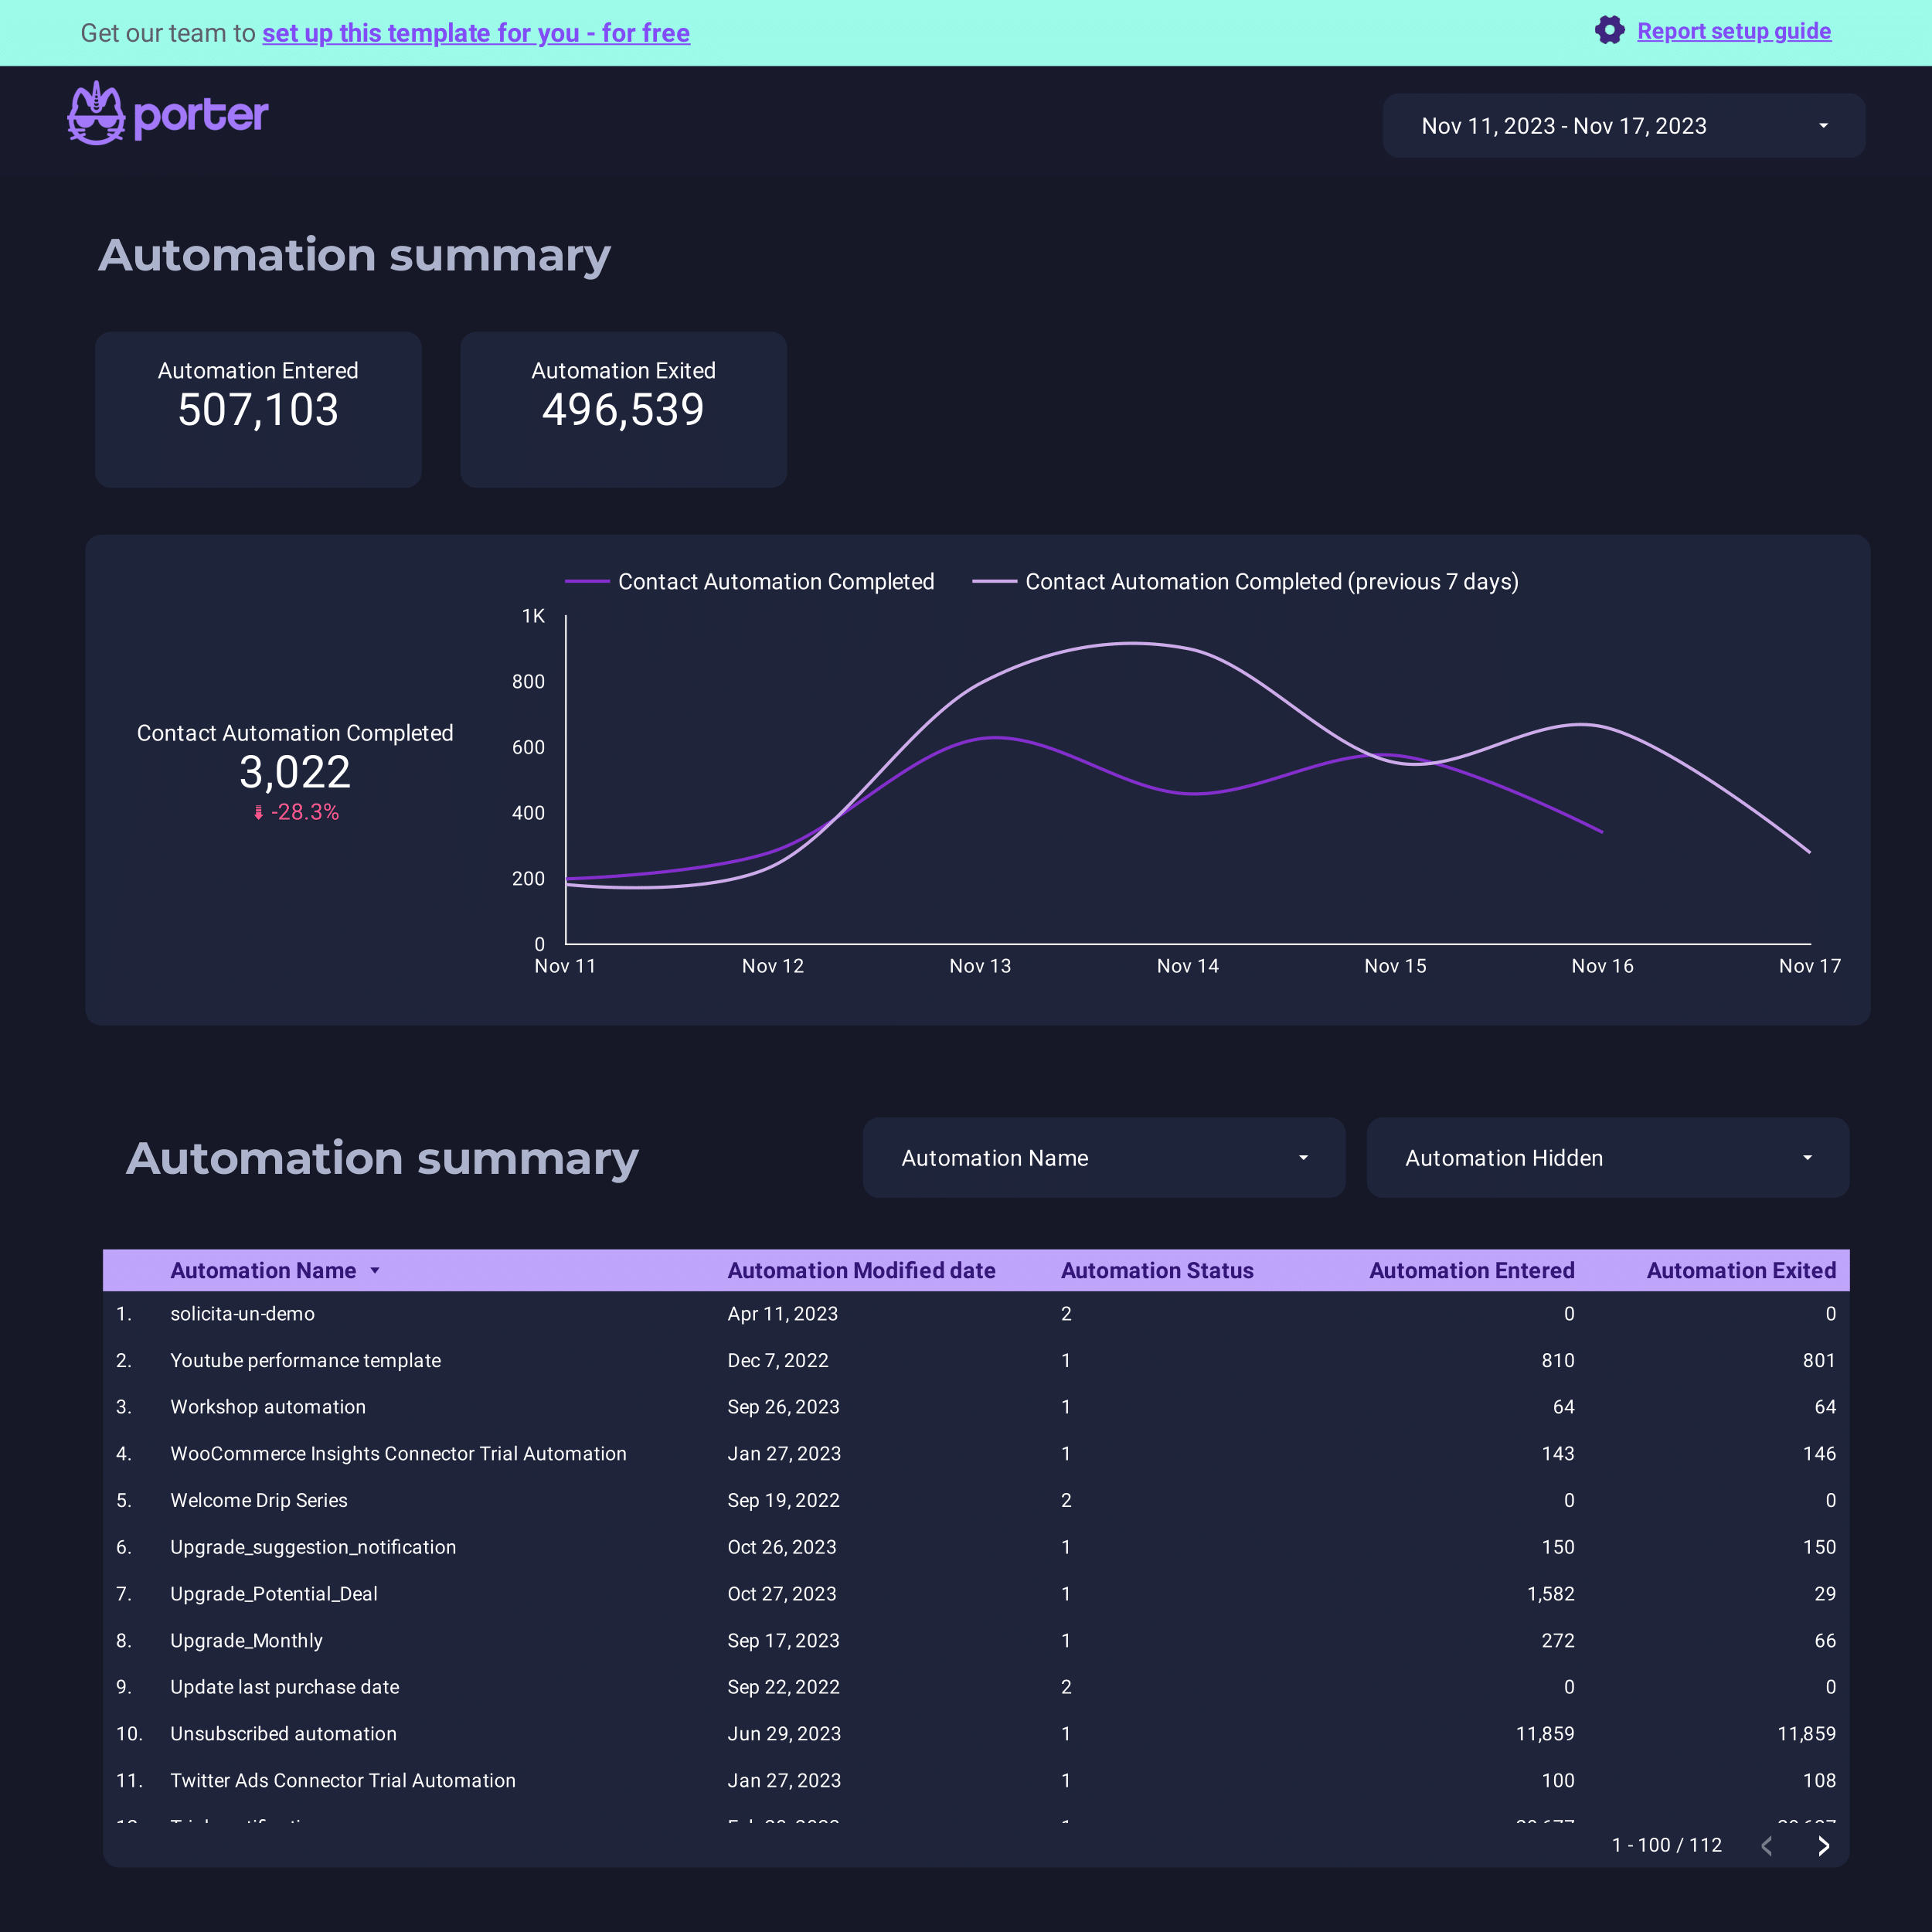
ActiveCampaign Report template for Data Studio by Porter
Track contacts, email deliverability → open rate, click rate → conversion events, deals. Segment by automation, list, campaign.
Inbound marketing Report template for Data Studio by Porter
Track blog traffic, social reach → content downloads, form views → MQLs, SQLs, pipeline generated. Segment by content asset, channel, stage.
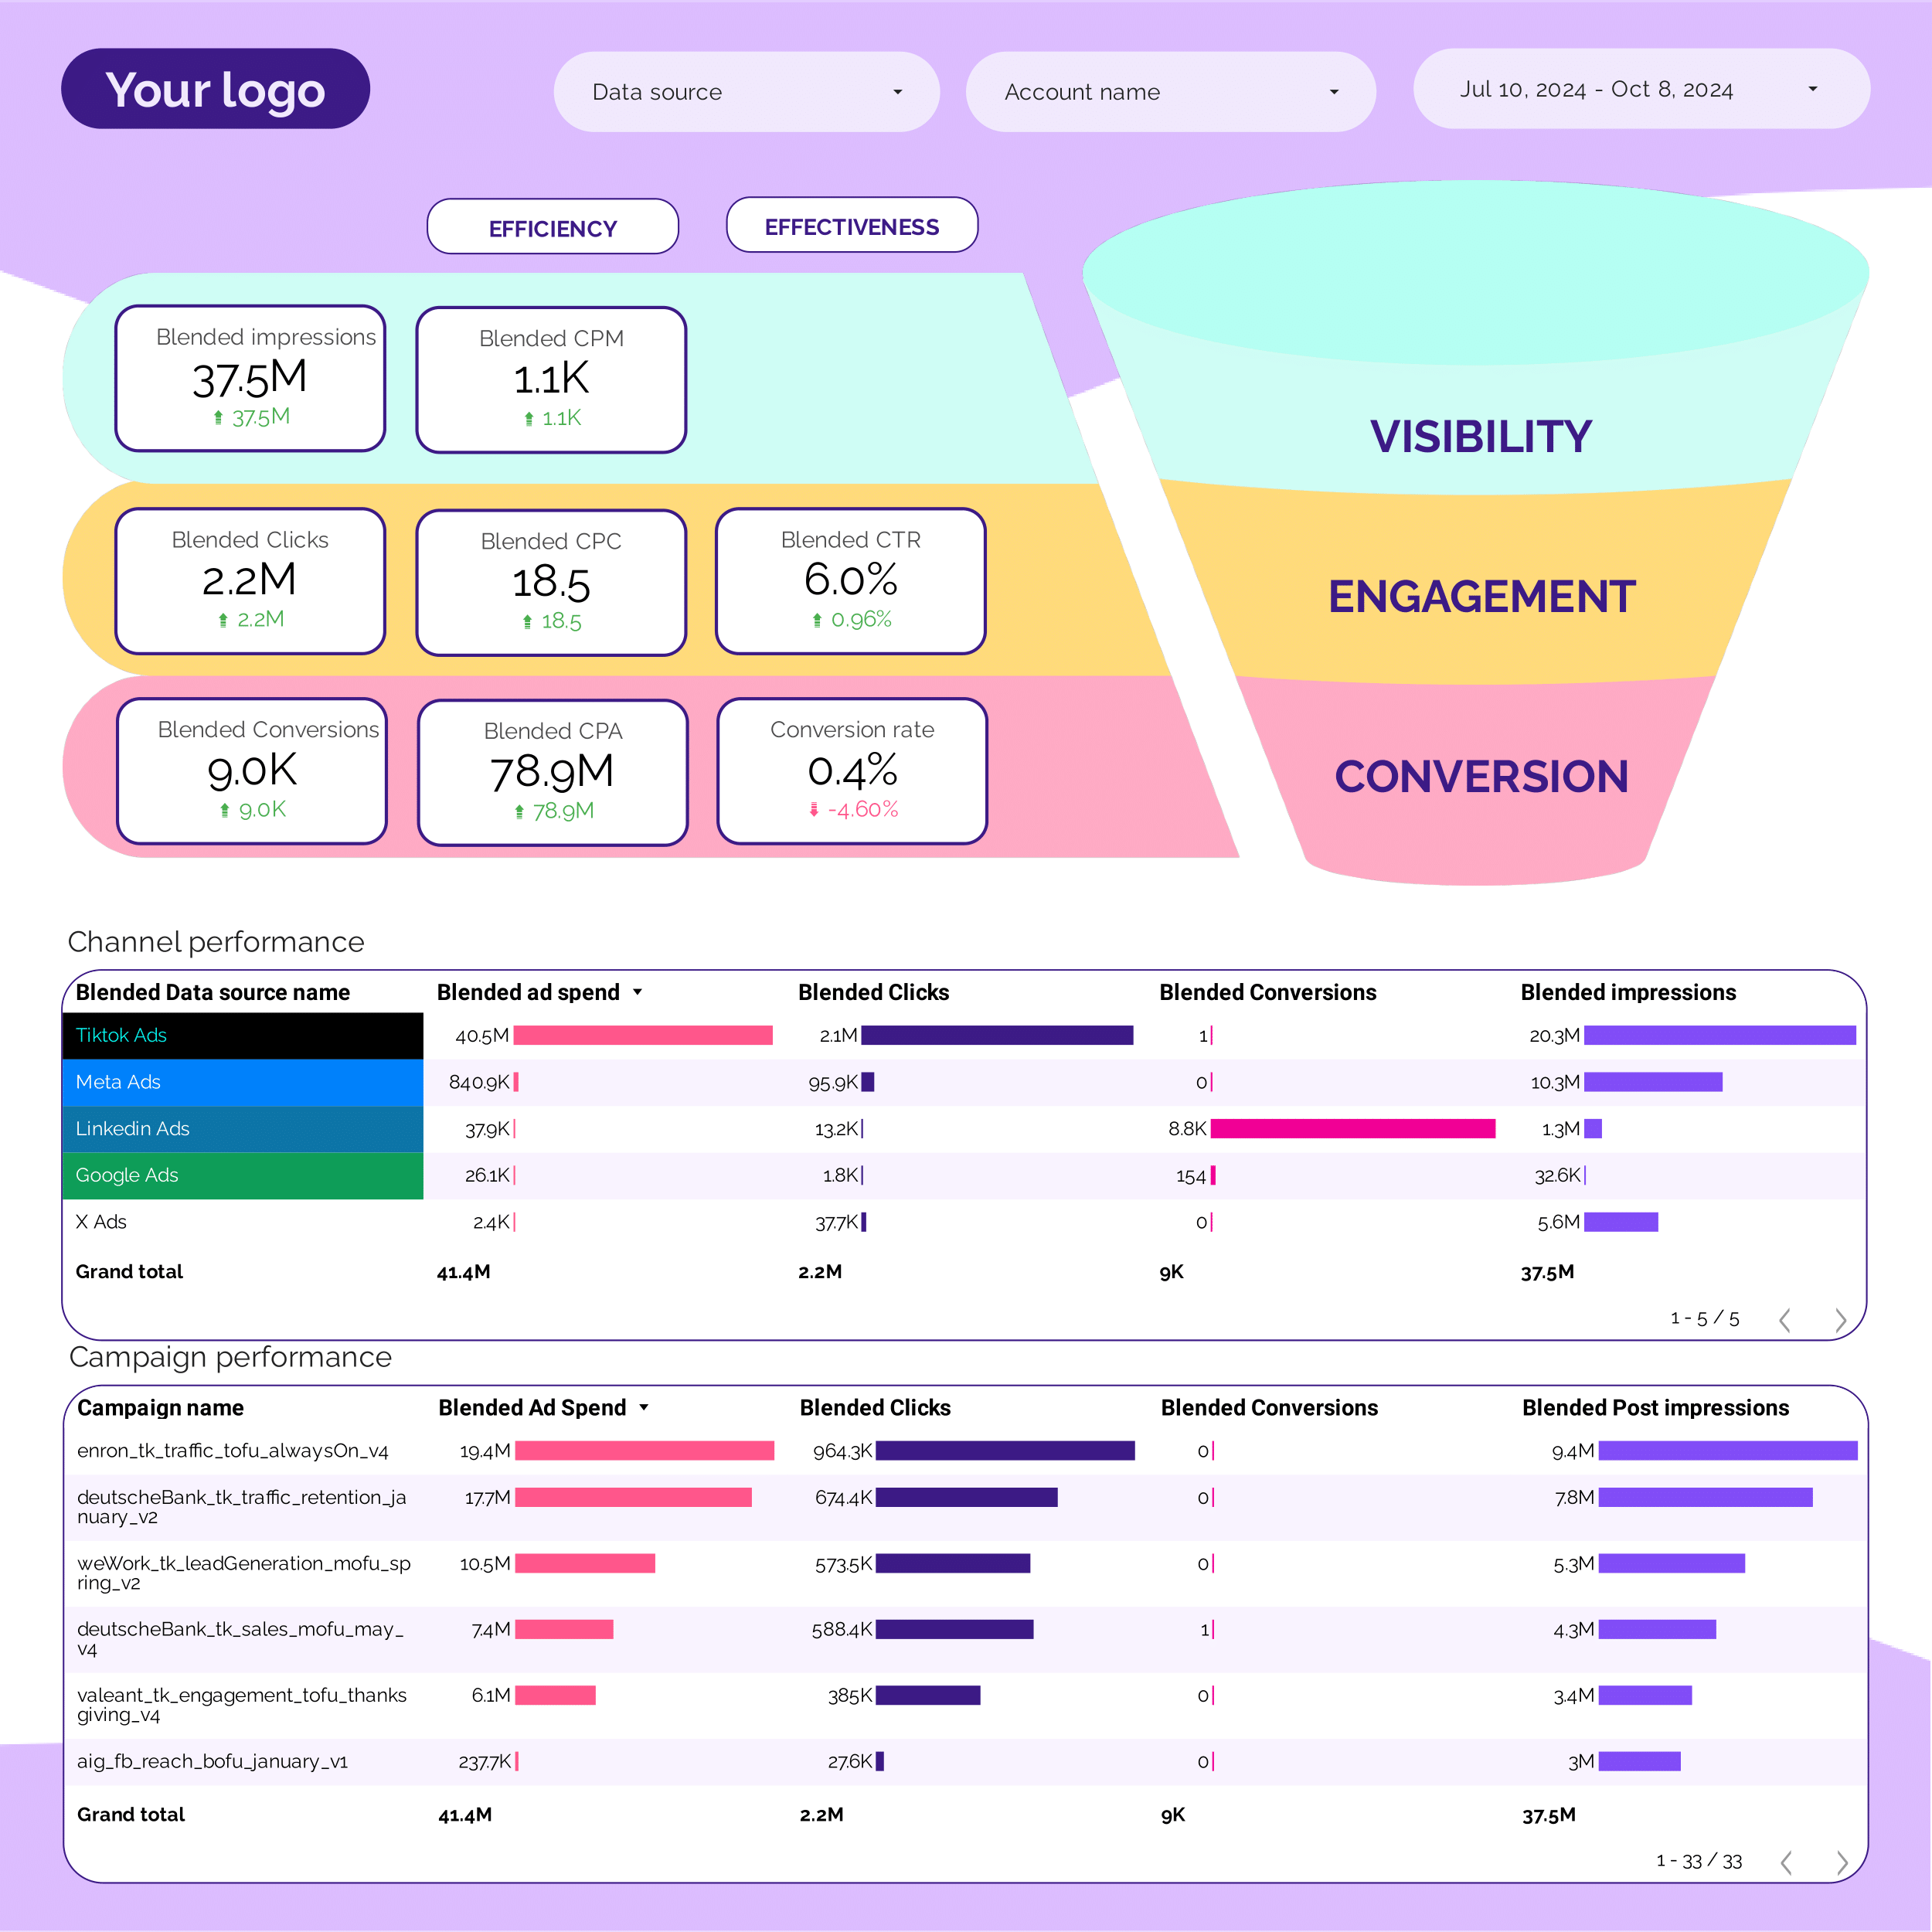
PPC Funnel Report template for Data Studio by Porter
Track top-funnel reach → mid-funnel engagement → bottom-funnel ROAS, CPA. Segment by funnel stage, campaign.
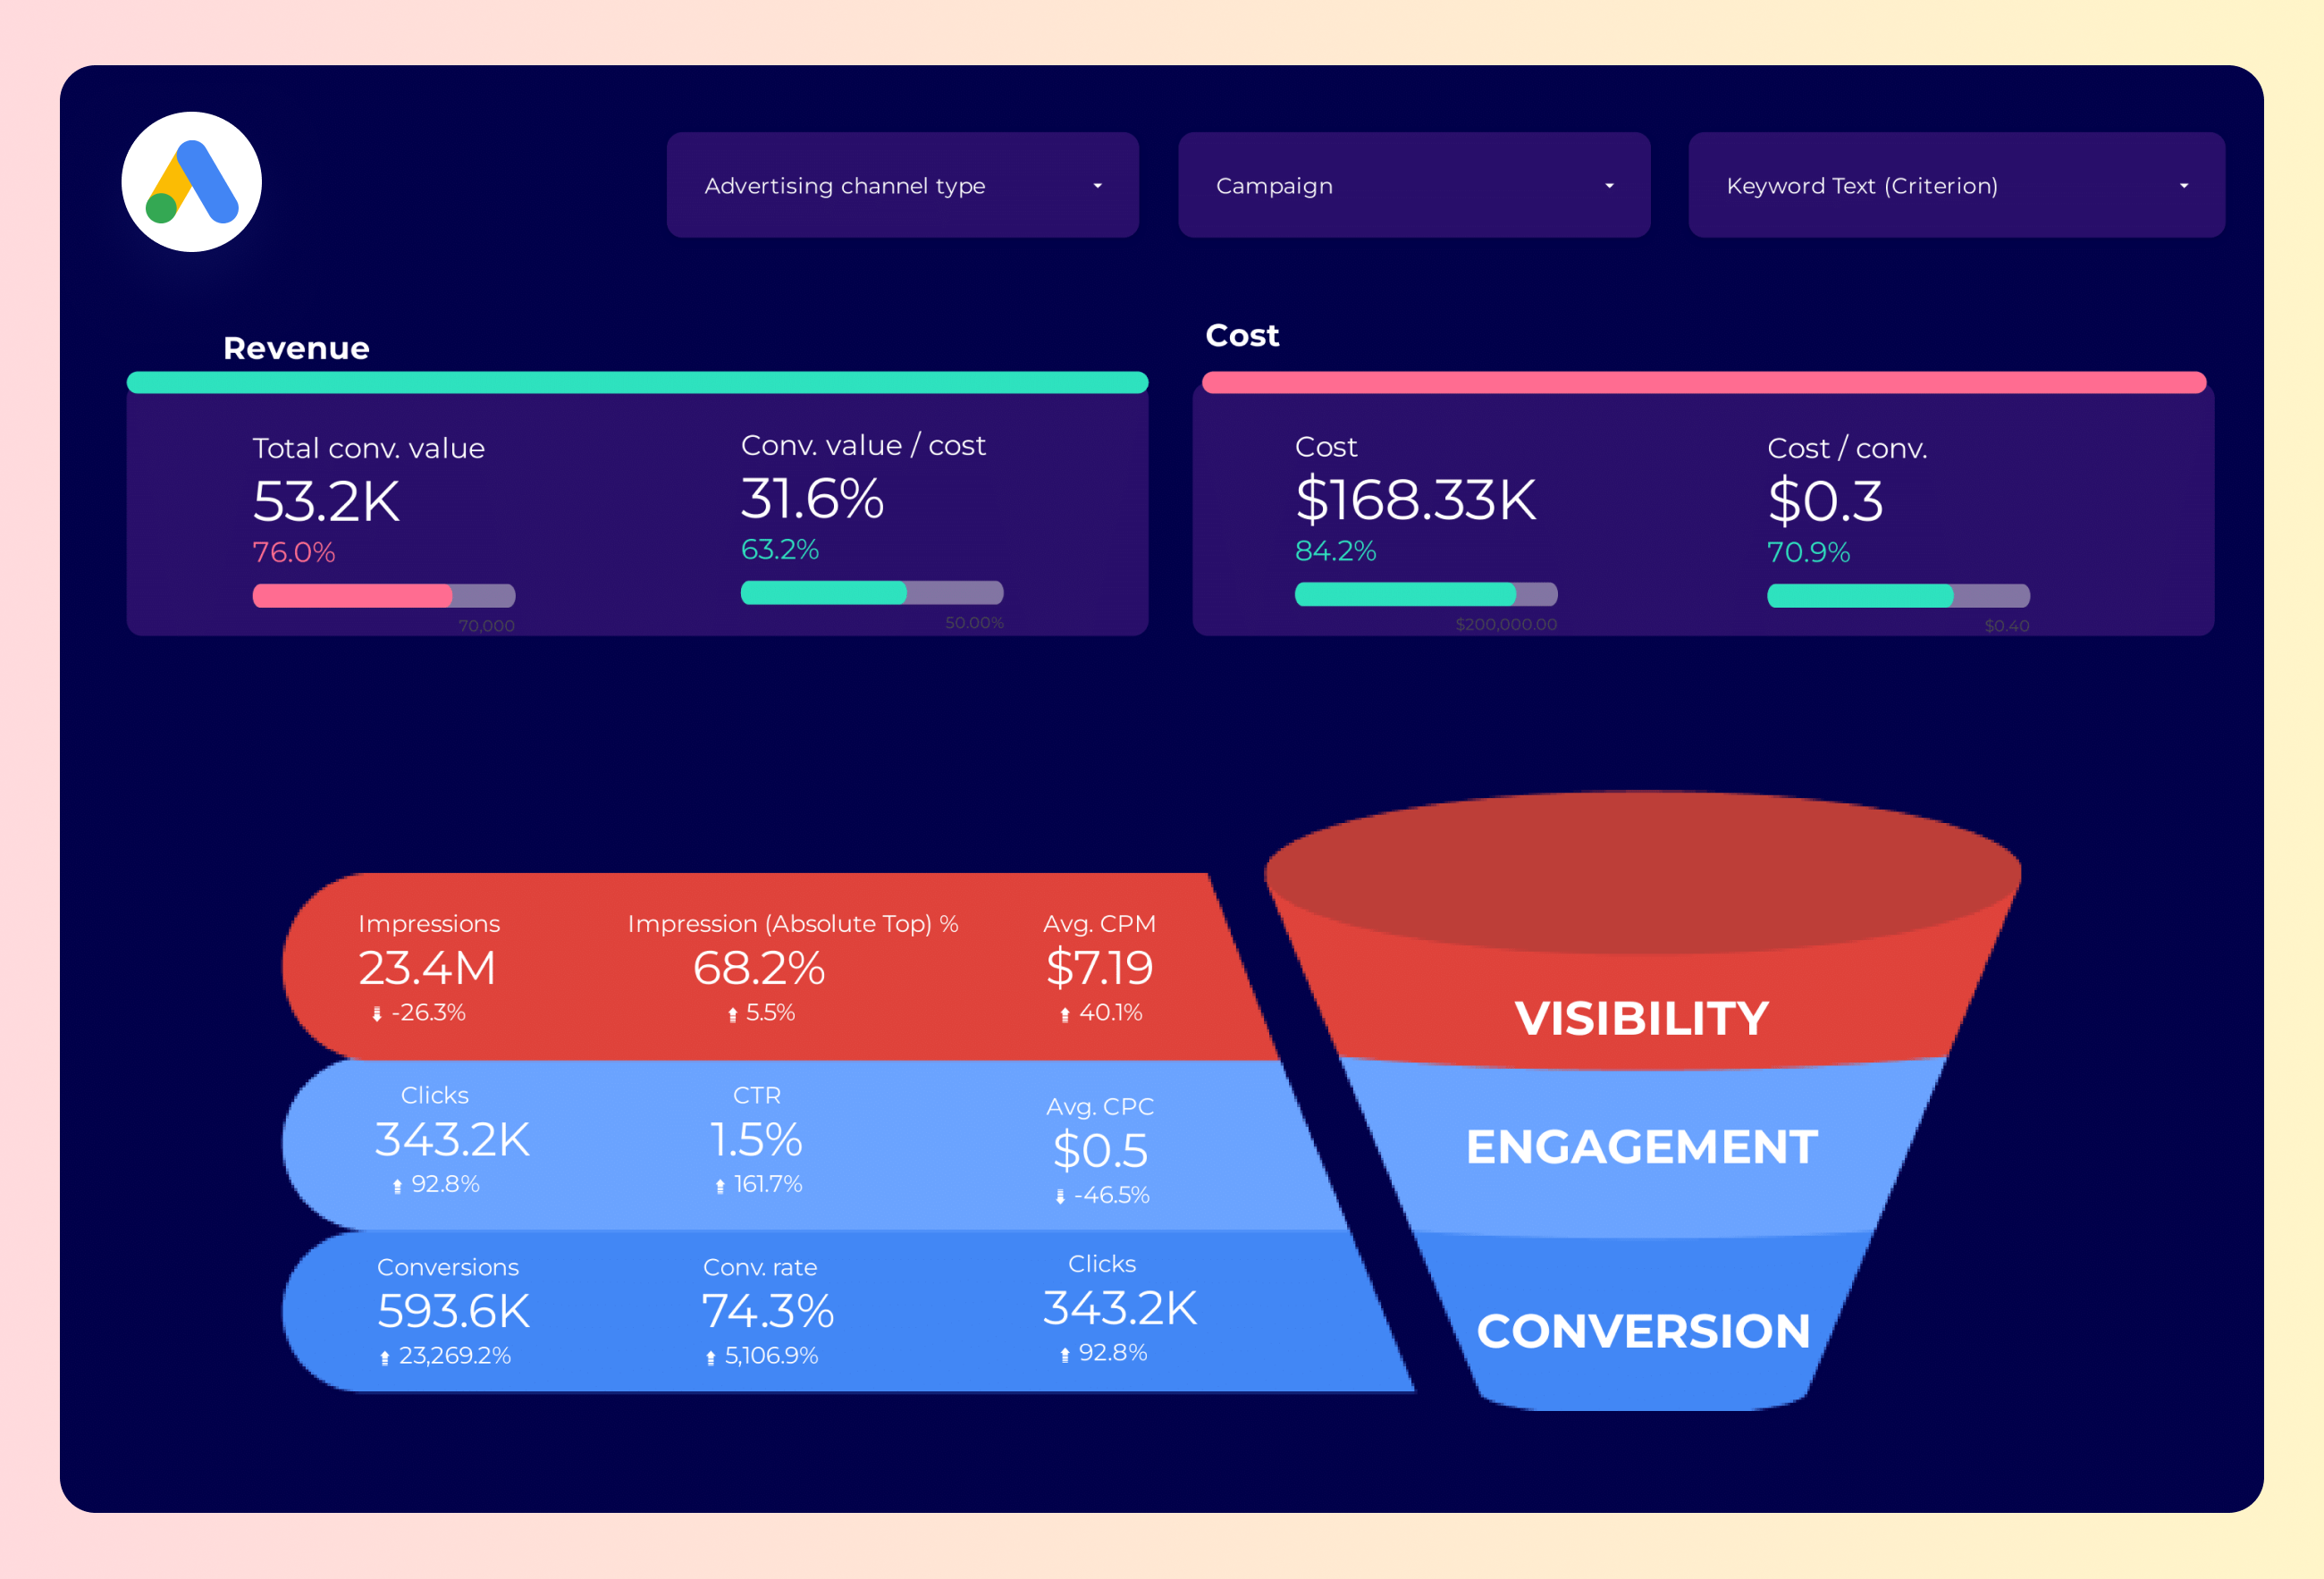
Google Ads Funnel Report template for Data Studio by Porter
Track top-funnel impressions → mid-funnel clicks → bottom-funnel conversions, ROAS. Segment by funnel stage, campaign.
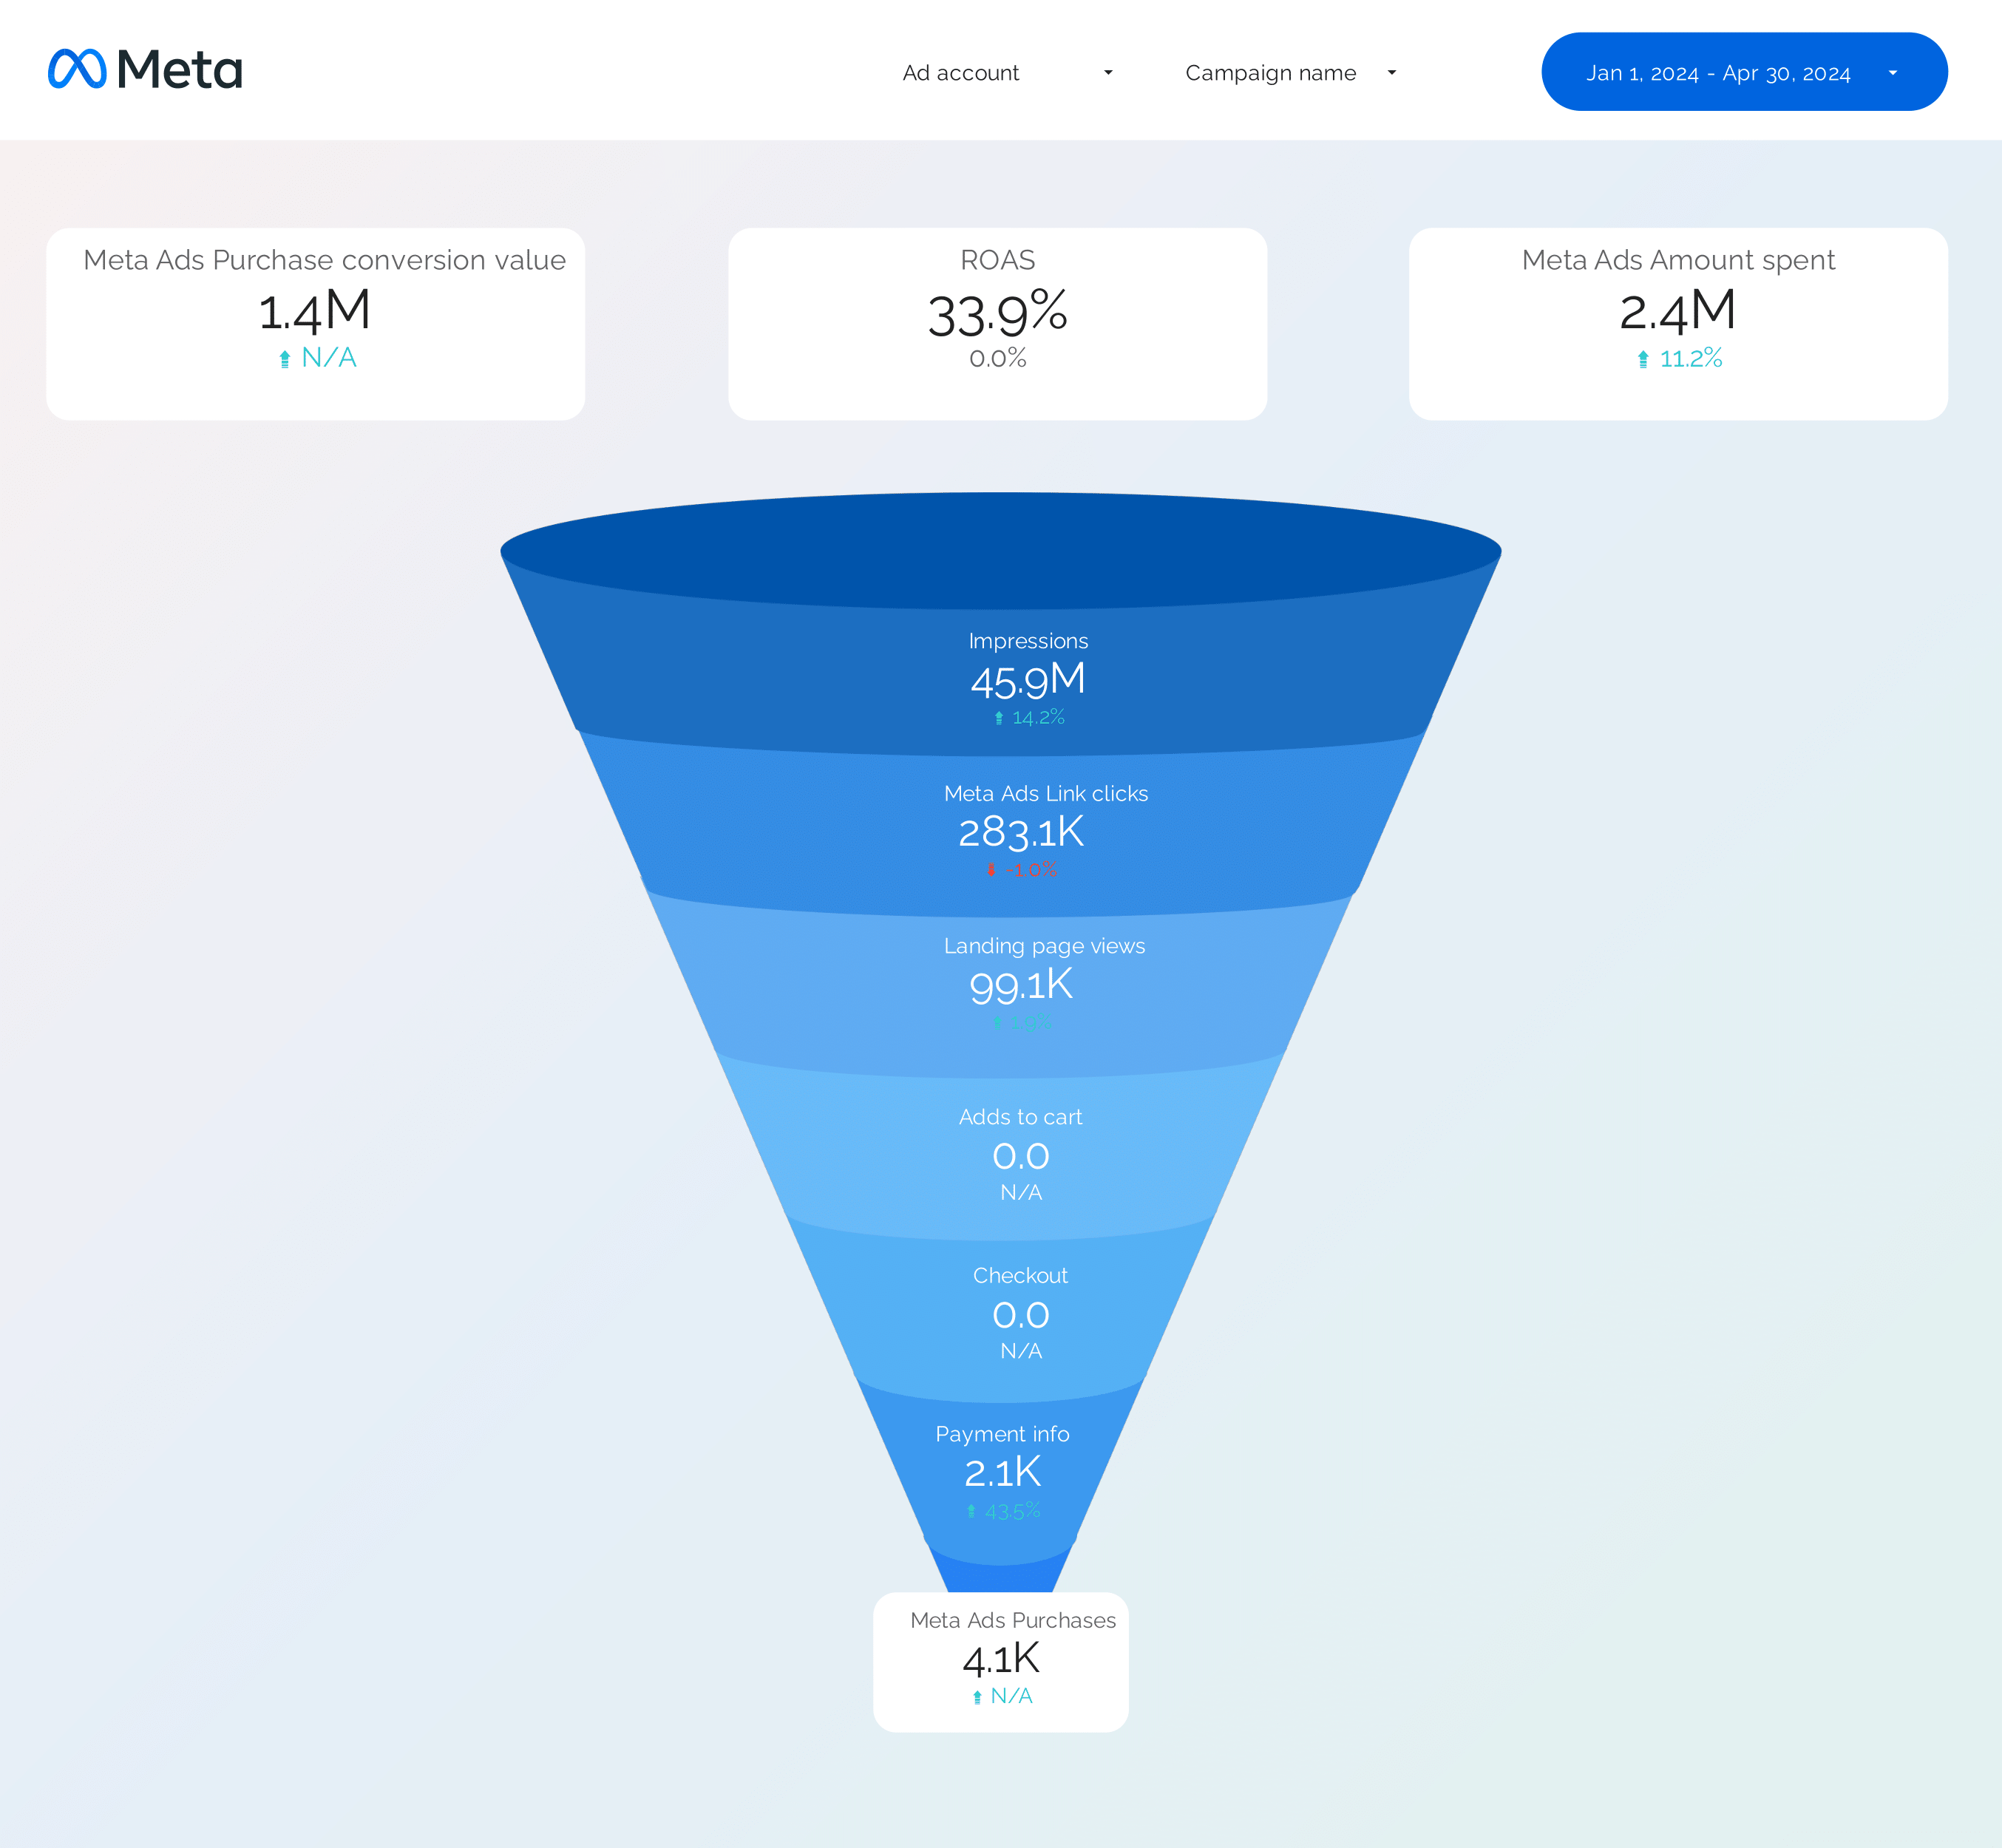
Facebook Ads Funnel Report template for Data Studio by Porter
Track awareness reach → consideration clicks → conversion ROAS by stage. Segment by funnel stage, audience.
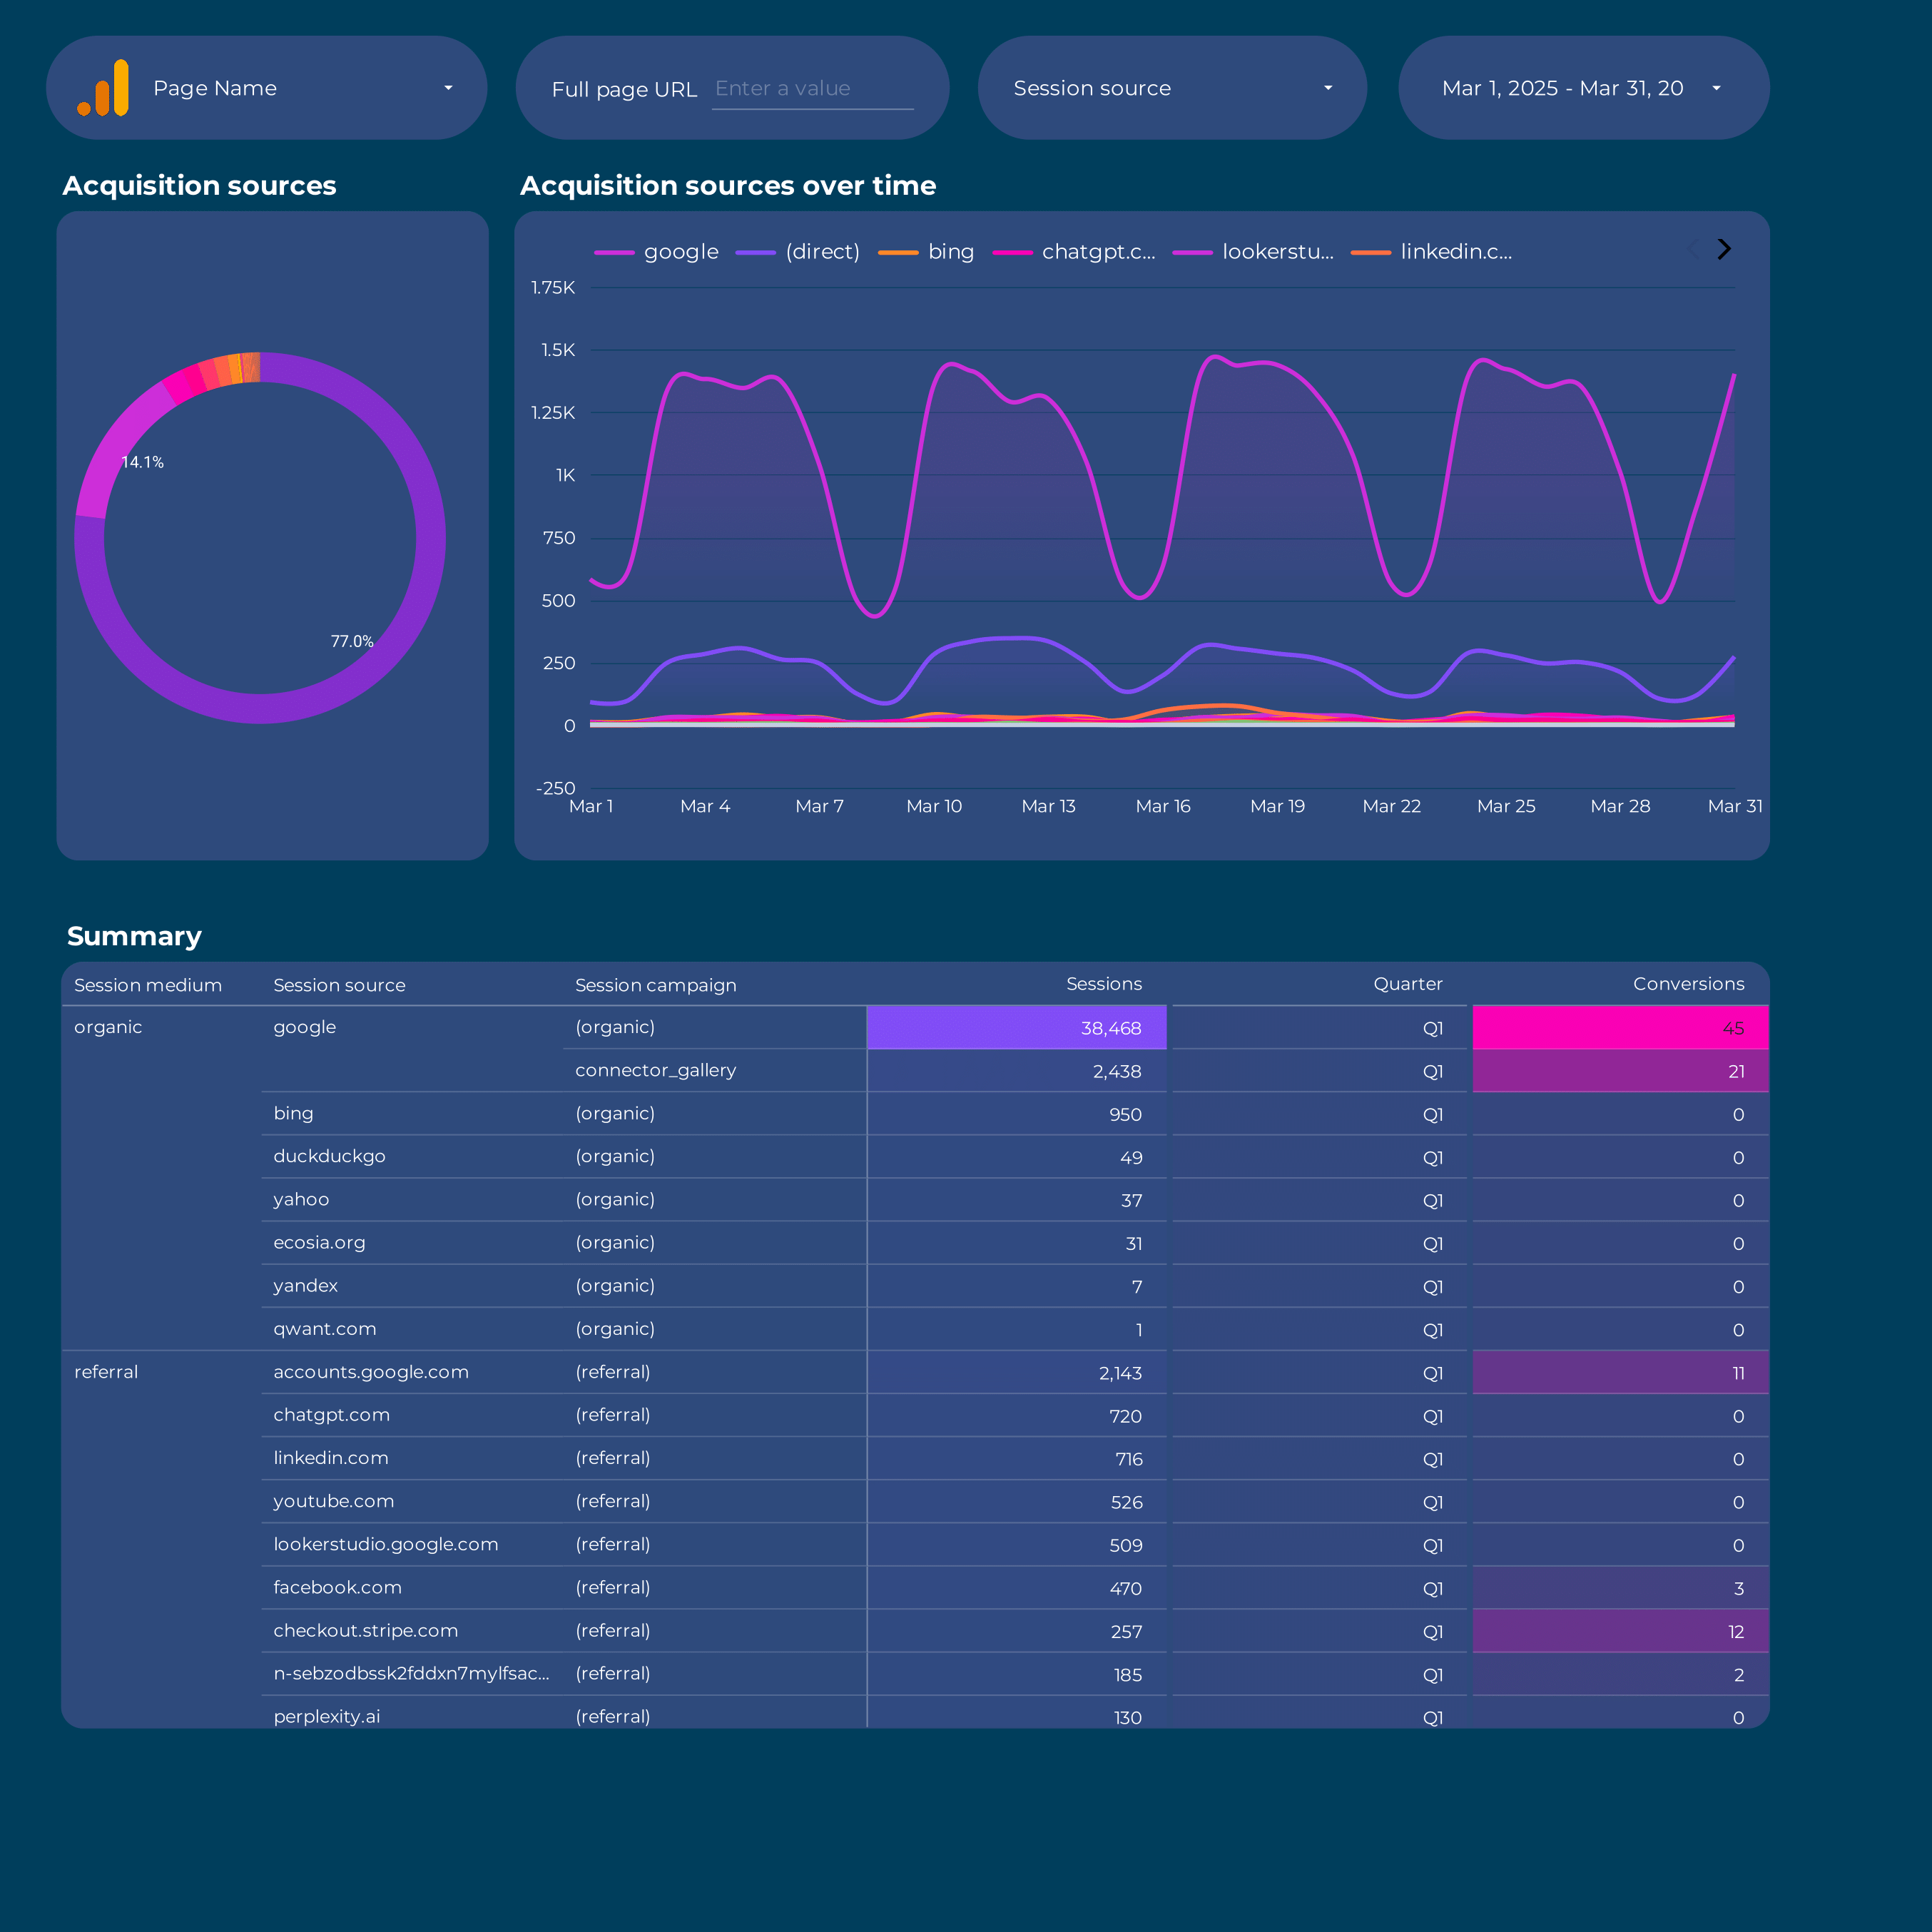
Google Analytics 4 acquisition Report template for Data Studio by Porter
Track sessions, new users by source → engagement rate, events/session → conversions by channel, revenue. Segment by source/medium, campaign, landing page.
PPC KPIs Report template for Data Studio by Porter
Track impression trends vs target → CTR vs benchmark, CPC tracking → ROAS attainment, CPA vs target. Segment by KPI, platform, campaign.
ActiveCampaign Report template for Data Studio by Porter
Track contacts, email deliverability → open rate, click rate → conversion events, deals. Segment by automation, list, campaign.
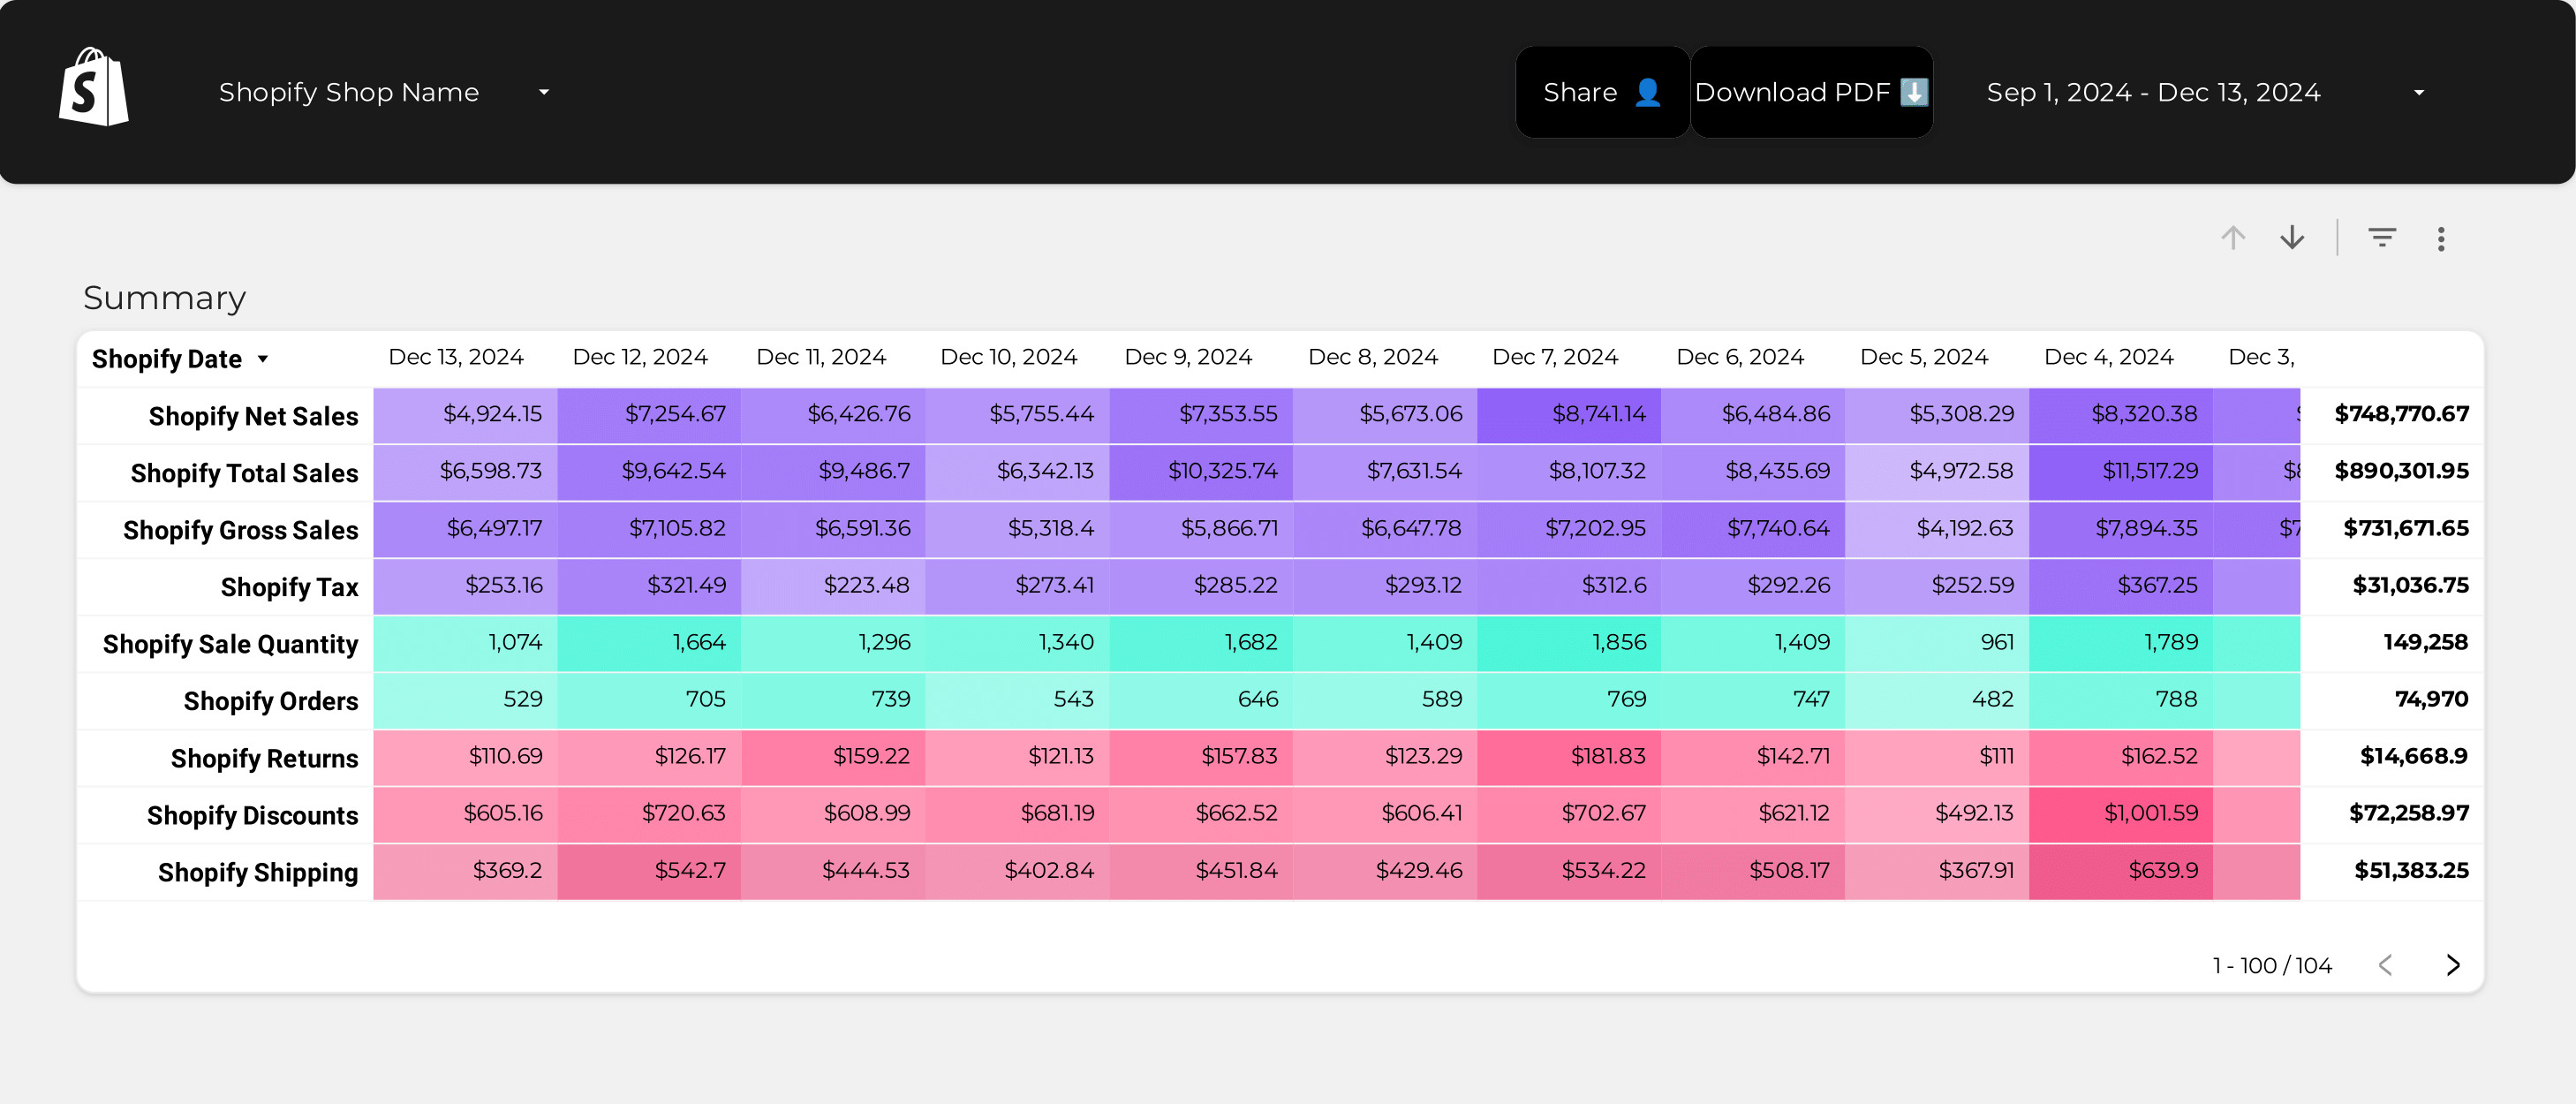
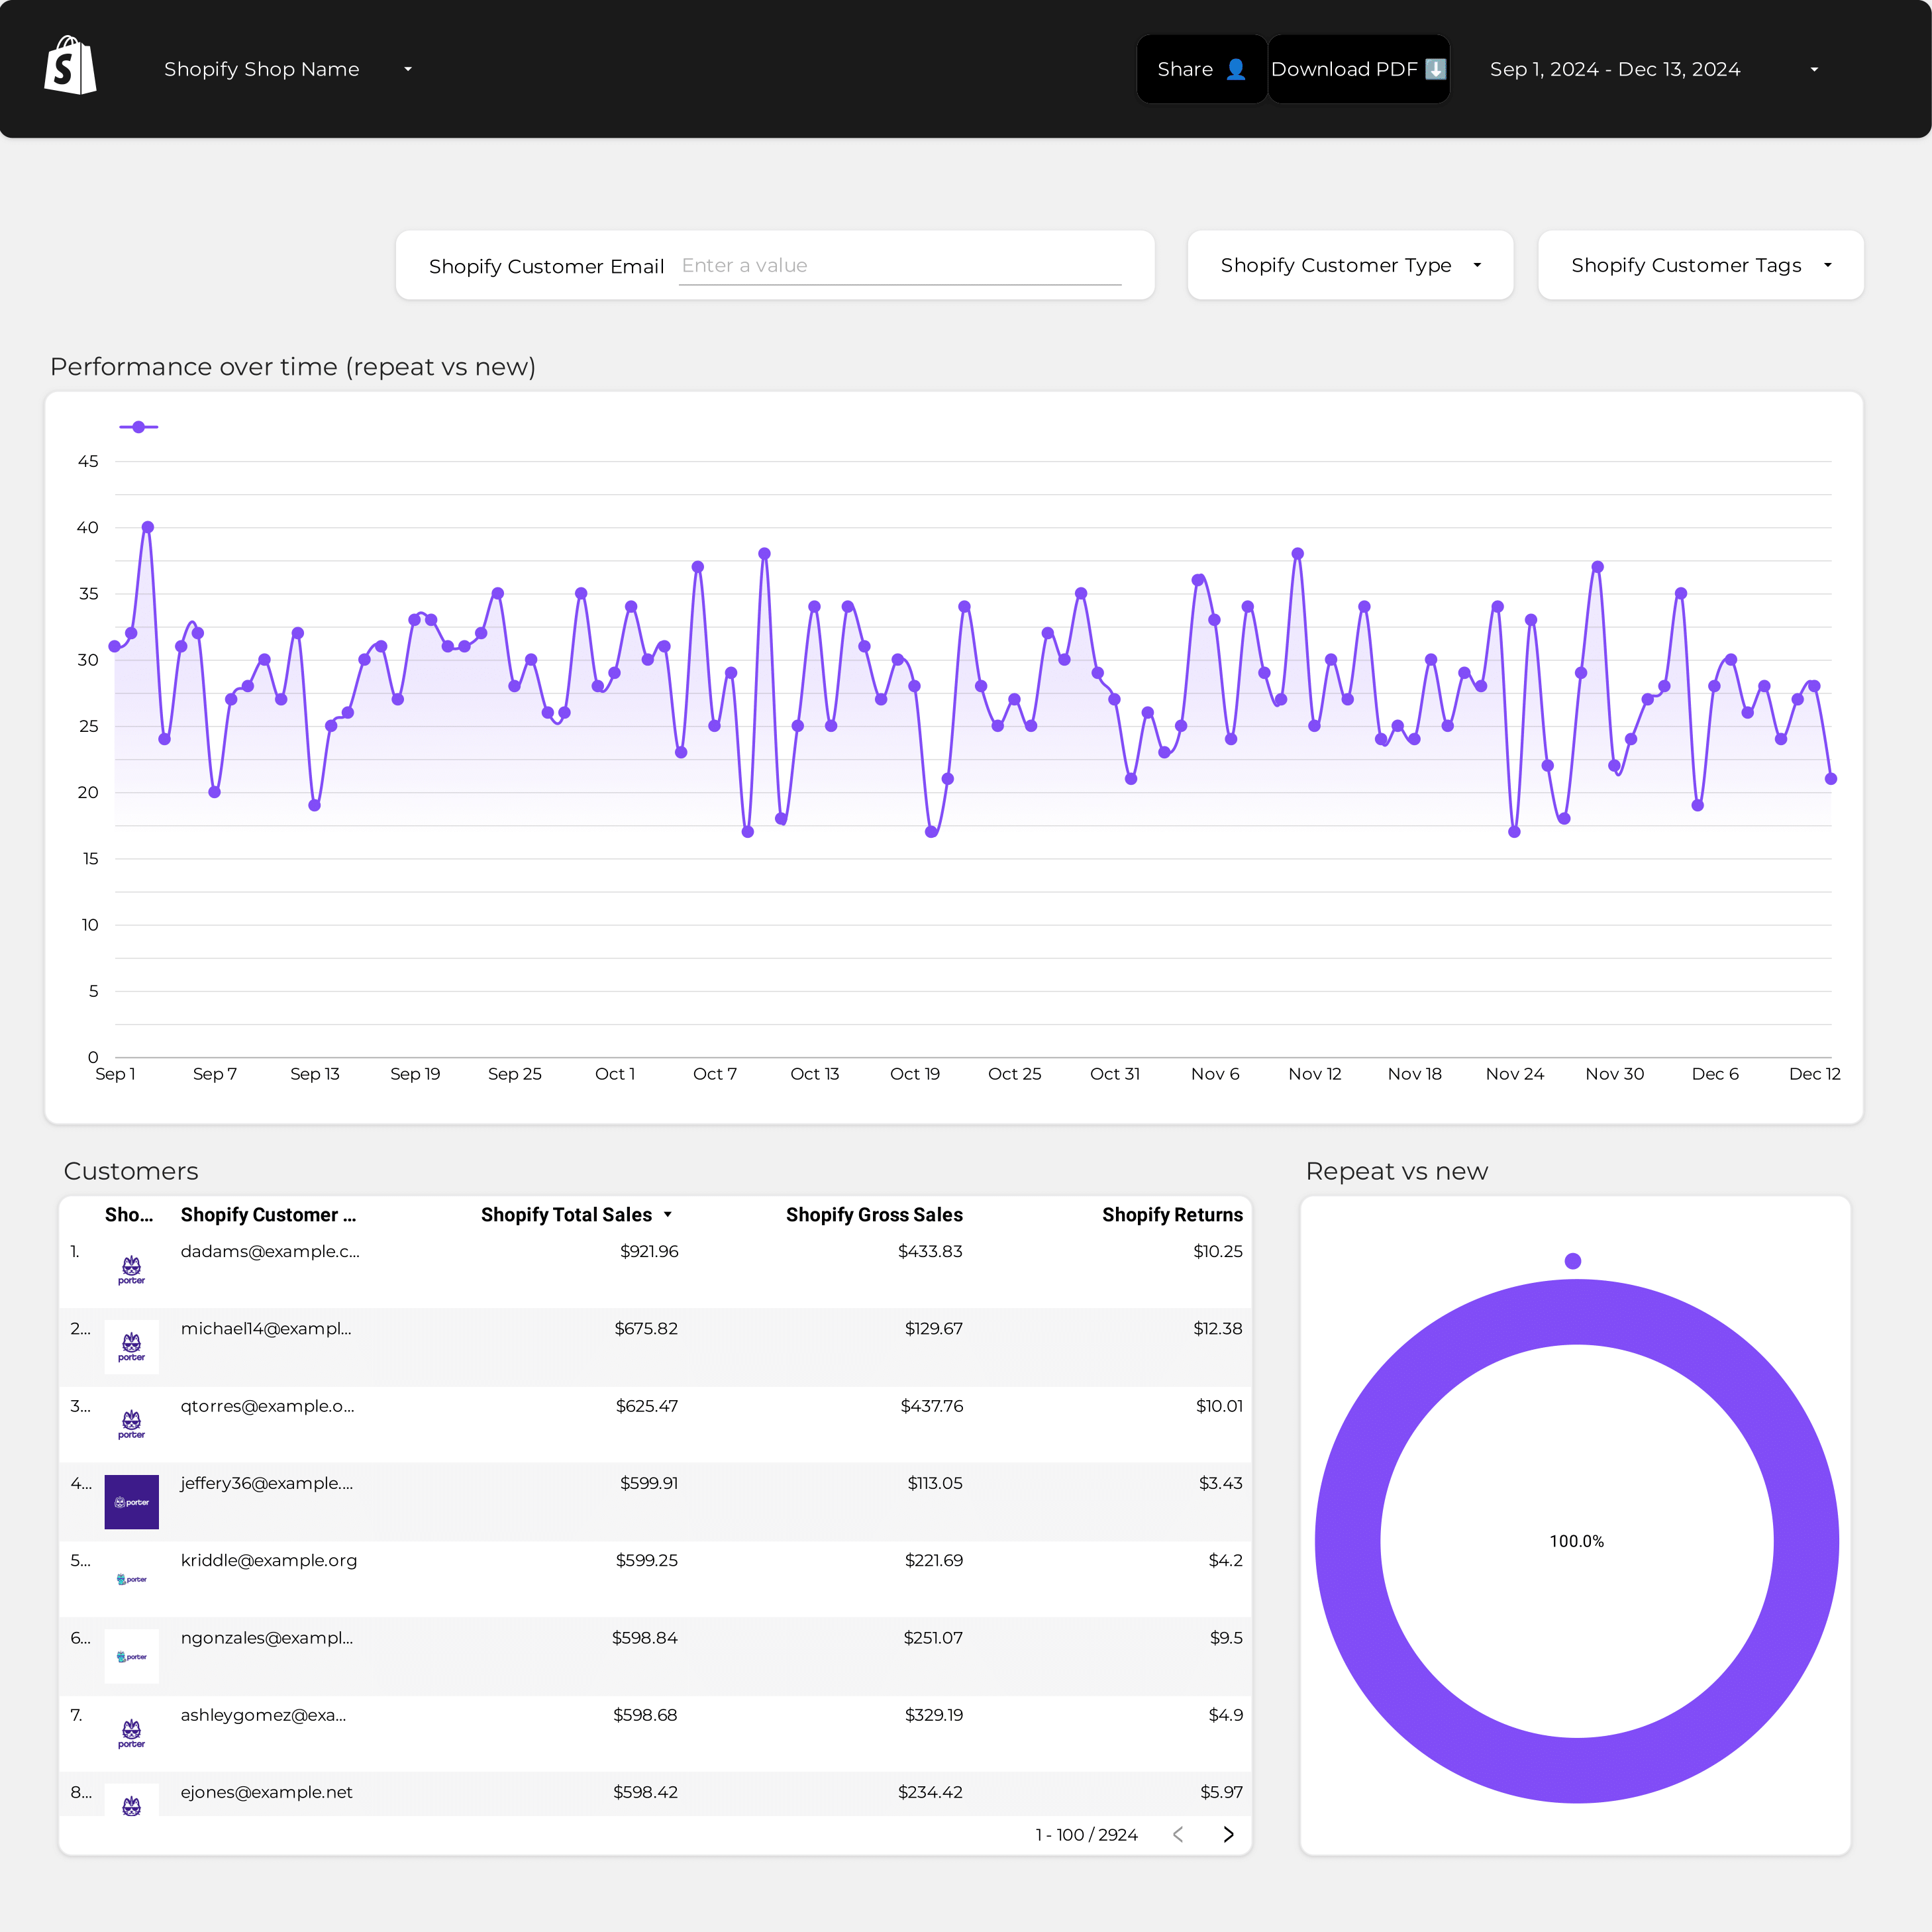
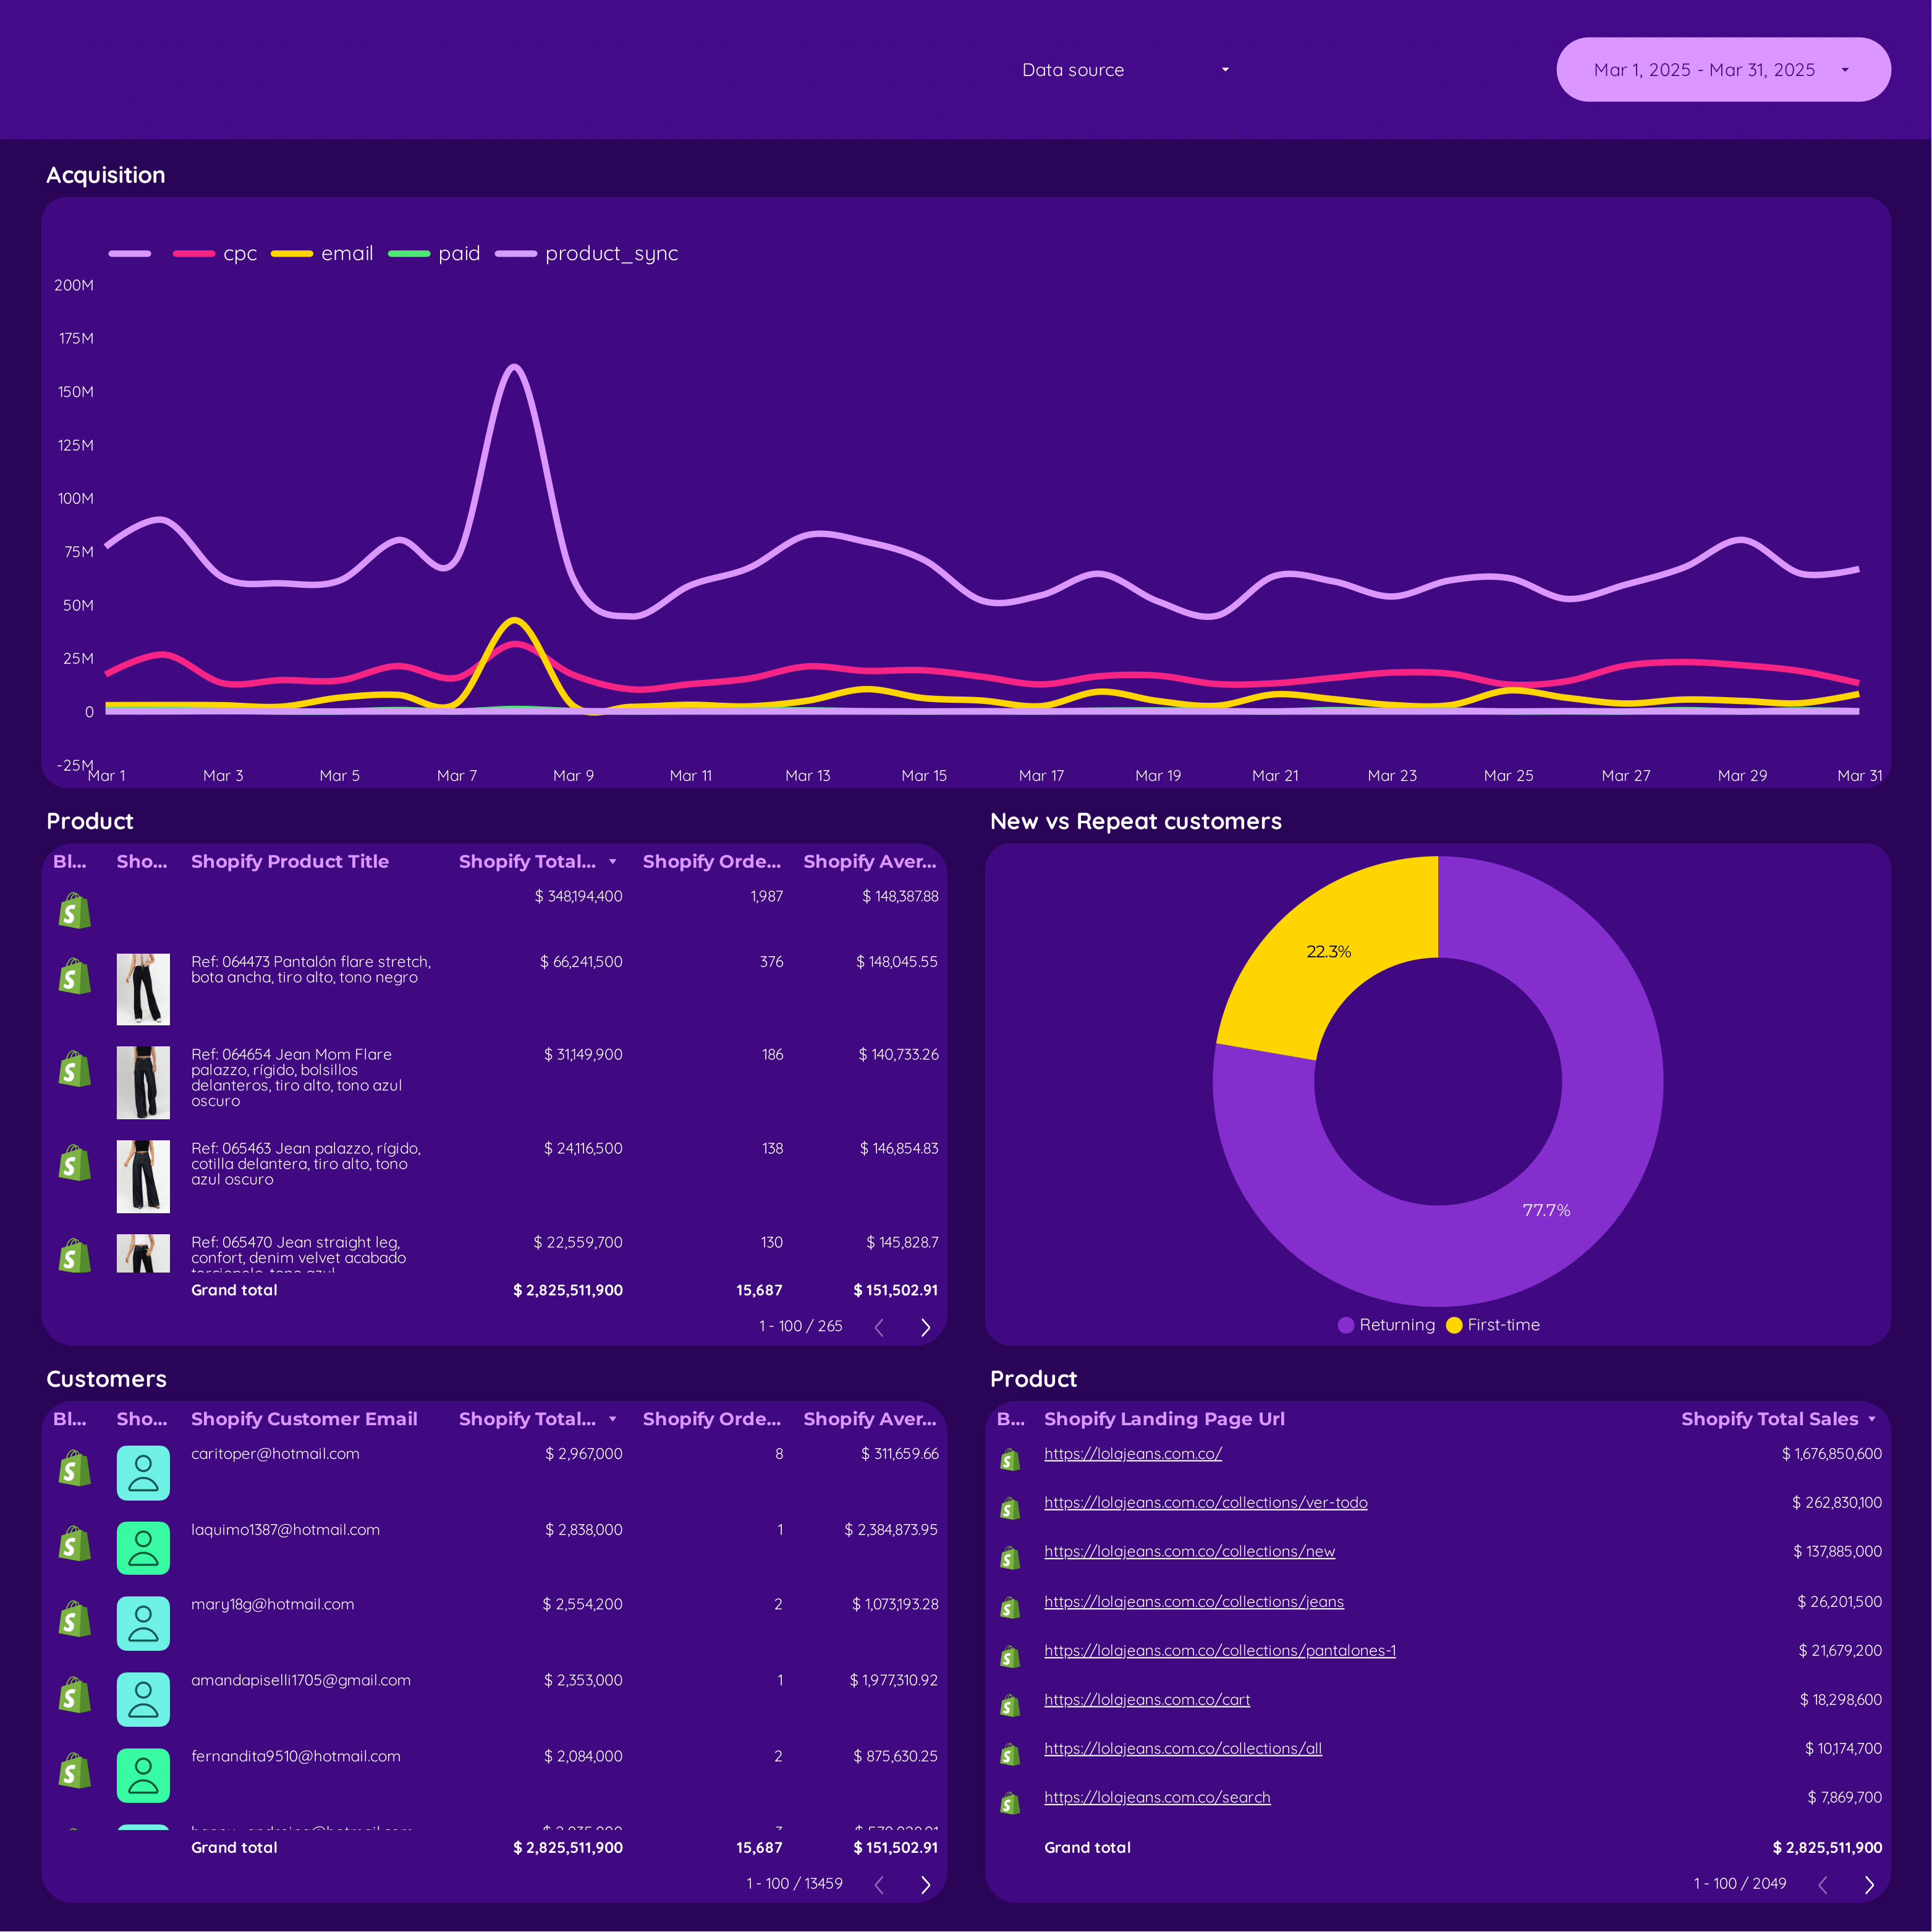
Shopify KPIs Report template for Data Studio by Porter
Track store traffic, impressions → add-to-cart rate, time on site → revenue, AOV, conversion target. Segment by product, collection.
Facebook Ads KPI tracker Report template for Data Studio by Porter
Track reach trends, impressions → CTR, CPC pacing → KPI attainment, ROAS vs target. Segment by KPI, campaign, period.

Acquisition Report template for Data Studio by Porter
Track sessions, new users by source → engagement rate, events/session → conversions by channel, revenue. Segment by source/medium, campaign, landing page.

