





Trusted by 1,600+ marketing teams and agencies


Social media report templates
Porter’s 30 social media report templates are grouped by the report you send. Filter by tool or use case and open a card for its preview and setup.
30 templates
Social media overview and client reports
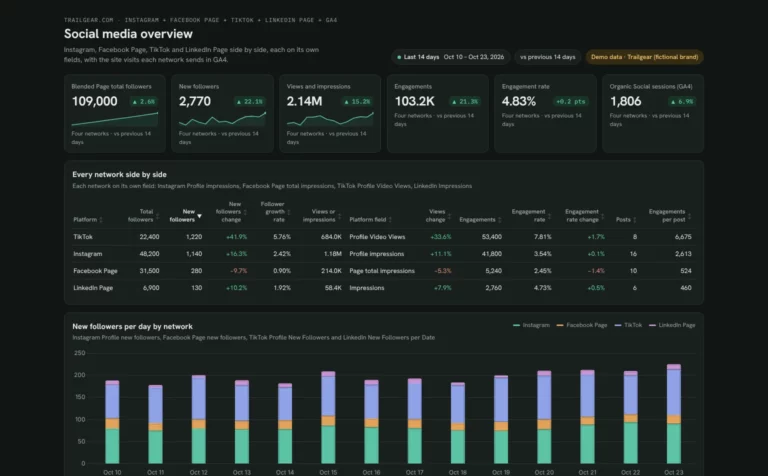
 Claude





Social media dashboard template
Compare Instagram, Facebook, TikTok and LinkedIn growth, engagement and top posts.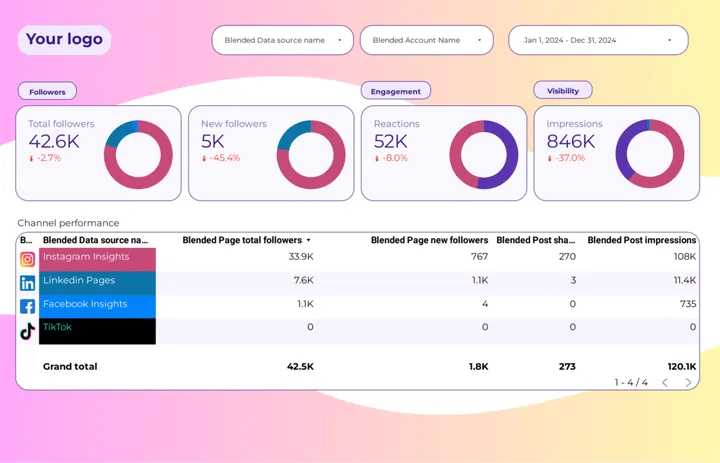
 Porter dashboard
Social media dashboard
Share one link that puts every network side by side.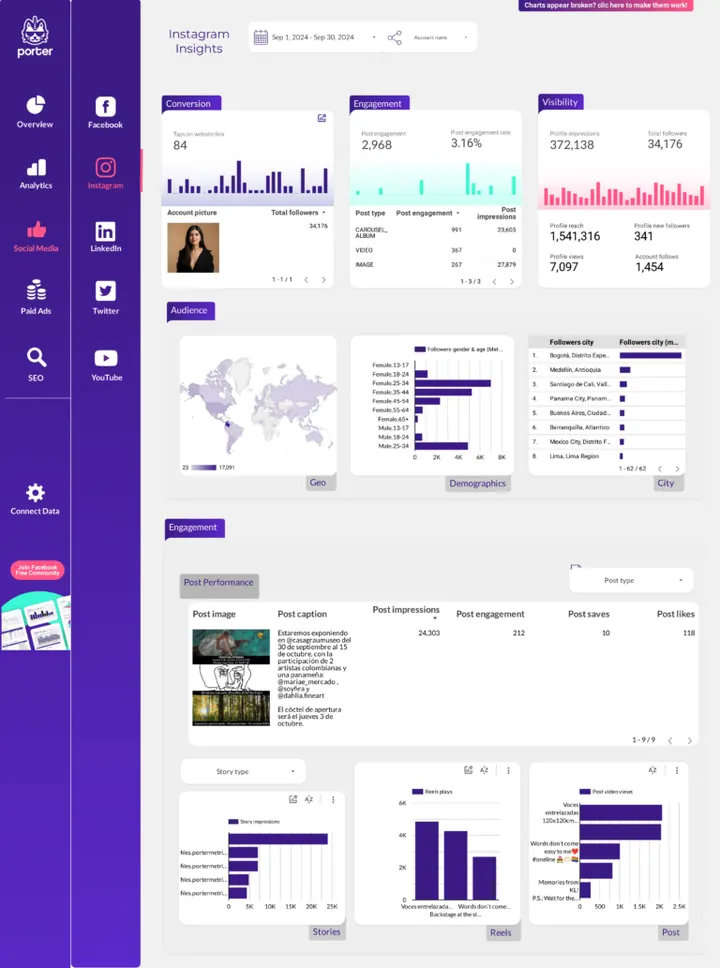 Porter dashboard
Social media client presentation
Walk a client through engagement, audience and best posts in one link. Data Studio
Social media report template
See which network grows followers and reach, in one Data Studio report.Data StudioSocial media client presentation
Present each client's engagement, audience and top content as a Data Studio report.Engagement, follower and post reports
 Porter dashboard
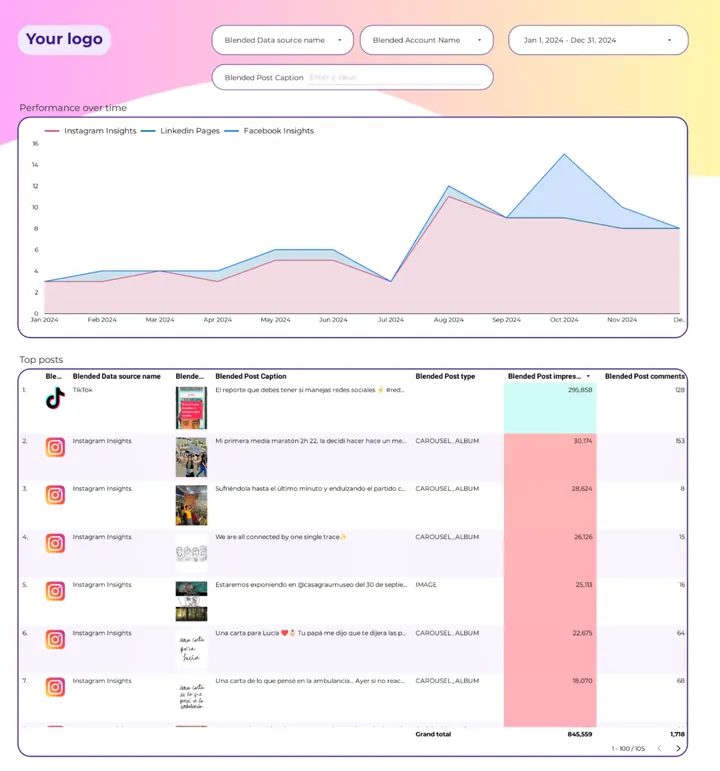
Social media engagement
See how engagement moves on each network and which posts drove each peak.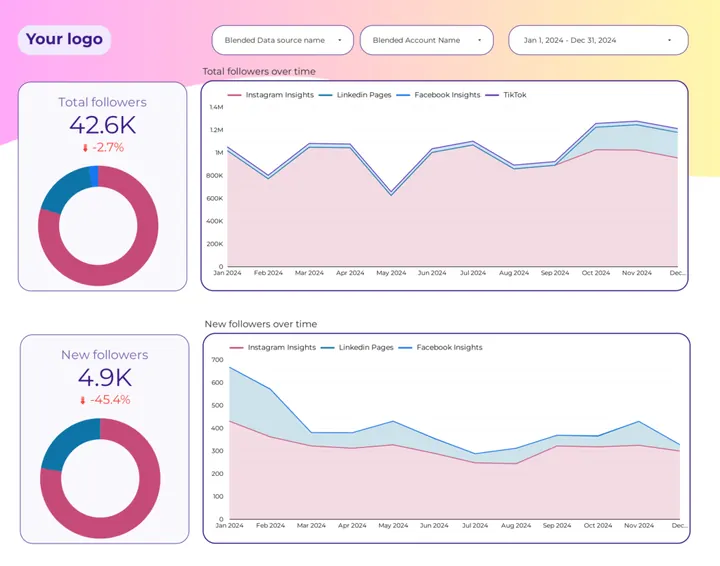 Porter dashboard
Social media followers tracking
Track follower growth on every network and spot the one that stalls.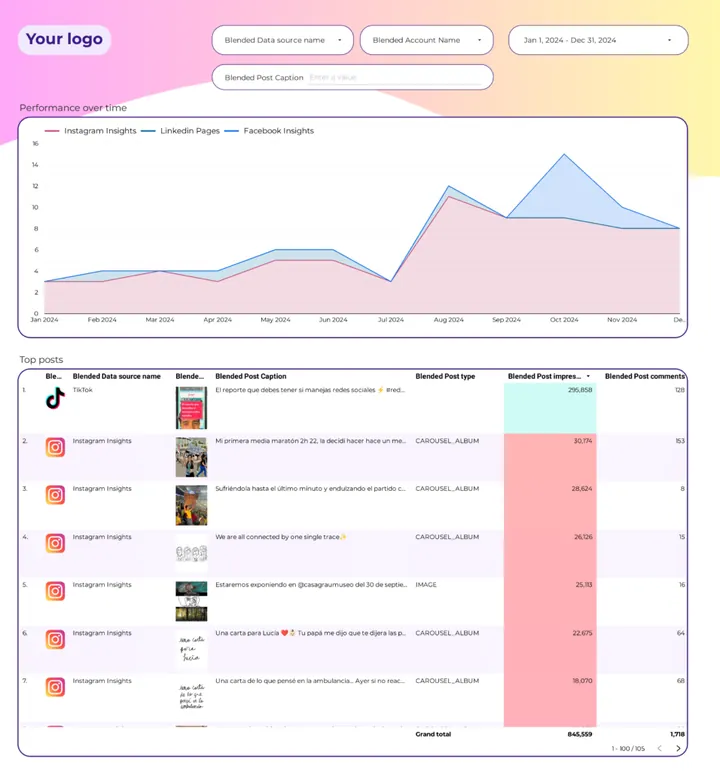 Porter dashboard
Social media post performance
Rank posts from every network by impressions to repeat what works.Data StudioSocial media engagement
Follow engagement per network over time and the posts behind it.Data StudioSocial media followers tracking
Watch total and new followers on each network, month by month.Data StudioSocial media post performance
Find the captions and post types that win across networks.Instagram reports
 Claude
Instagram dashboard template
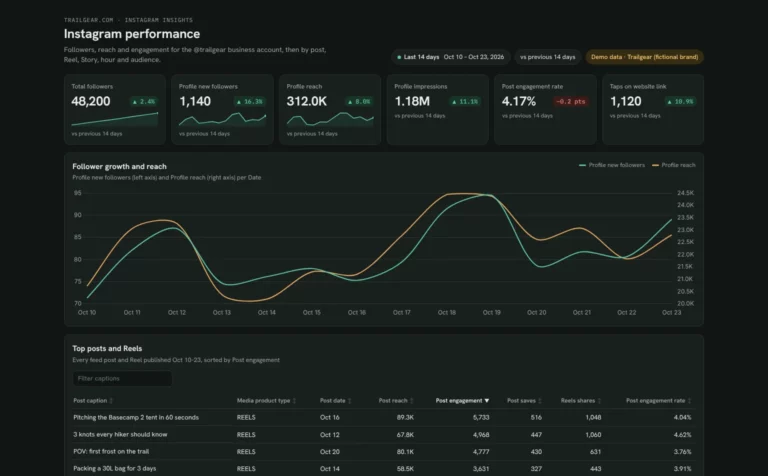
See which posts, Reels and Stories grow your account and when your followers are online.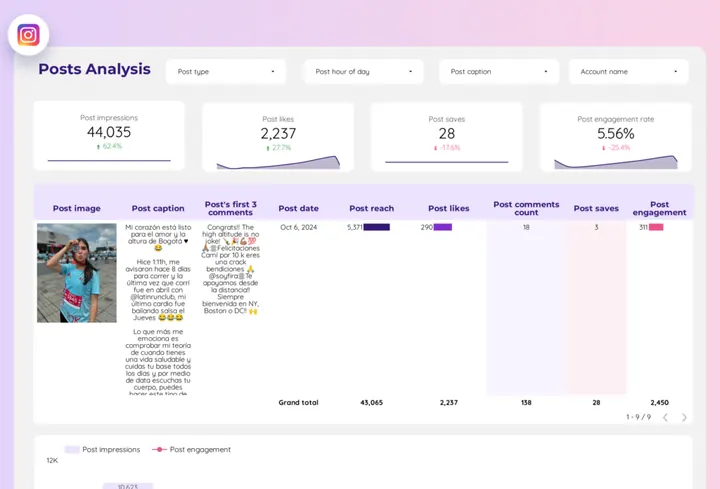 Porter dashboard
Instagram Insights dashboard
Find which Instagram posts earn reach and saves, filtered by post type and hour.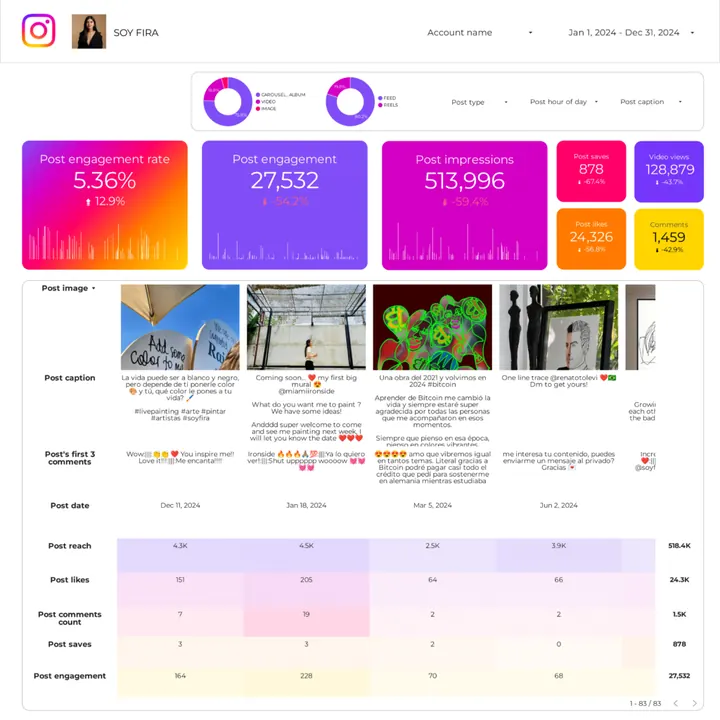 Porter dashboard
Instagram post performance
Compare Instagram posts side by side to see which captions win engagement.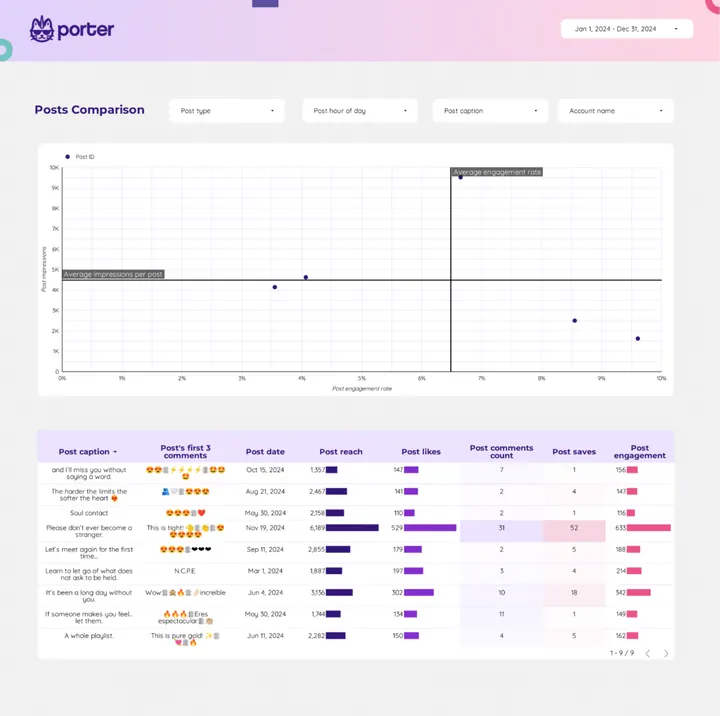 Porter dashboard
Instagram Reels dashboard
Plot each Reel against your average engagement rate to spot the outliers.Data StudioInstagram post performance
Spot Instagram posts that beat your usual reach, likes and saves.Facebook Page and LinkedIn Page reports
 Claude
Facebook Page dashboard template
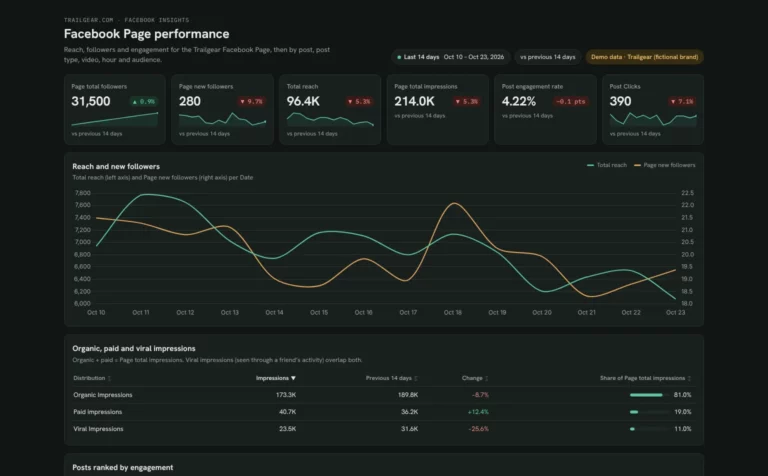
Find out why your Page reach moves and which posts and videos your followers engage with.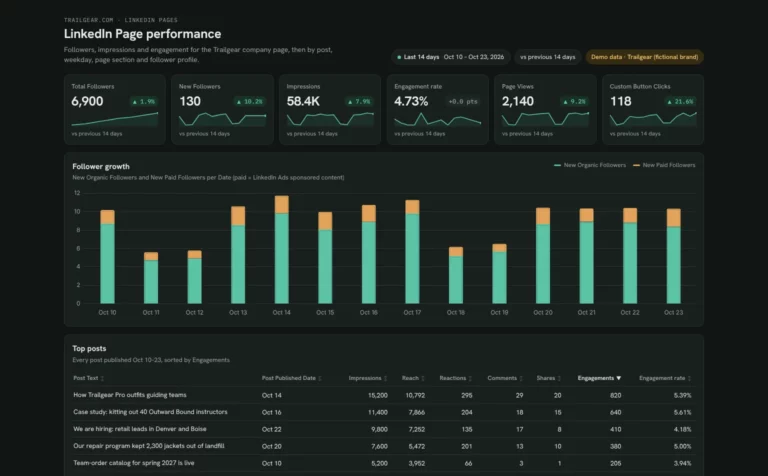 Claude
LinkedIn Page dashboard template
Track company page followers and posts, and see which job titles and industries follow you.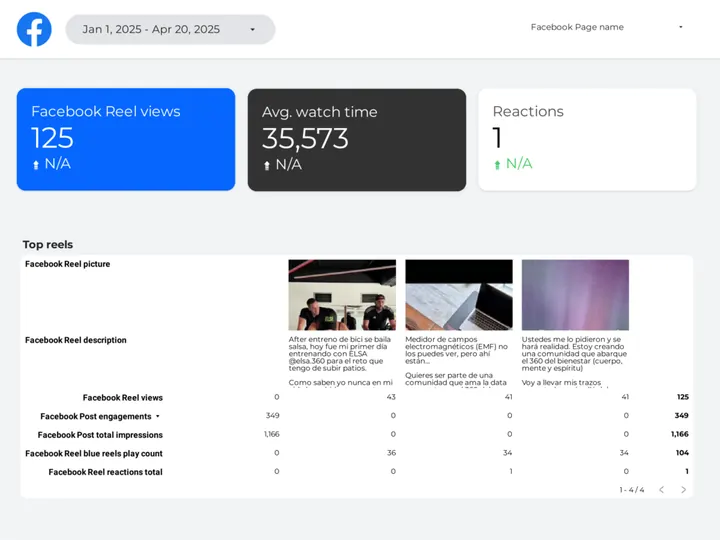 Porter dashboard
Facebook Insights dashboard
See which Facebook Reels people watch and react to, with watch time per reel.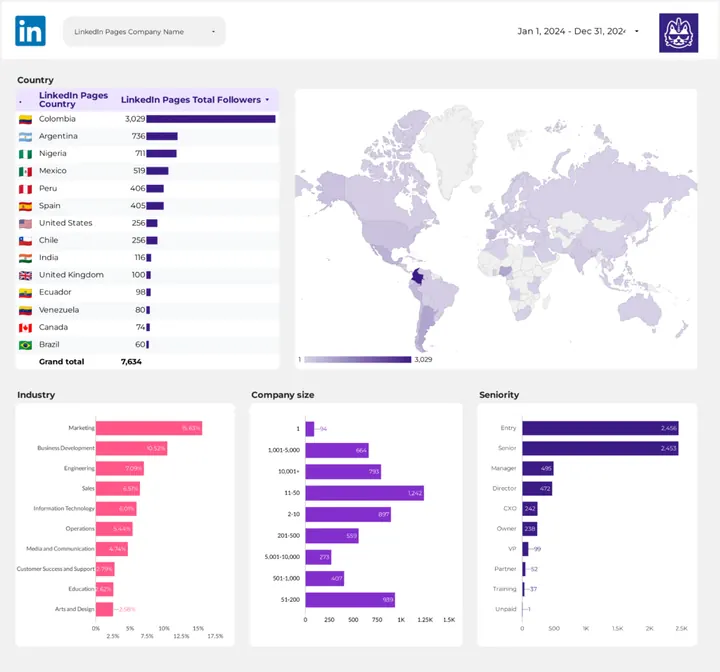 Porter dashboard
LinkedIn Pages dashboard
Learn which countries, industries and seniority levels follow your company page.Data StudioLinkedIn Pages report template
Break down your LinkedIn followers by country, industry and company size.TikTok and YouTube reports
 Claude
TikTok dashboard template
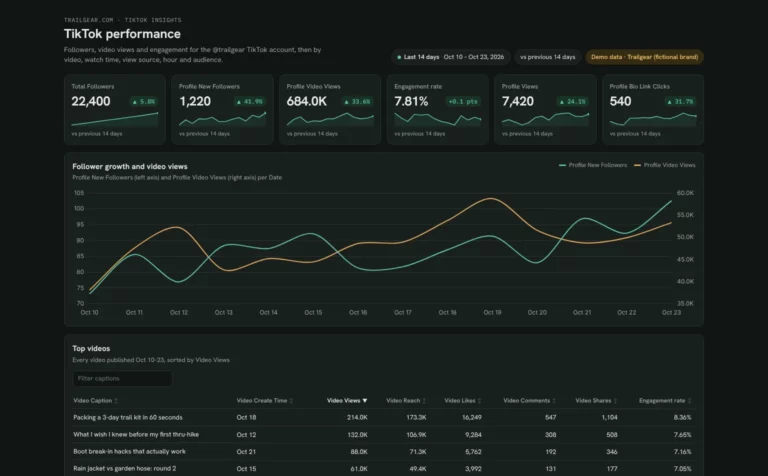
See which TikTok videos people finish and follow you for, and when your followers are online.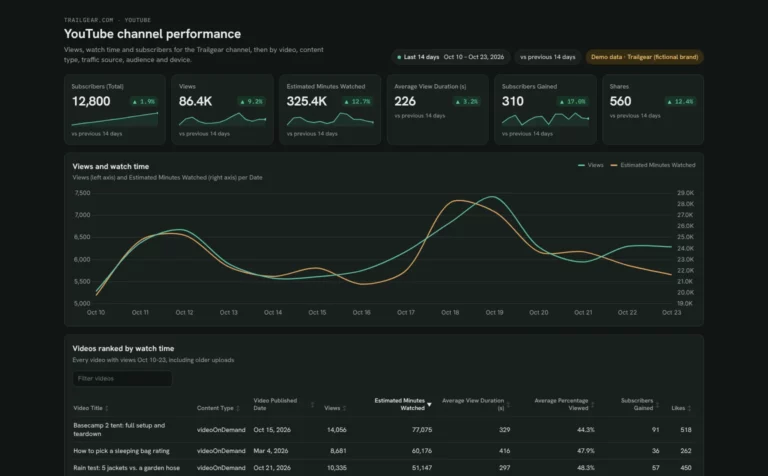 Claude

YouTube dashboard template
See which videos keep people watching and how Shorts compare to long videos.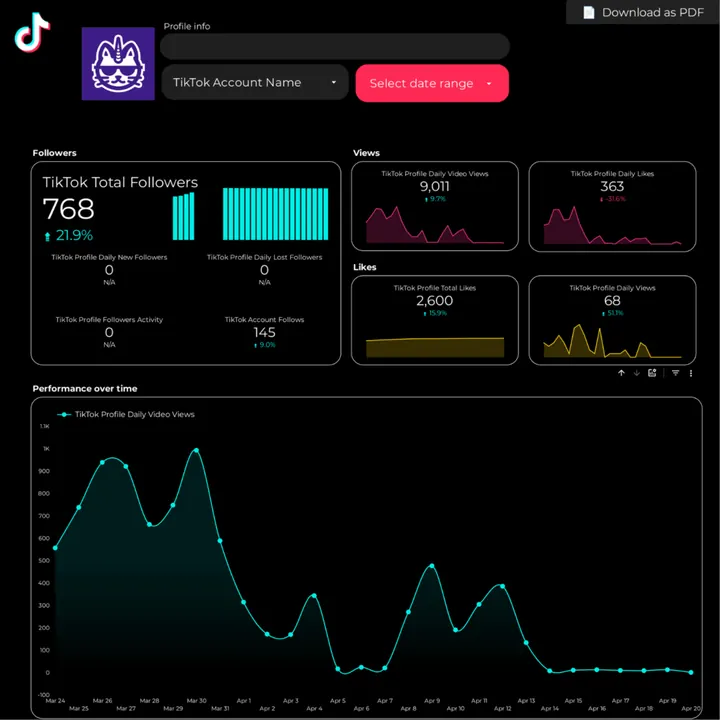 Porter dashboard
TikTok dashboard
Track daily TikTok views, likes and new followers for each account.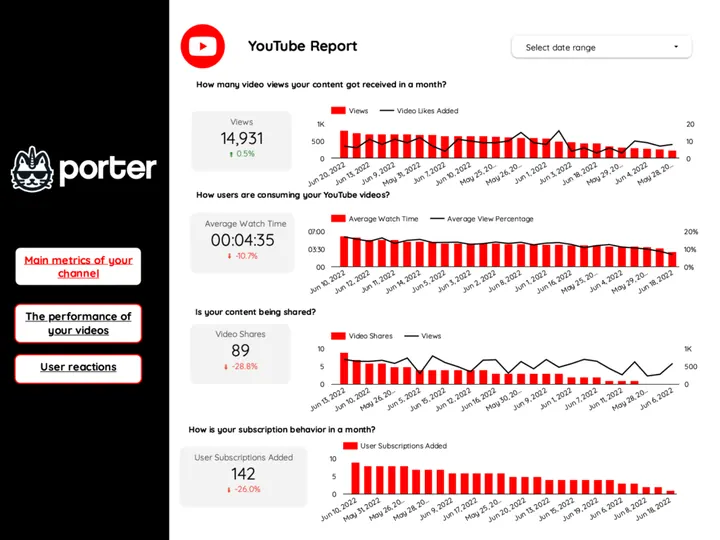 Porter dashboard
YouTube dashboard
Check whether views, watch time and subscribers grow month over month.Data StudioTikTok report template
Follow TikTok views and likes next to follower growth.Data StudioYouTube report template
See your channel's monthly views, shares and new subscriptions.Competitor and influencer reports
 Claude
Influencer dashboard template
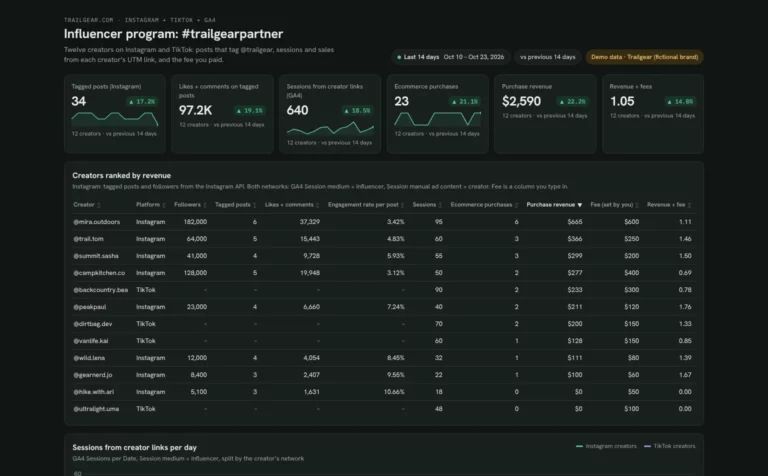
See which creators bring sessions and sales, and what each returns on their fee.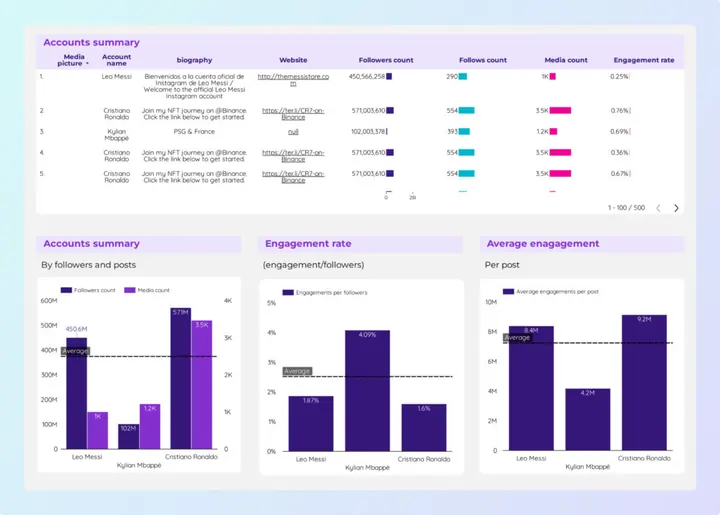 Porter dashboard
Social media competitors dashboard
Benchmark your followers and engagement rate against rival Instagram accounts.Data StudioSocial media competitors report template
Compare competitor accounts by followers, posts and engagement.Social media report example
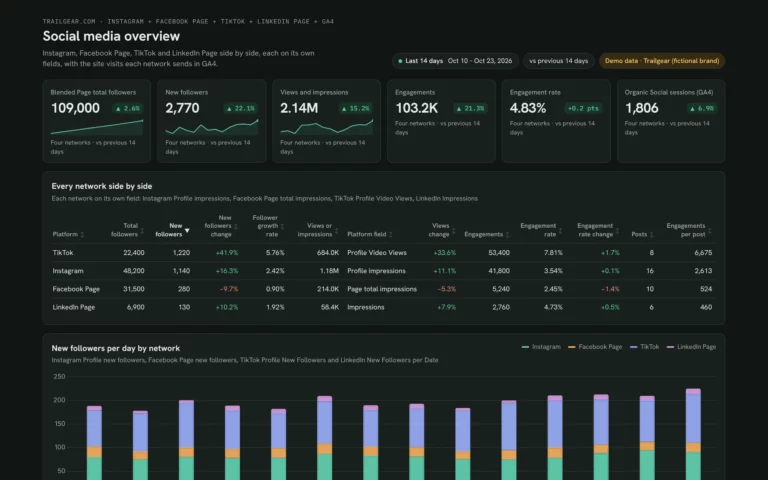
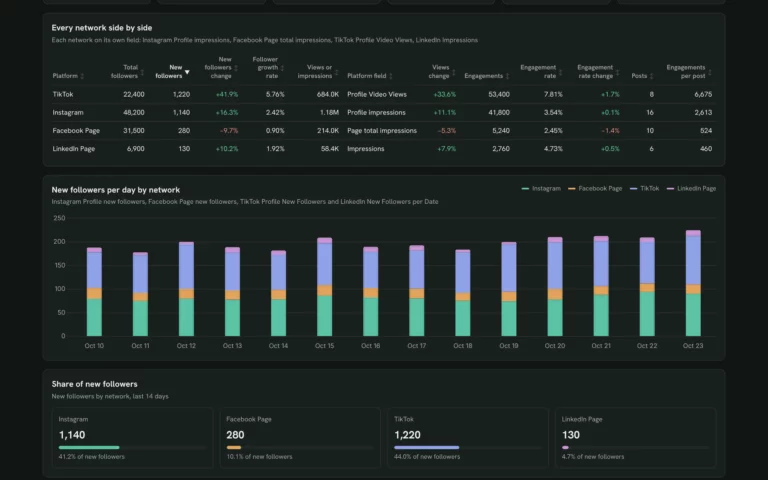
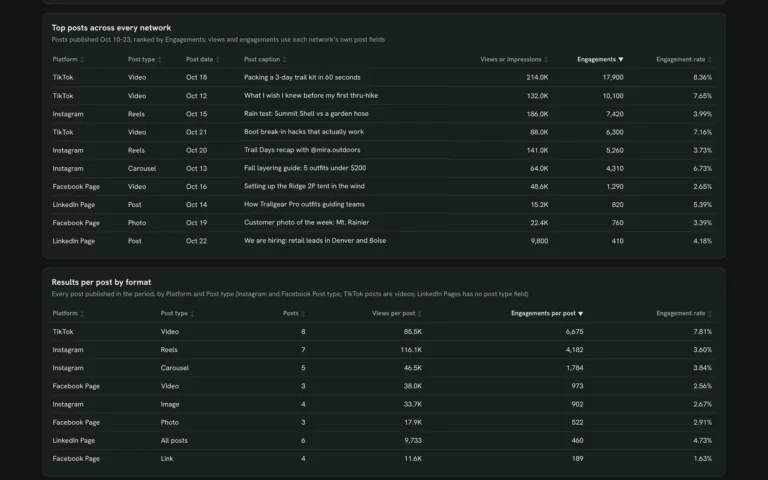
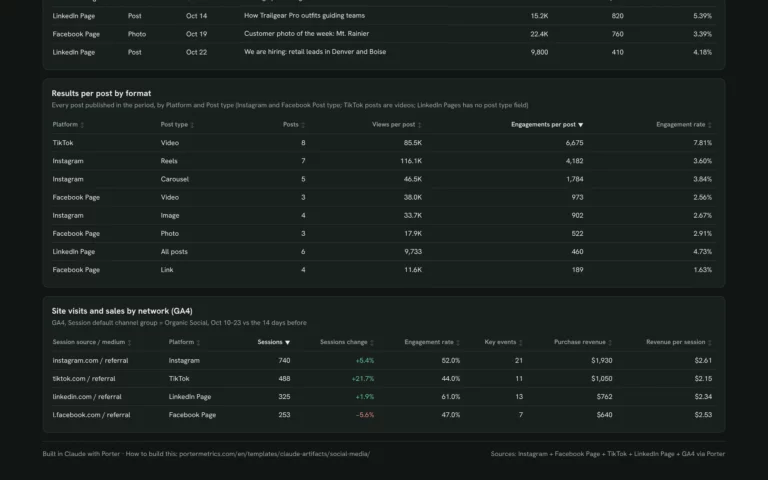
Porter’s social media report example is the Claude social media dashboard on Trailgear demo data. Click through its four views first.
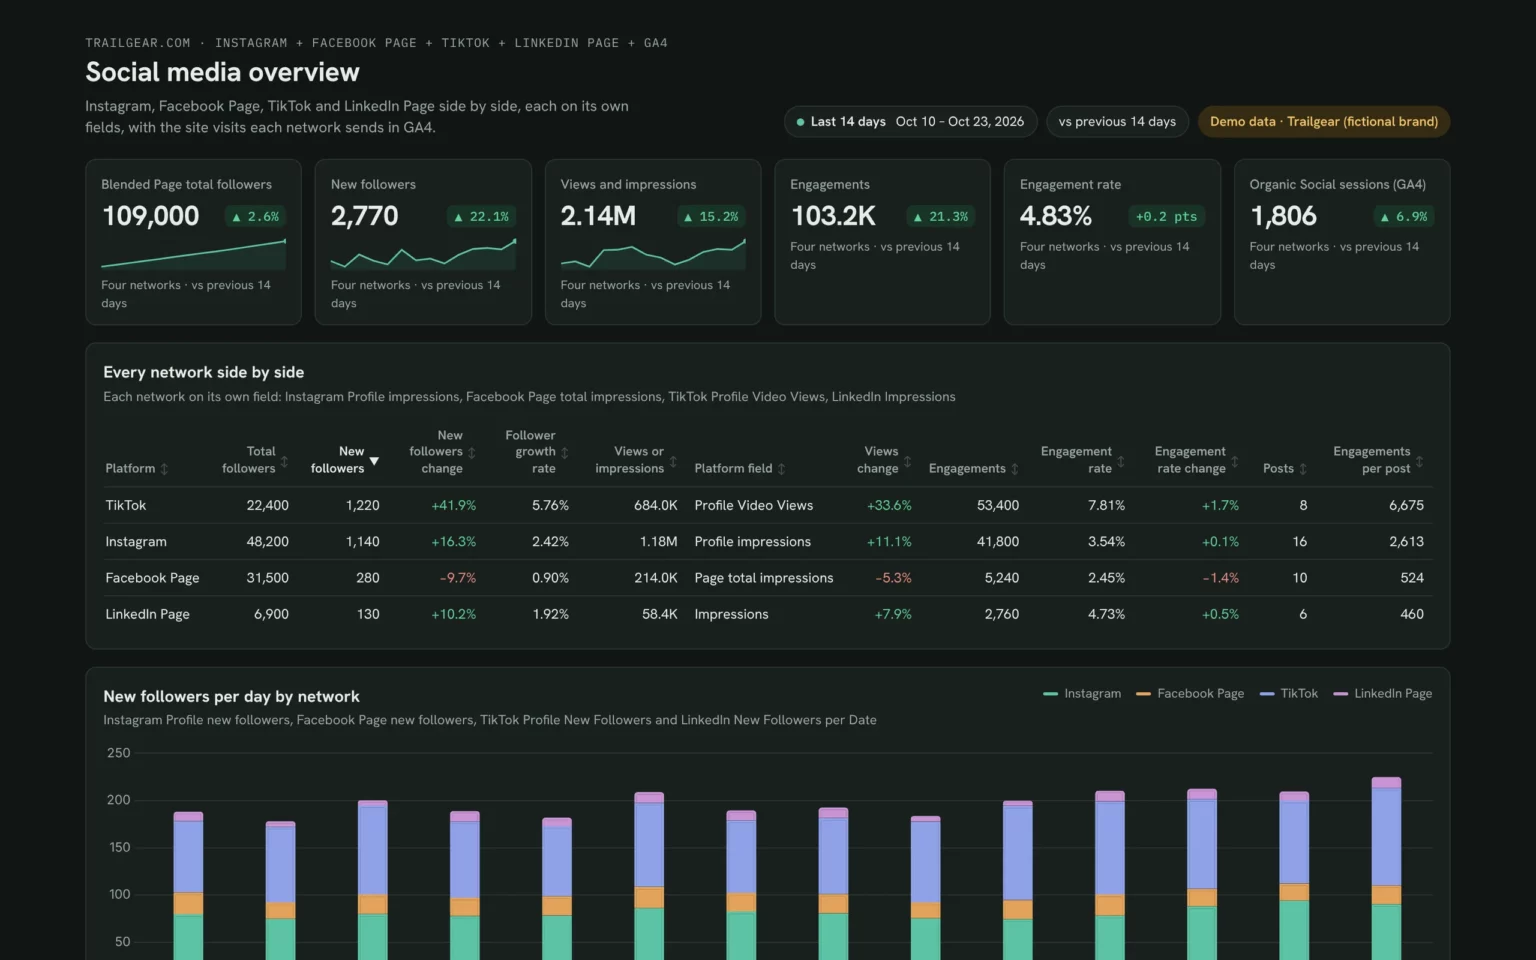
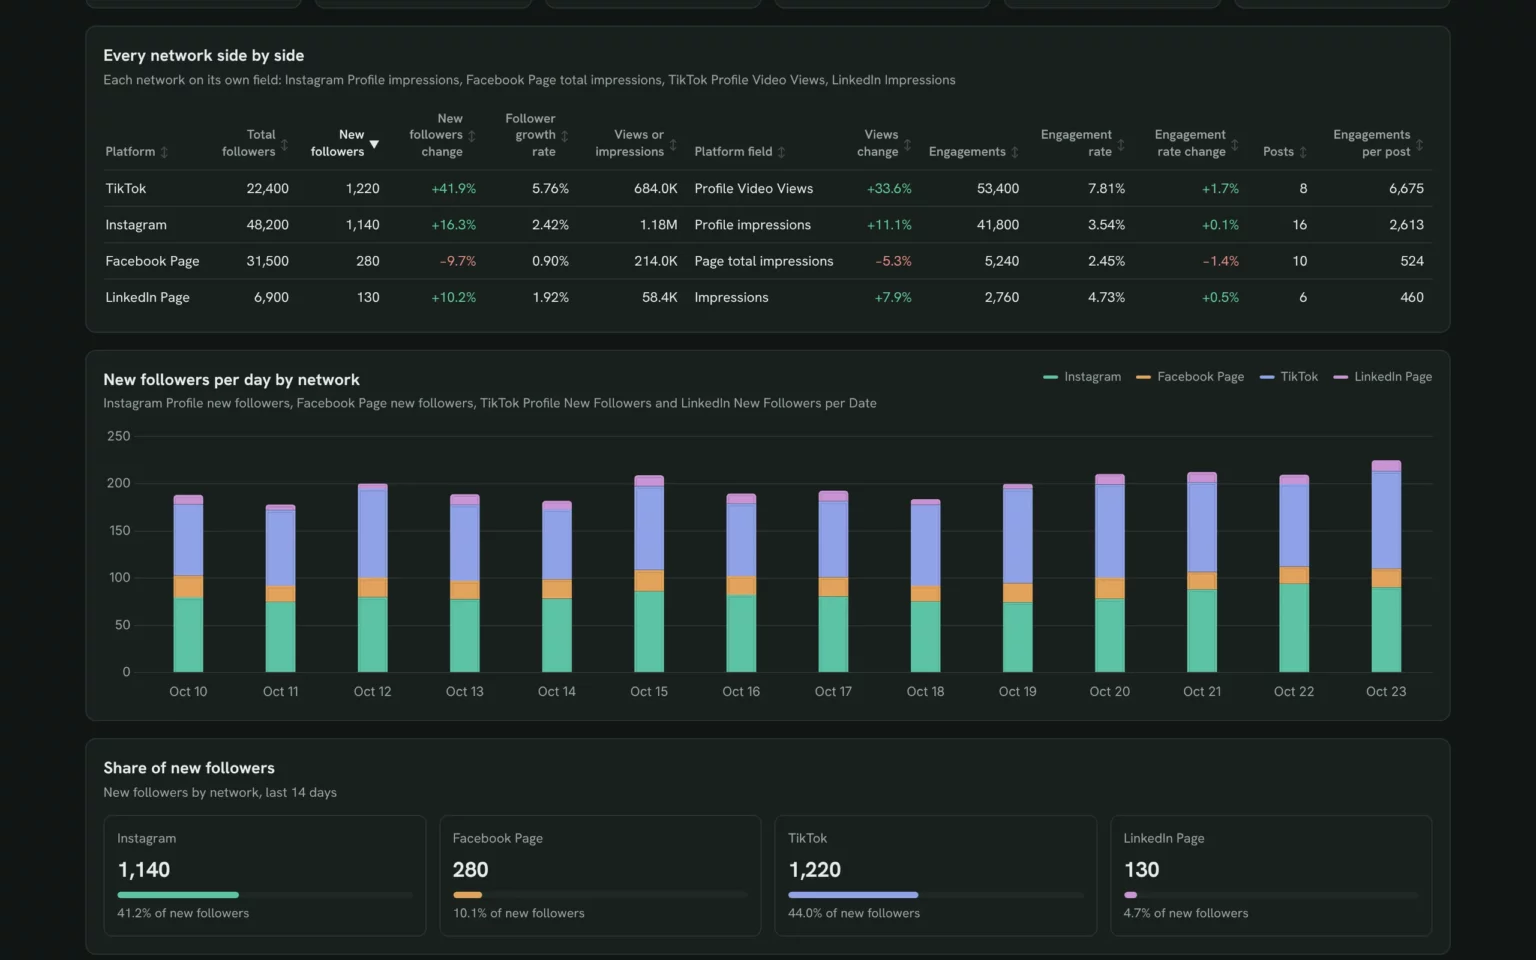
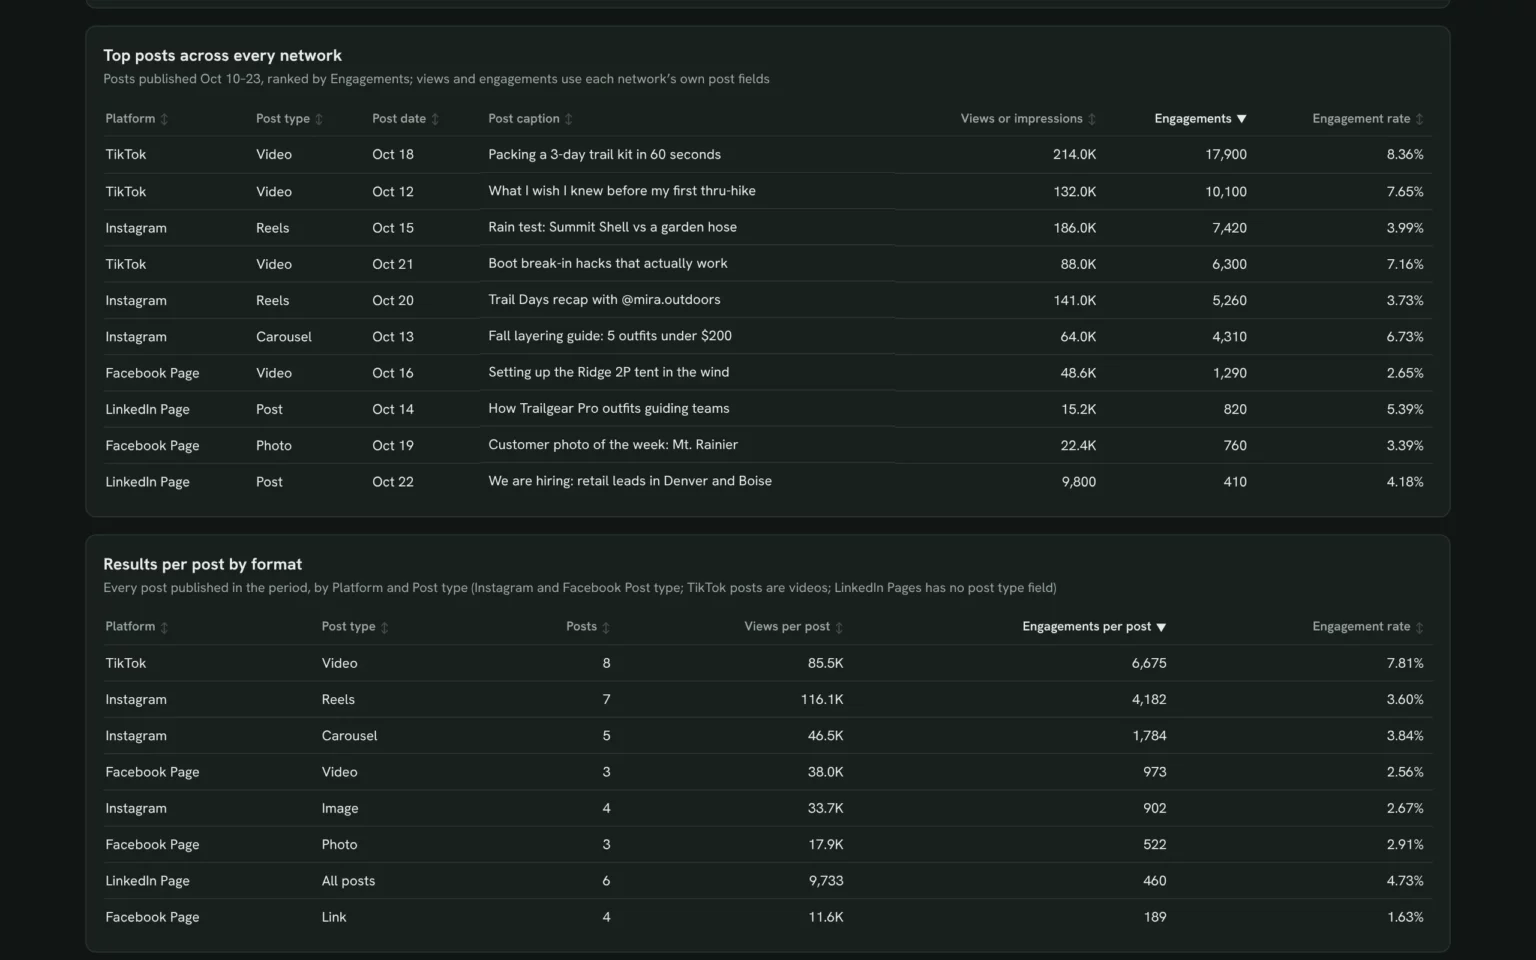
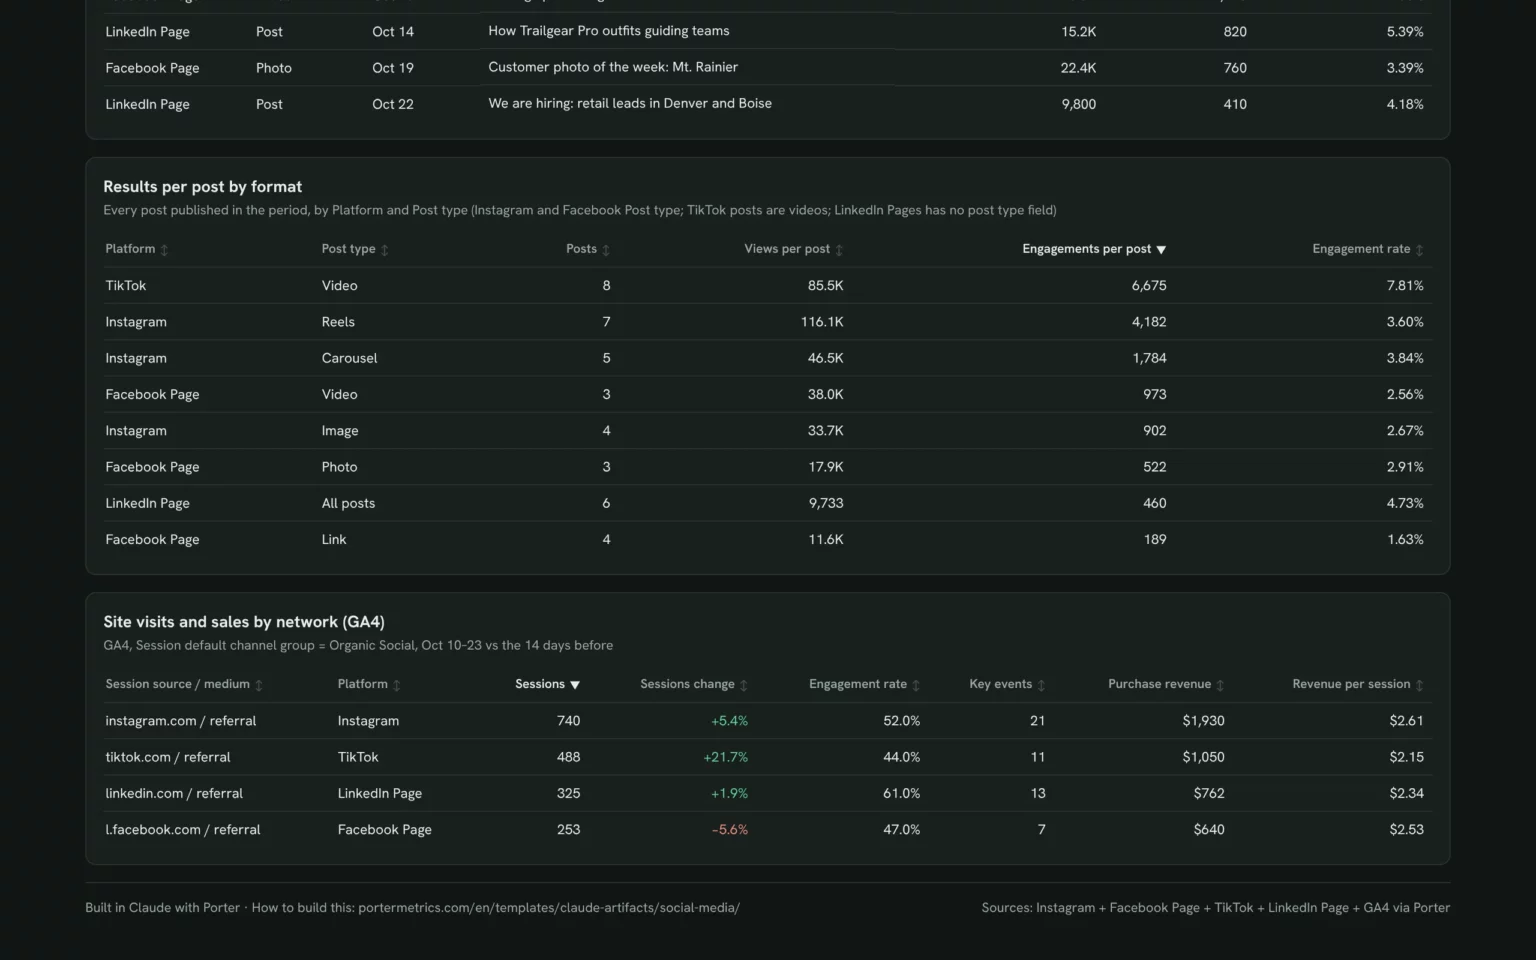
What to include in a social media report
A social media report built on Porter’s templates has six parts, in the order a client reads them, each covered by a template.
Growth and reach by network
Followers and views or impressions per network, each on its own fields (Instagram fields): social media dashboard and followers tracking templates.
Top posts and formats
The posts and post types that earned the most: Instagram dashboard and post performance templates.
Site visits and sales
Sessions and Key events from Organic Social in GA4: influencer dashboard template.
Next steps
Two or three actions for next month, each tied to a network.
Paid social has its own templates; these reports read organic accounts only.
How to set up a social media report template
Every Porter social media report template starts with one free step: connect your social accounts in Porter. Then set it up in your reporting tool.
On Porter’s Free plan, Claude reads the last 15 days and Data Studio up to 30 days. The 14-day trial has full access and needs no card (Porter pricing).
In Claude
Sign up free at Porter, sign in with Facebook to add Instagram and your Facebook Page, then add TikTok and LinkedIn Pages. Add Google Analytics 4 for site visits.
In Claude, go to Customize → Connectors → Add custom connector, paste
https://mcp.portermetrics.com/mcpand name it Porter Metrics. Click Continue, sign in to Porter and allow access.Open a new chat, paste the install prompt and put your brand in place of the one in brackets (Instagram to Claude tutorial). Claude reads your accounts through Porter’s MCP (Model Context Protocol), an open standard that lets Claude read data from other tools.
Duplicate this Claude dashboard template and keep its layout, views and styling: https://claude.ai/artifact/B8X4we9mpF95GJj8HFPcYb
Then rebuild it with my own data through Porter: a social media report for [brand] for the last 14 days across Instagram, Facebook Page, TikTok and LinkedIn Page, each on its own fields: followers, new followers, views or impressions, engagements and engagement rate, new followers per day, the top 10 posts across every network, and GA4 Organic Social sessions and key events by source.
Claude Dashboards is in beta on Pro, Max, Team and Enterprise (Anthropic’s guide to Claude Dashboards).
As a Porter dashboard
Open a Porter dashboard card and click Download template.
Sign in to Porter and pick the Instagram, Facebook, TikTok, LinkedIn or YouTube accounts.
Share it with viewer or editor access; viewers don’t need Claude.
In Data Studio
Open a Data Studio card and click Download template.
Click the three-dot menu (⋮) in the top-right corner and select Make a copy.
Choose your Porter data sources and click Copy Report.
What makes these social media report templates different
A slide template needs new screenshots every month. Porter’s social media report templates read your accounts directly, in the tool you report in.
See a live example before you sign up
Click through the Claude social media dashboard without an account, then decide.
Compare networks without mixing their numbers
Instagram impressions and TikTok video views stay on their own fields, so one network never hides another.
Weigh likes against site visits and sales
GA4 Organic Social sessions and key events sit next to your posts, so you see which network sends buyers.
A client link that updates itself
Send one Porter link instead of monthly screenshots; each refresh pulls the latest days.
Monthly email on your logo
Email the report on the day you choose, with your client’s branding and no Porter badge on paid plans.
More social media template galleries
Porter has a template gallery for each network and for social dashboards.
Social media report template FAQ
Are these social media report templates free?
Yes. All 30 Porter social media report templates and prompts cost nothing, and the Free plan never expires. Longer date ranges need the 14-day trial or a paid plan from $12.50 per account a month, billed annually (Porter pricing).
Can I send the social media report as a PDF?
Yes. A Porter dashboard shares by link, PDF and scheduled email. In Data Studio, choose File, Download as, PDF.
How often should I send a social media report to clients?
Monthly suits most clients, since follower growth and engagement need weeks to show a trend. Send weekly during a launch.
Can I white-label the report?
Yes. Porter can pull each client’s branding and colors into the dashboards, and paid plans show no Porter badge (Porter pricing).
Claude, Porter dashboard or Data Studio: which should I use?
Use Claude to build the report and ask follow-up questions, but anyone opening a shared Claude dashboard needs their own Claude access (Anthropic’s guide to sharing artifacts). Use a Porter dashboard for client links, and Data Studio if your reports live there.
Get your free social media report template
Pick a template, connect your social accounts for free and send your first social media report on your own data.
Free plan · 14-day trial · No card needed