





Trusted by 1,600+ marketing teams and agencies


What you can do with this Google Analytics dashboard
Five jobs this Google Analytics dashboard does across your whole GA4 property. Click one to see its view on demo data, then paste its prompt into the same Claude chat.
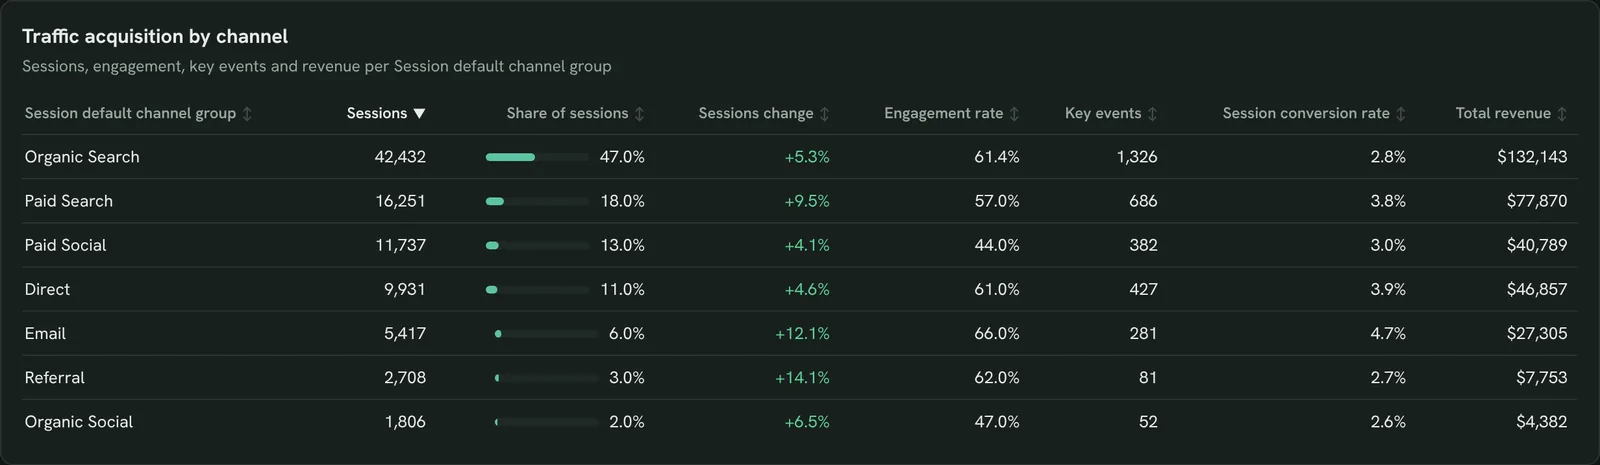
See which channels bring visitors that convert
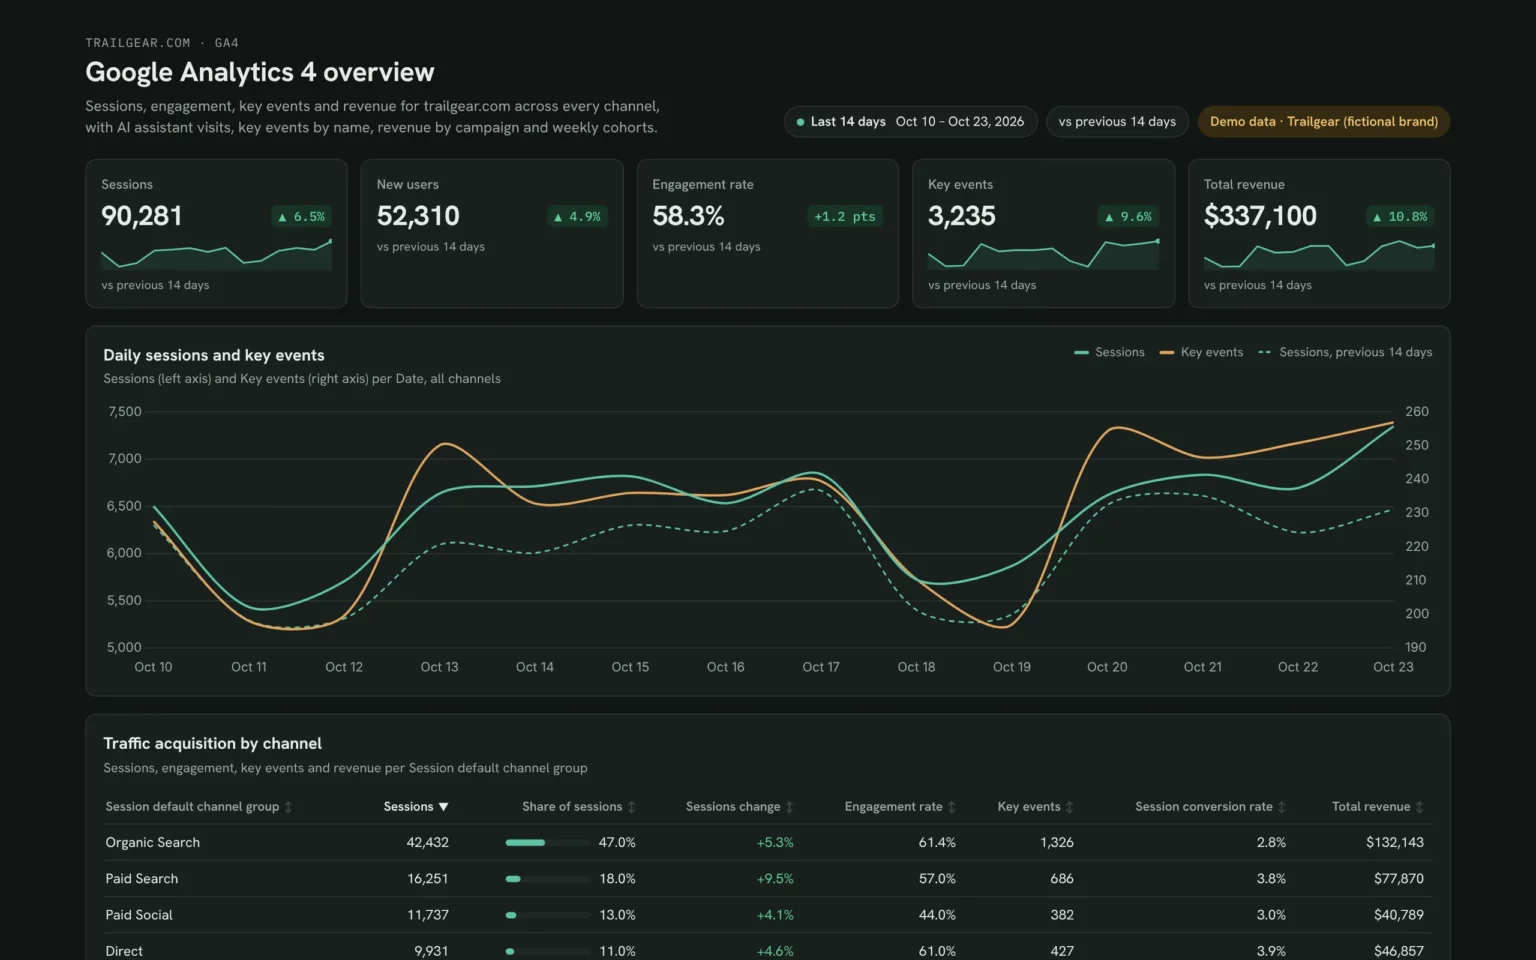
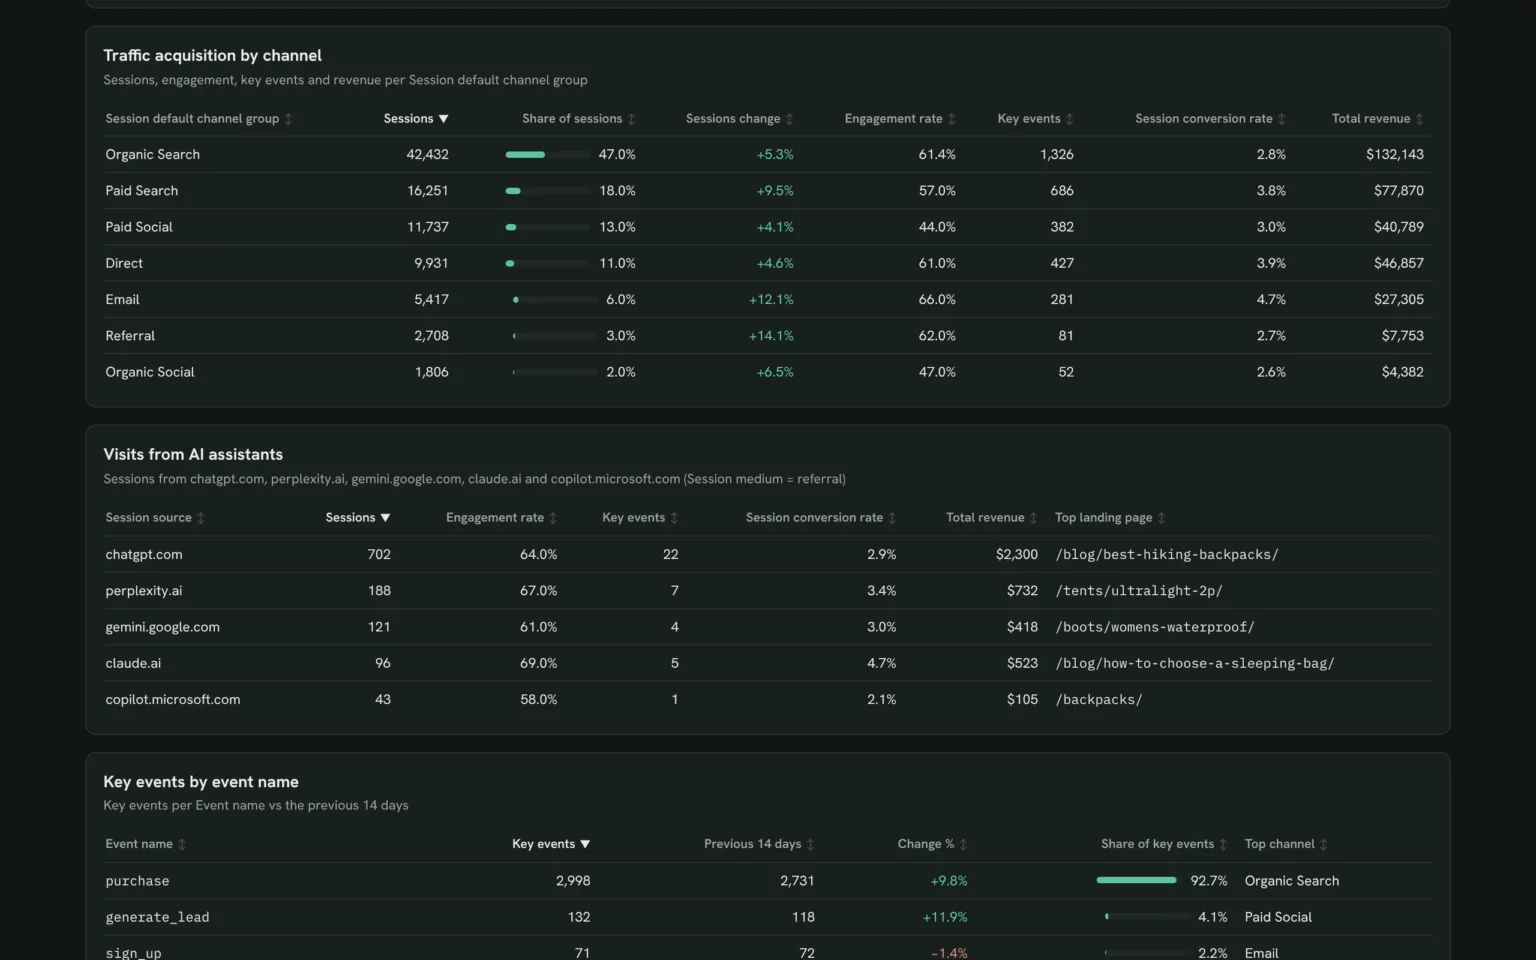
Sessions, engagement rate, key events and revenue for every default channel group, so you put budget and content behind the channels that pay back.
- Which channels bring the most sessions and revenue?
- Which channel converts best per session?
Show sessions, share of sessions, change vs the previous 14 days, engagement rate, key events, session conversion rate and total revenue by session default channel group for the last 14 days.Also built for this: GA4 SEO dashboard template
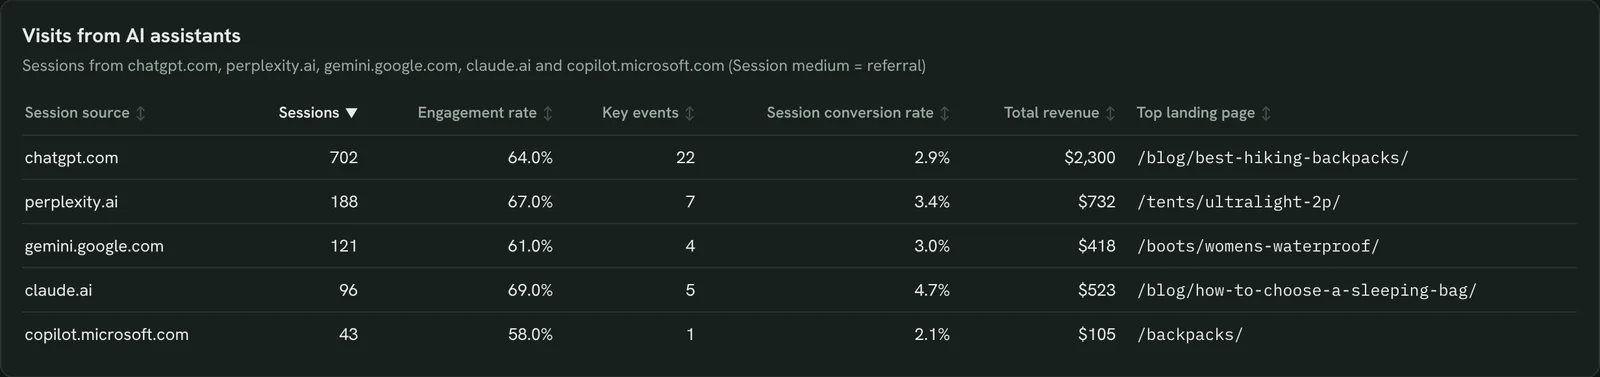
Track visits from ChatGPT, Perplexity and Claude
Sessions from AI assistants by source, with key events, revenue and the page each one lands on, so you know what AI answers send you.
- How many sessions come from AI assistants?
- Which pages do they land on, and do they convert?
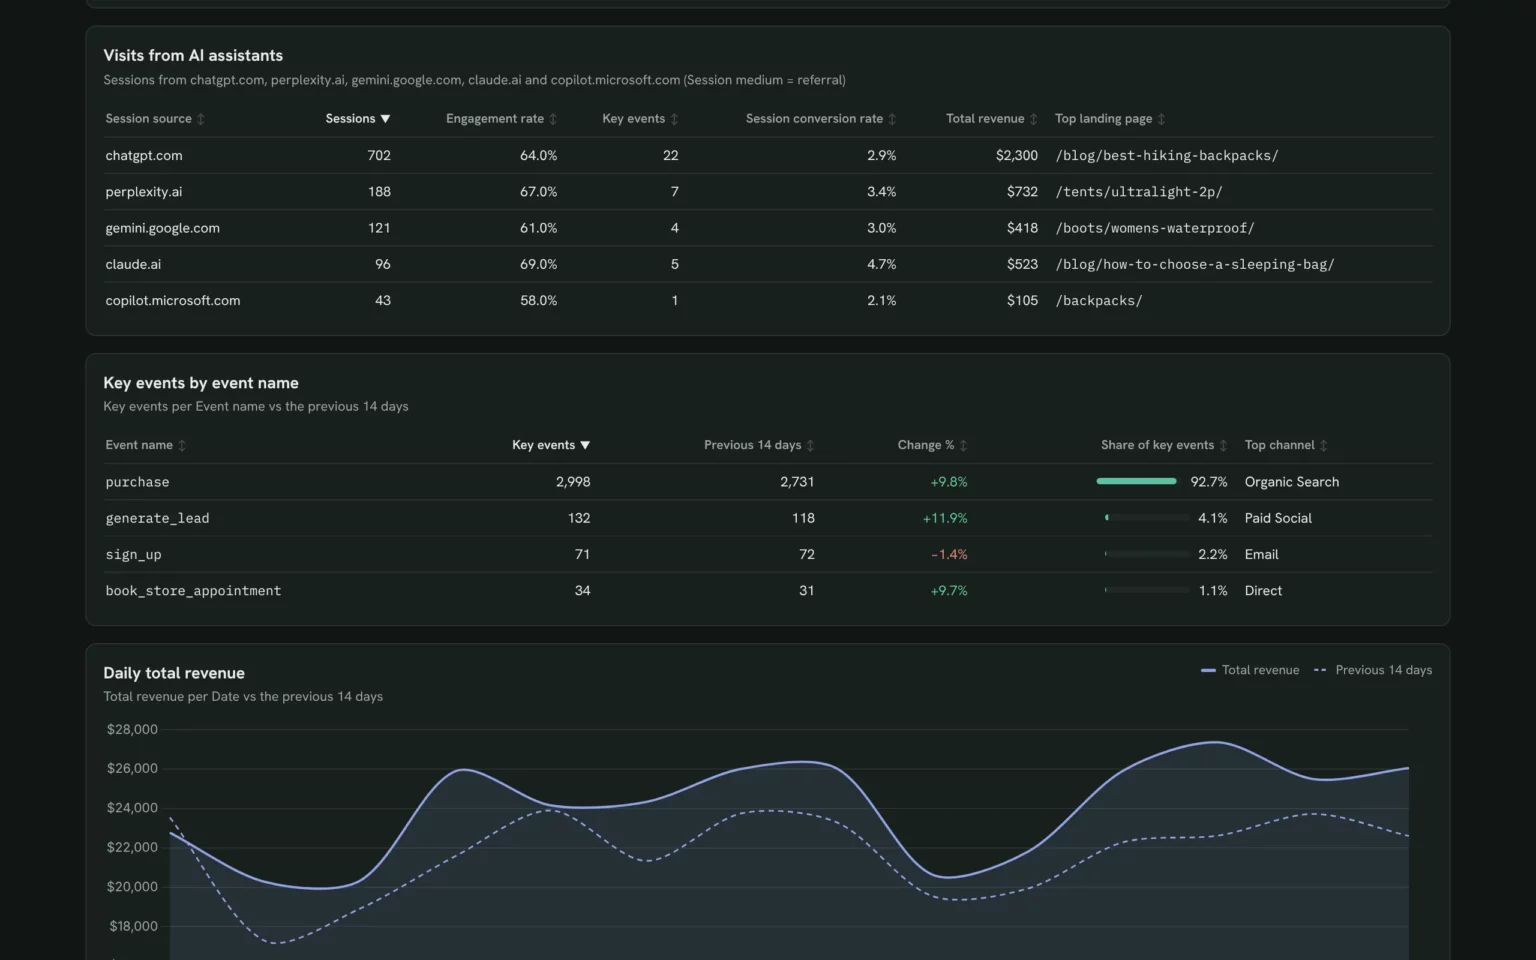
Show sessions, engagement rate, key events, session conversion rate and total revenue where session source is chatgpt.com, perplexity.ai, gemini.google.com, claude.ai or copilot.microsoft.com, with the top landing page for each, for the last 14 days.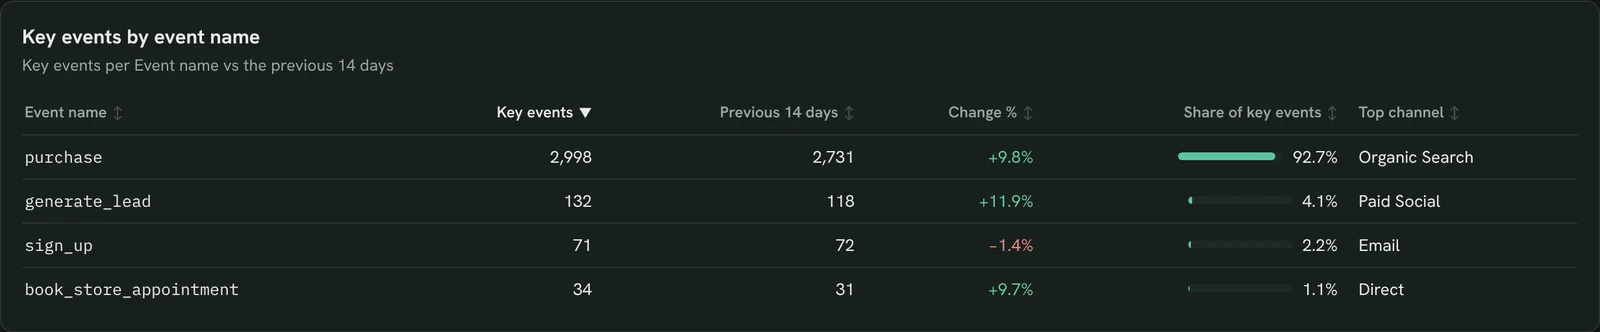
Break down key events by action
Each key event by name against the previous 14 days and the channel that drives it, so a form or purchase that stops firing stands out.
- Which key events fire most, and which grew?
- Did any key event drop to zero?
Show key events by event name for the last 14 days and the 14 days before, with the change, the share of all key events and the session default channel group that brings the most of each.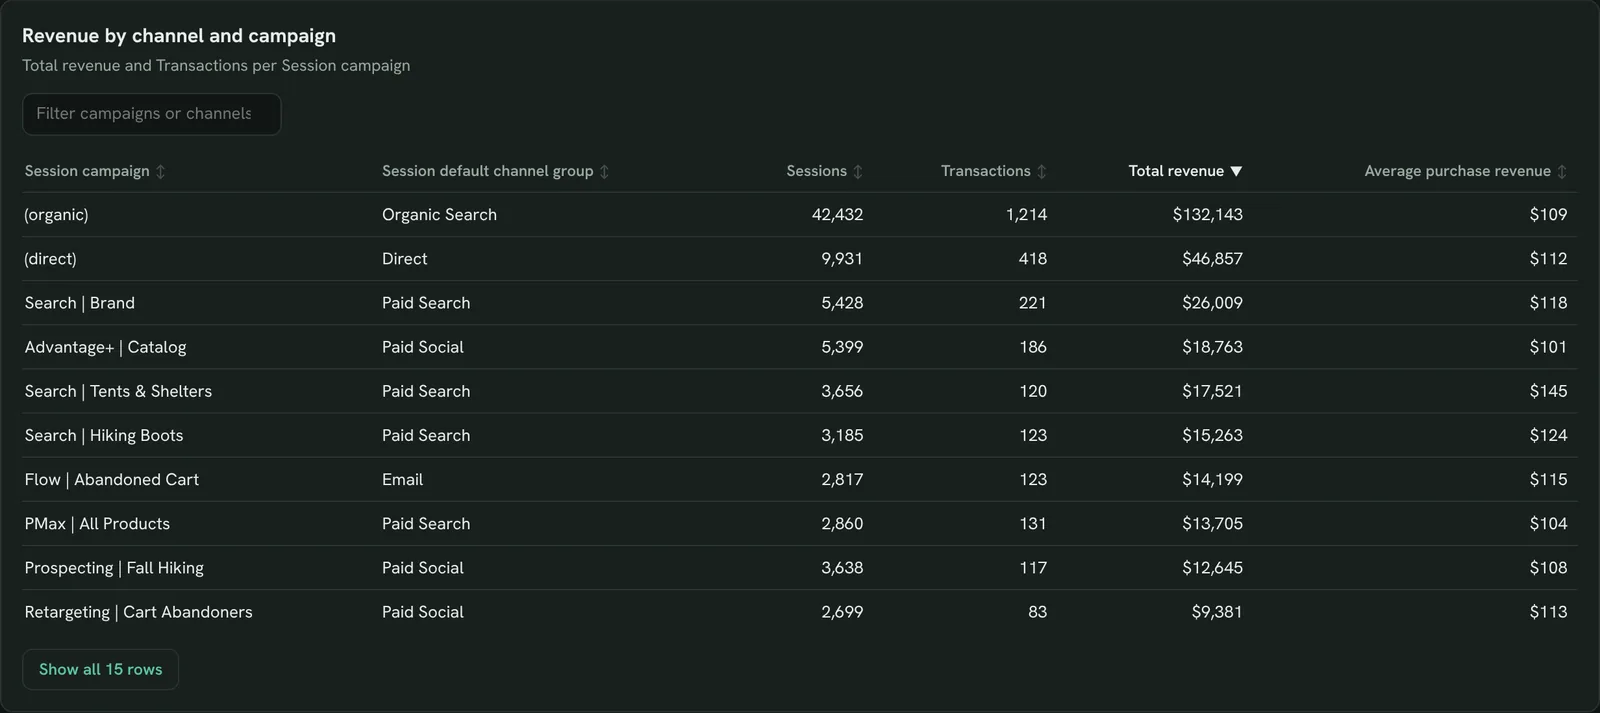
Track revenue by channel and campaign
Total revenue, transactions and average purchase revenue per campaign, so you see which campaigns sell and which only bring traffic.
- Which campaigns bring the most revenue?
- Which campaigns have the highest order value?
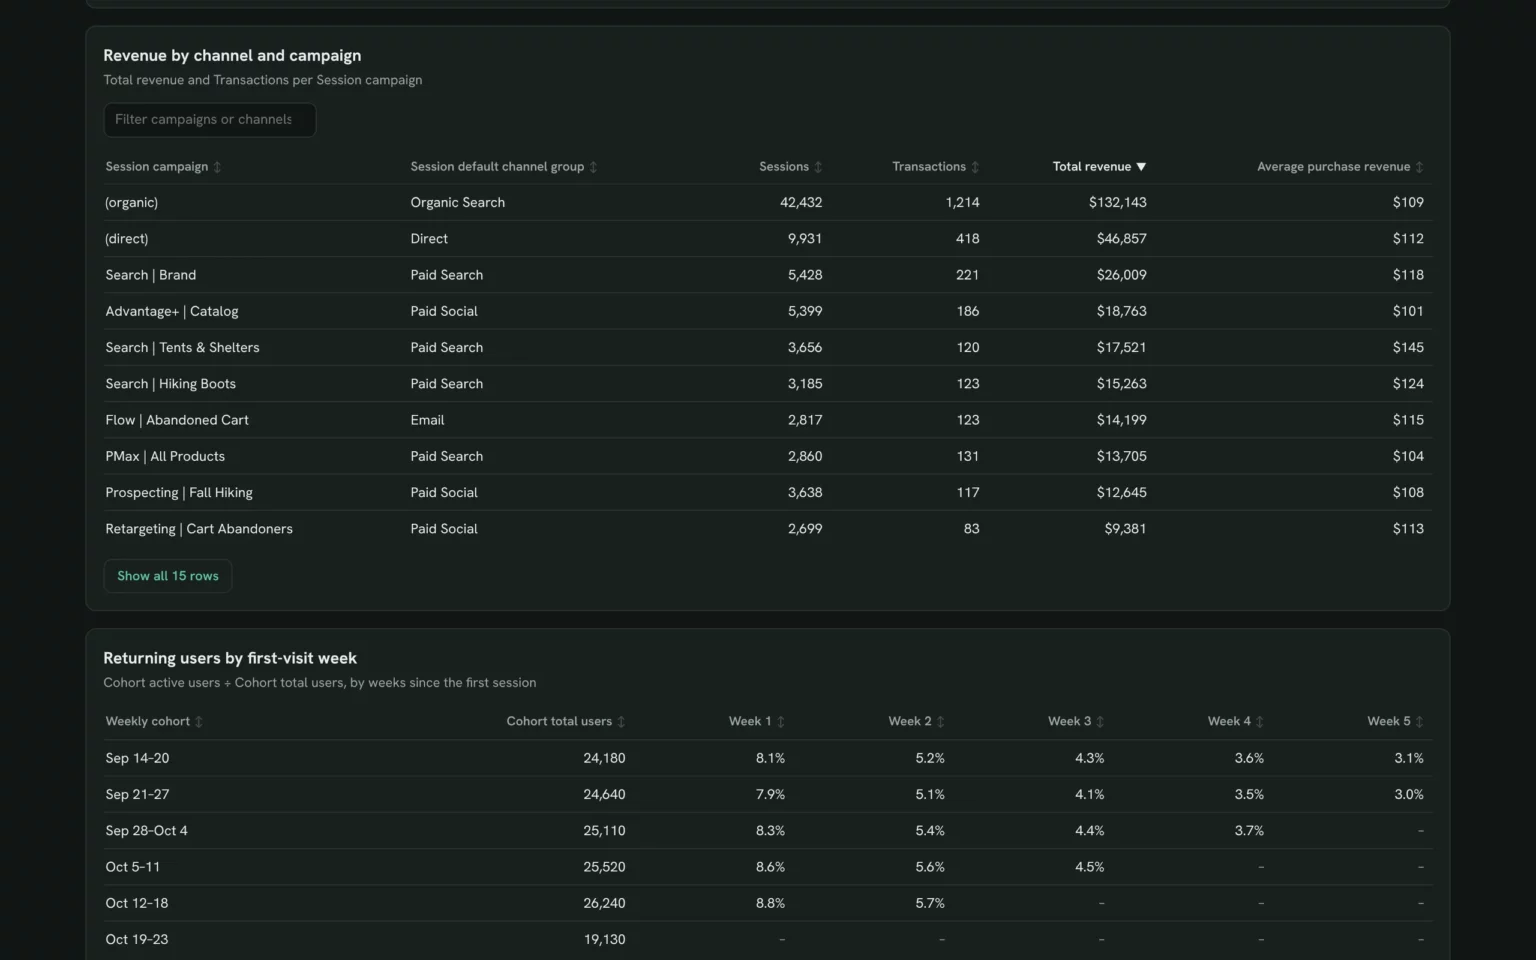
Show sessions, transactions, total revenue and average purchase revenue by session campaign and session default channel group for the last 14 days, sorted by total revenue.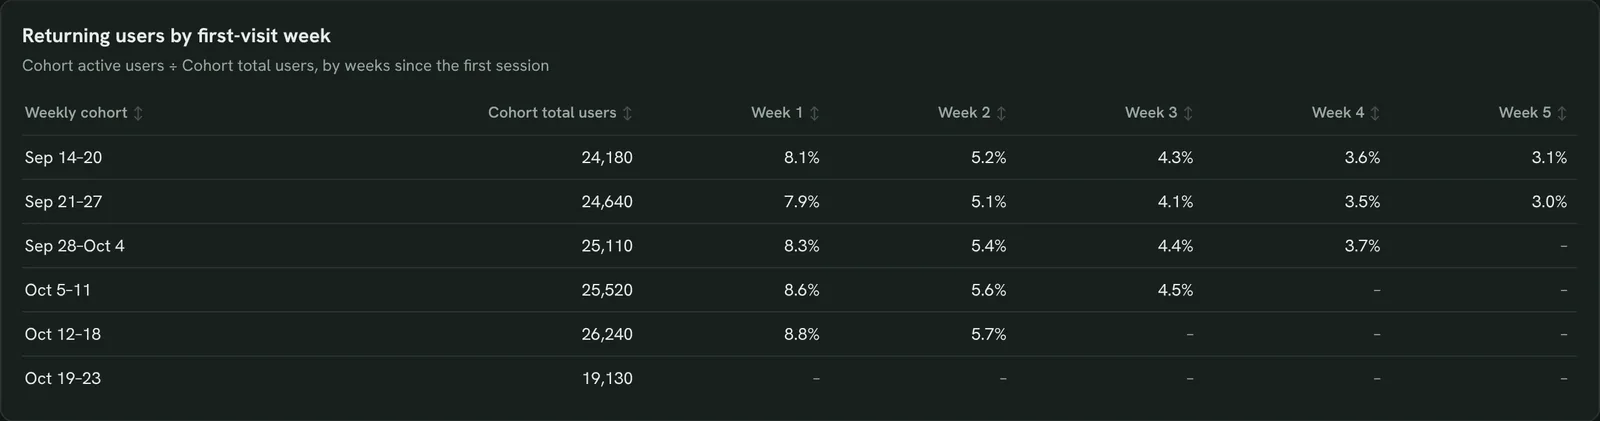
Compare returning users by first-visit week
Weekly cohorts by first visit with the share still active each week after, so you can tell whether new visitors come back.
- How many new users return after week 1?
- Which cohort kept the most users?
Show weekly cohorts by first session date for the last 6 weeks with cohort total users and cohort active users divided by cohort total users for weeks 1 to 5. Six weeks of history needs the 14-day trial or a paid plan.How to set up the Google Analytics dashboard in Claude
You need a GA4 property your Google account can read, a free Porter account and Claude Pro, Max, Team or Enterprise for Claude Dashboards. Setup takes about 8 minutes.
Connect Google Analytics 4 in Porter
Sign up free at Porter, open Data sources, pick Google Analytics 4 and choose your property. The GA4 to Claude tutorial shows each click.
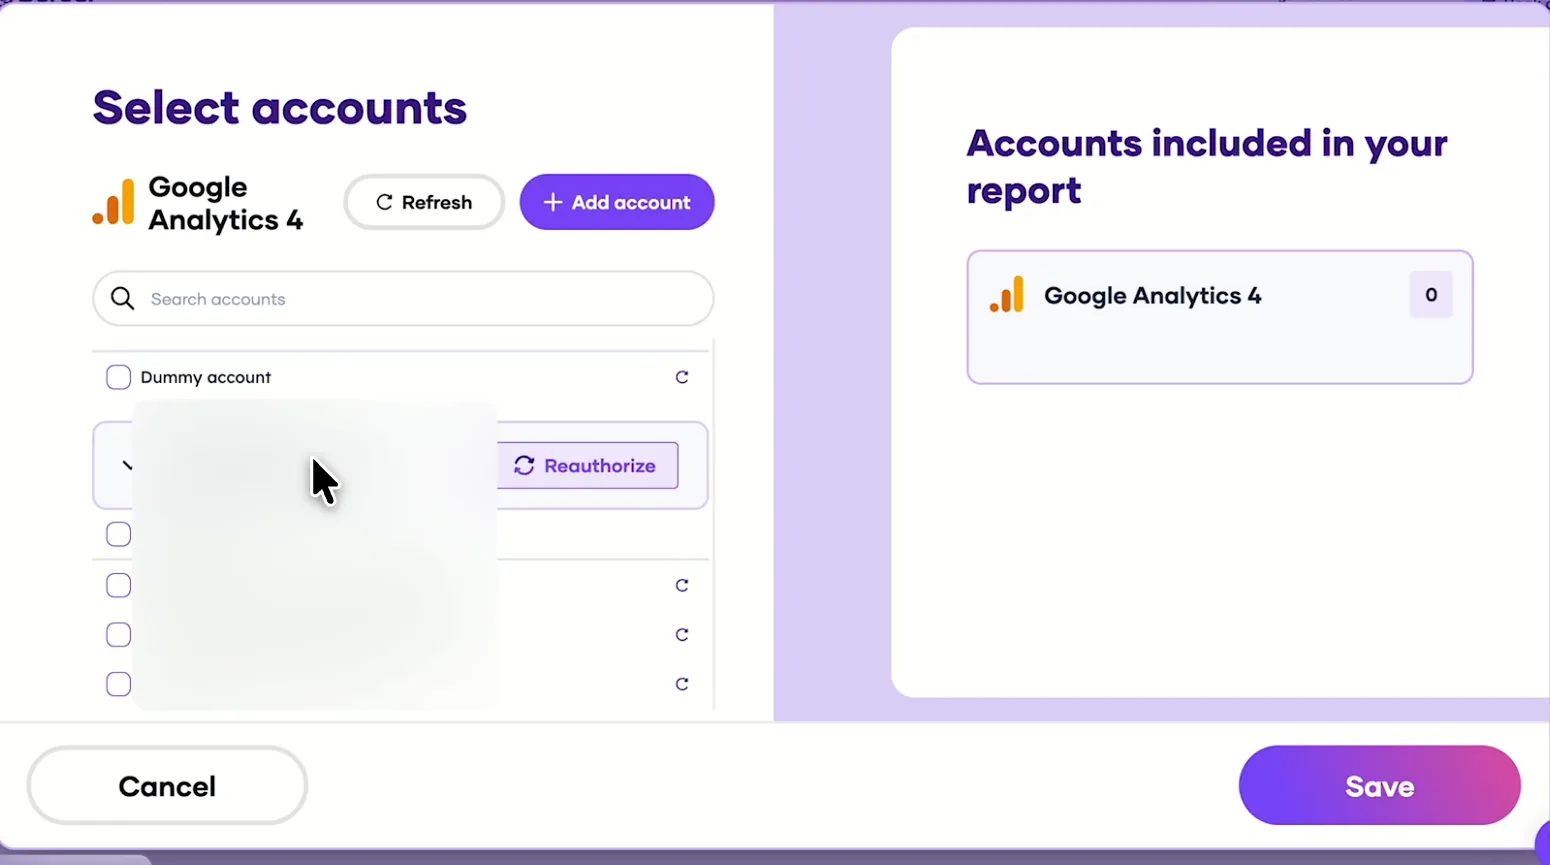
Pick the GA4 properties Claude can read, then save. Add Porter to Claude
In Claude, go to Customize → Connectors → Add custom connector, paste https://mcp.portermetrics.com/mcp and name it Porter Metrics. Click Continue, then sign in to Porter and allow access.
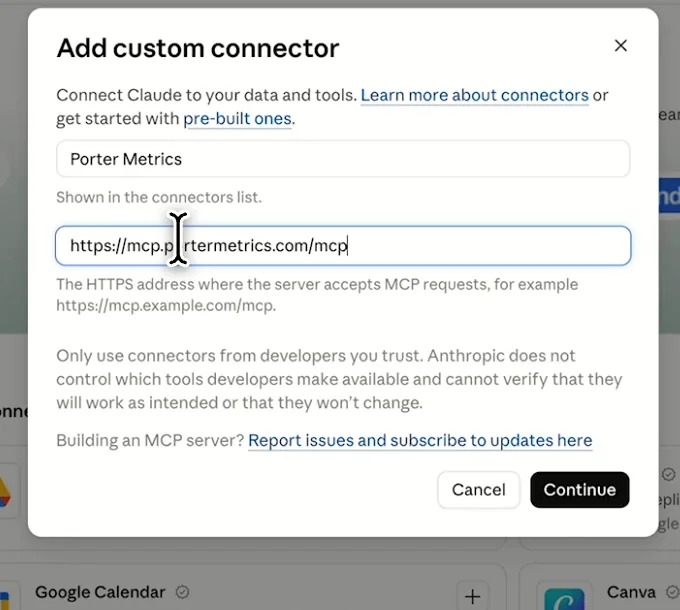
In Claude: Customize, Connectors, Add custom connector, then paste Porter’s MCP URL Paste the install prompt
Open a new chat in Claude, paste this prompt and replace the property in brackets with your own. Claude queries GA4 through Porter and builds the dashboard.
Install promptDuplicate this Claude dashboard template and keep its layout, views and styling: https://claude.ai/artifact/VFDr4uTj5YvtgYQeJwwqse Then rebuild it with my own data through Porter: a Google Analytics 4 dashboard for [property] for the last 14 days against the 14 days before: KPI cards for sessions, new users, engagement rate, key events and total revenue; daily sessions and key events; a table by session default channel group with sessions, engagement rate, key events, session conversion rate and total revenue; sessions from chatgpt.com, perplexity.ai, gemini.google.com, claude.ai and copilot.microsoft.com by session source with key events, revenue and top landing page; key events by event name; daily total revenue; and total revenue and transactions by session campaign. If my plan reads 6 weeks of data, add weekly cohorts by first session date with the share of users active in weeks 1 to 5. Open in Claude with this prompt

The first thing Claude builds: KPI cards for your own property. Demo data shown.
How to connect Google Analytics 4 to Claude (no code)
Google Analytics dashboard fields and data
The Google Analytics dashboard reads ten GA4 metrics and nine dimensions, all from one property. Porter reads 285 GA4 fields if you want to add more.
Top 5 Google Analytics KPIs to watch
Trailgear demo data · last 14 days vs the 14 before
- Sessions90,281+6.5%
Check which channel moved before you celebrate a rise: one campaign can hide a drop everywhere else.
- New users52,310+4.9%
Rising new users with flat sessions per user means people come once. The cohort view shows if they return.
- Engagement rate58.3%+1.2 pts
A channel far below the rest usually sends the wrong visitors. The bars are each channel.
- Key events3,235+9.6%
If sessions grow and key events don’t, look at the event table before blaming traffic.
- Total revenue$337,100+10.8%
Compare it with key events: revenue rising faster means bigger orders, not more of them.
How the numbers are calculated
- Engagement rate
- Engaged sessions ÷ sessions. A session is engaged after 10 seconds, a key event or two page views.
- Session conversion rate
- Sessions with at least one key event ÷ sessions.
- Average purchase revenue
- Total revenue ÷ transactions.
- AI assistant visits
- Sessions whose session source is an AI assistant domain, such as chatgpt.com or perplexity.ai.
- Change
- (This period − previous period) ÷ previous period. Rates change in percentage points.
Data sources
Metrics
 Sessions
- New users
- Engaged sessions
- Engagement rate
- Key events
- Session conversion rate
- Total revenue
- Transactions
- Average purchase revenue
- Cohort active users
Dimensions
- Date
- Session default channel group
- Session source
- Session medium
- Session campaign
- Event name
- Landing page + query string
- First session date
- Weekly cohort
See all fields:Google Analytics 4 · 285 fields
What makes this Google Analytics dashboard different
What you get that GA4’s own reports and dashboards don’t give you in one place.
Ask why a number moved
See key events dip, then ask Claude in the same chat which channel or landing page caused it.
Spot AI traffic without editing GA4
The prompt splits out ChatGPT, Perplexity and Claude visits, so you skip building a custom channel group in GA4 Admin.
Compare any two periods
Put the last 14 days next to the 14 before, last month or the same weeks last year.
Put ad spend next to sessions
Connect Google Ads or Meta Ads in Porter and ask Claude for cost per key event by channel.
Send clients a report on your logo
Publish it in Porter and email it, with your logo, on the day you choose.
Share it without GA4 access
Anyone with the Porter link sees the numbers, without a seat in your GA4 property.
What the dashboard includes
- KPI cards for sessions, new users, engagement rate, key events and total revenue
- Daily sessions and key events against the previous 14 days
- Traffic acquisition by channel with conversion rate and revenue
- Visits from AI assistants by source, with their top landing page
- Key events by event name
- Daily total revenue and revenue by campaign
- Weekly cohorts of returning users
- Share by link, PDF and scheduled email once published in Porter
Related dashboard templates
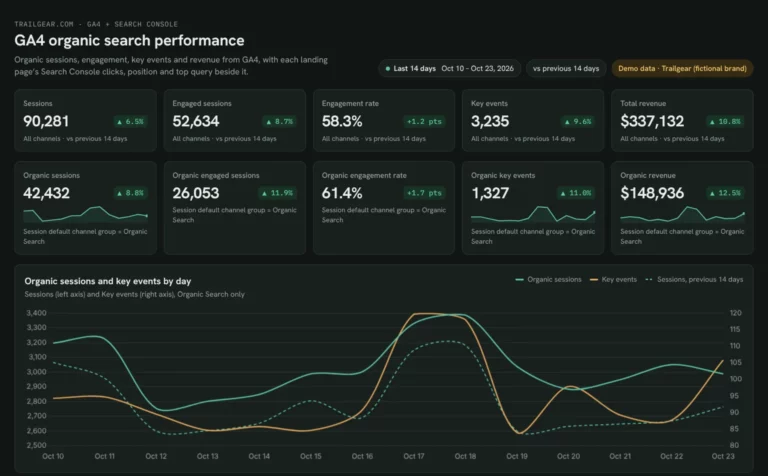 Claude

GA4 SEO dashboard template
See which landing pages bring organic sessions and key events.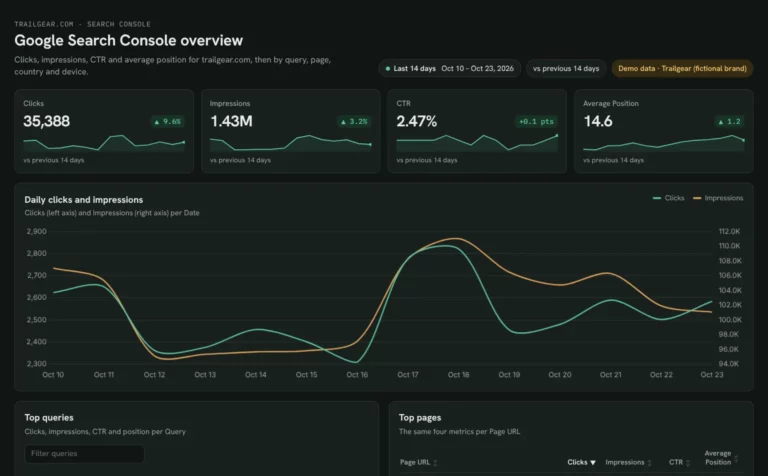 Claude
Google Search Console dashboard template
Find queries close to page one and fix low CTR by page and device.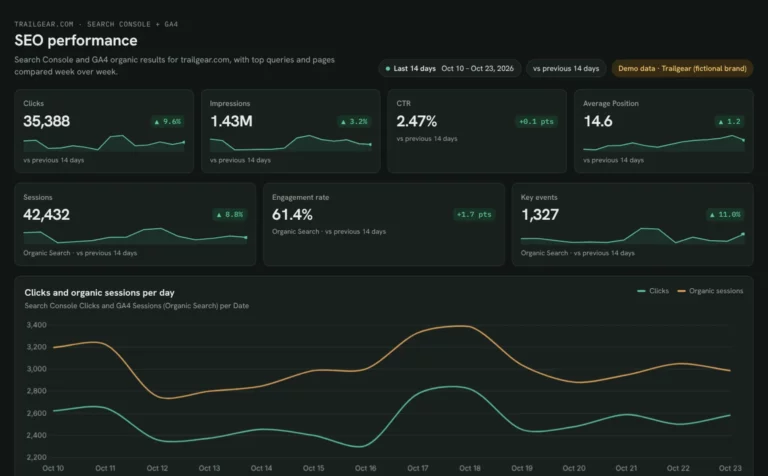 Claude
SEO dashboard template
See which Search Console clicks turn into GA4 sessions and key events.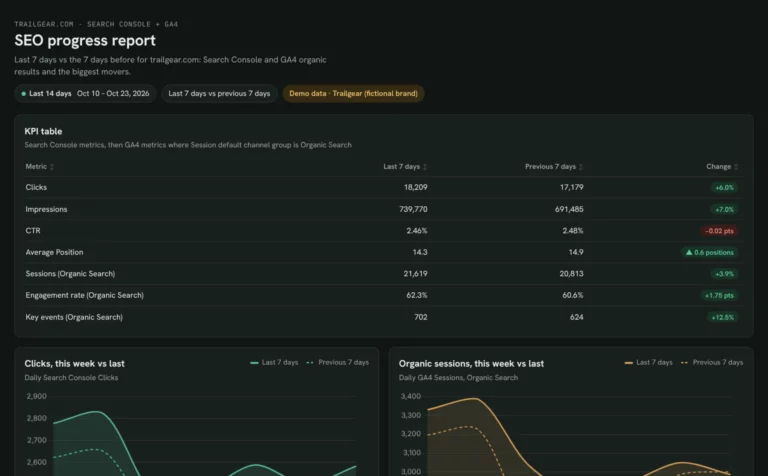 Claude
Monthly SEO dashboard template
Show month-on-month SEO results and the pages that moved them.Browse more Claude dashboard templates
By data source
GA4SEO dashboardMonthly SEO dashboardClient SEO dashboardSEO marketing dashboardSEO KPI dashboard
By use case: Web analytics
Get the Google Analytics template in other tools
 Data Studio
 Google Sheets
 ChatGPT
Get your free Google Analytics dashboard
Sign up free, connect GA4 and paste the prompt. Your own property fills the same layout as the demo.
Free plan · 14-day trial · No card needed