





Trusted by 1,600+ marketing teams and agencies


Shopify dashboard templates
Porter’s 22 Shopify dashboard templates are grouped by what each one tracks. Filter by tool or use case and open a card for its preview and setup.
22 templates
Shopify sales and store dashboards
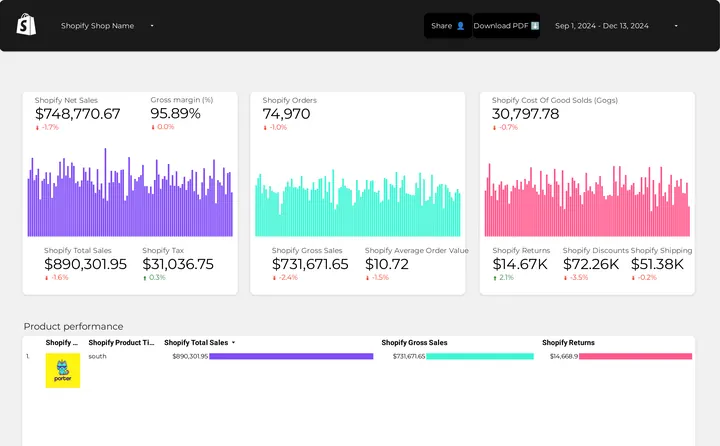
 Porter dashboard

Shopify dashboard
Follow Shopify orders and average order value and see what customers buy.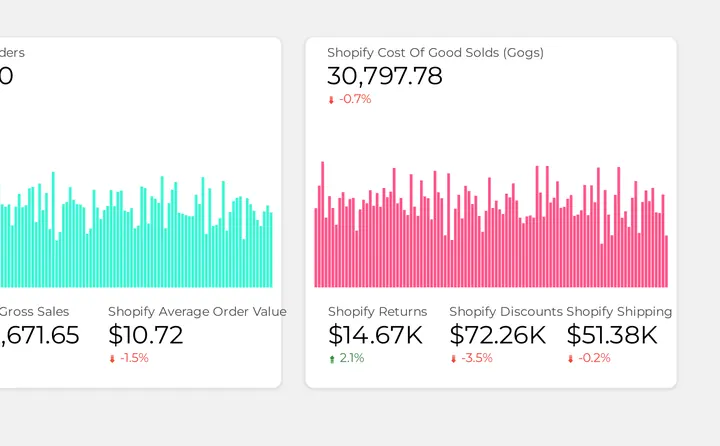
 Data Studio
Shopify report template
Break down orders by payment status and list each order in Data Studio.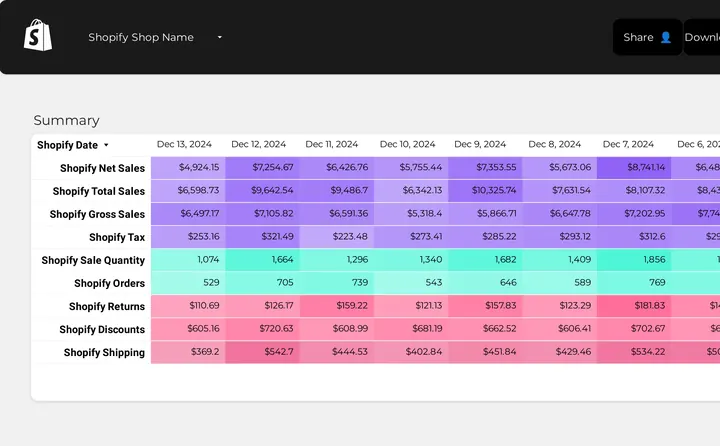 Porter dashboard
Shopify KPIs dashboard
Track net sales, orders, returns, discounts and shipping day by day.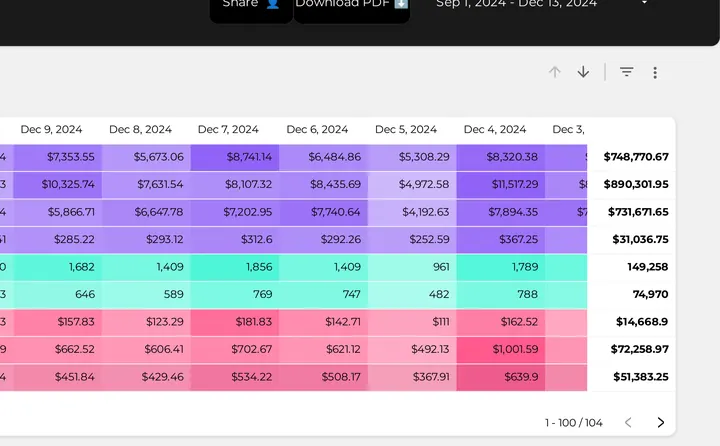 Data Studio
Shopify KPIs report template
Compare daily Shopify sales, taxes, returns and discounts in one table.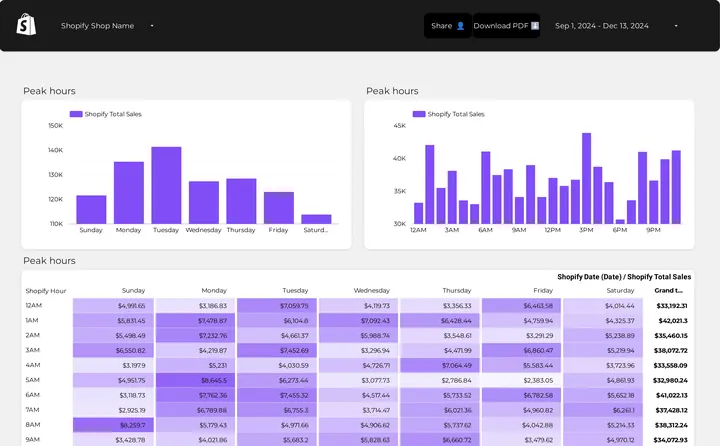 Porter dashboard
Shopify store performance
See revenue, orders and conversion rate with Google Ads and GA4 traffic.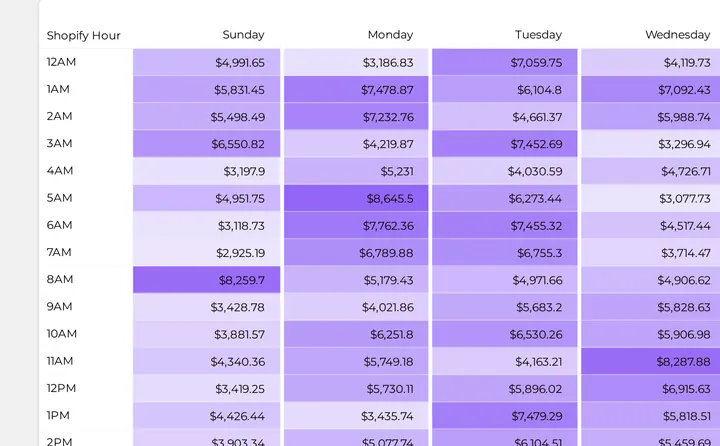 Data Studio


Shopify store performance
Break down revenue and conversion rate by traffic source and campaign.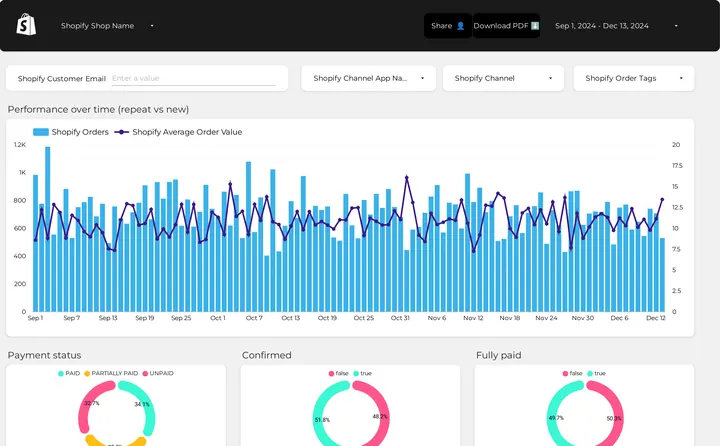 Porter dashboard
AOV dashboard
Follow average order value next to repeat and new orders over time.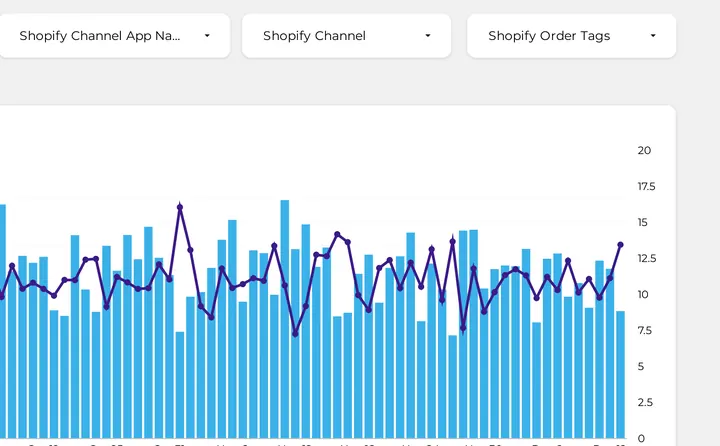 Data Studio
AOV report template
Track Shopify orders and average order value by customer in Data Studio.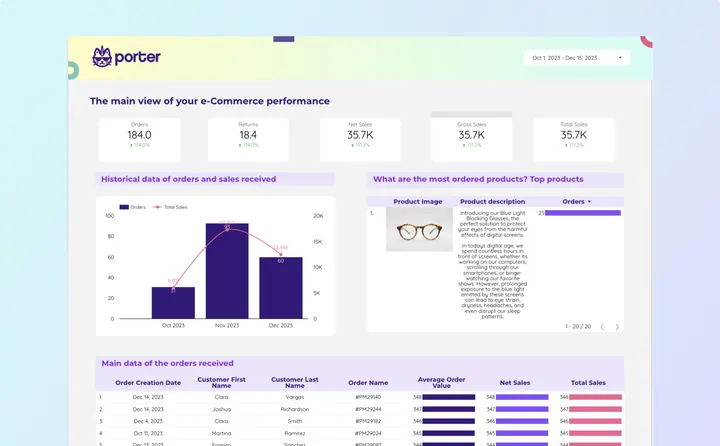 Data Studio
Shopify report template for Data Studio
See orders, sales and top products, with a table of every order.Shopify marketing, attribution and ROAS dashboards
 Claude


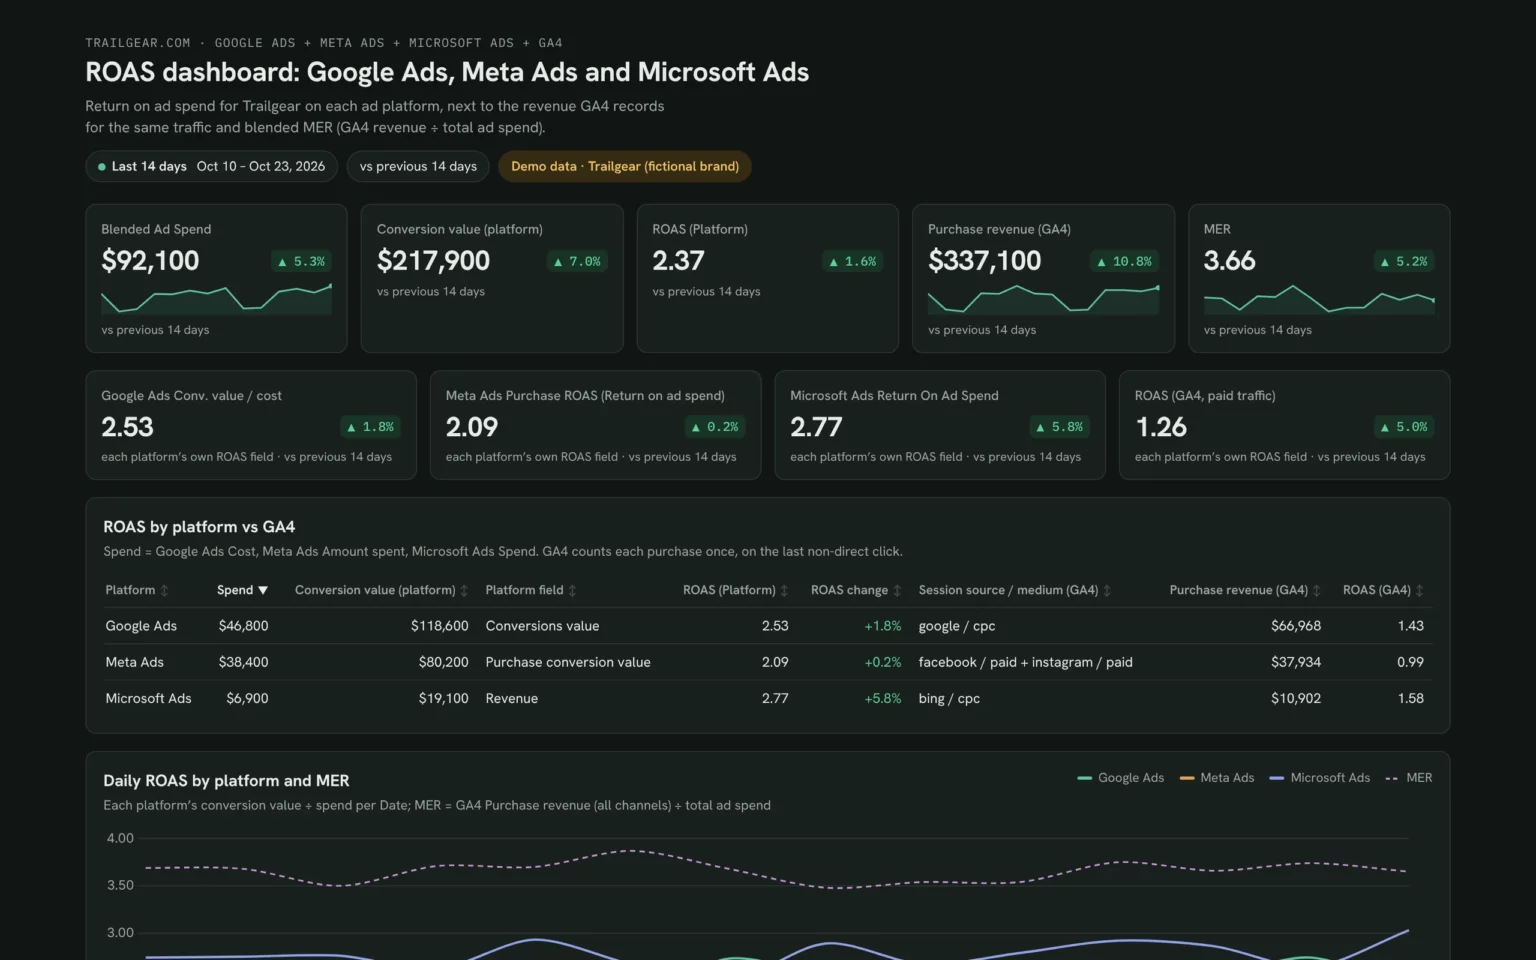
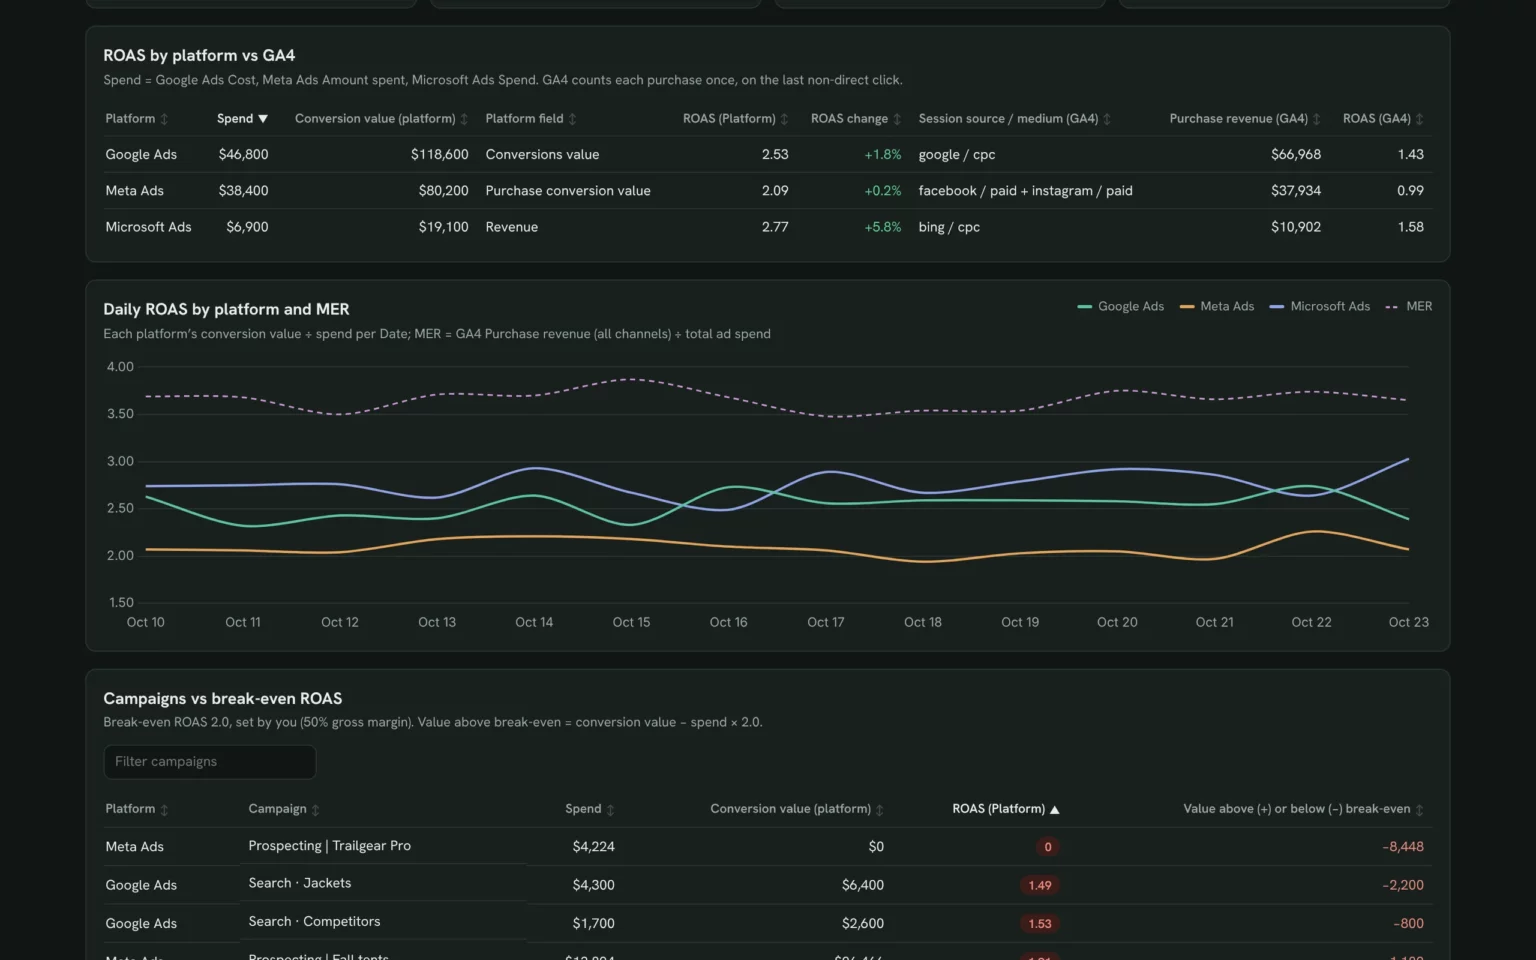
ROAS dashboard template
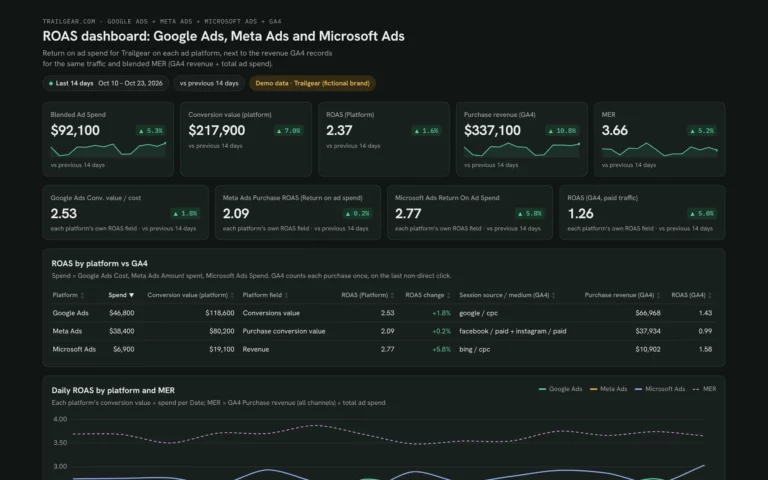
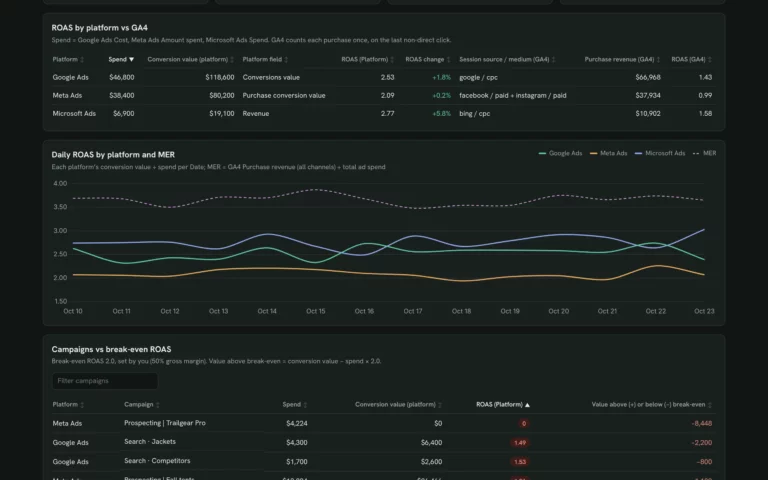
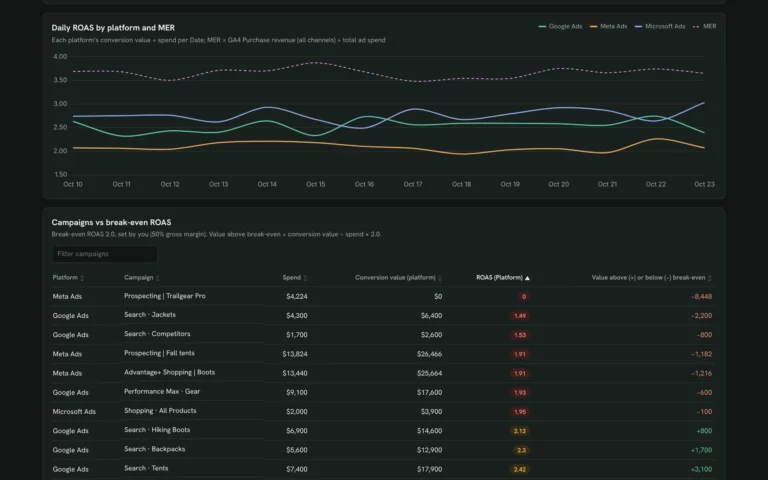
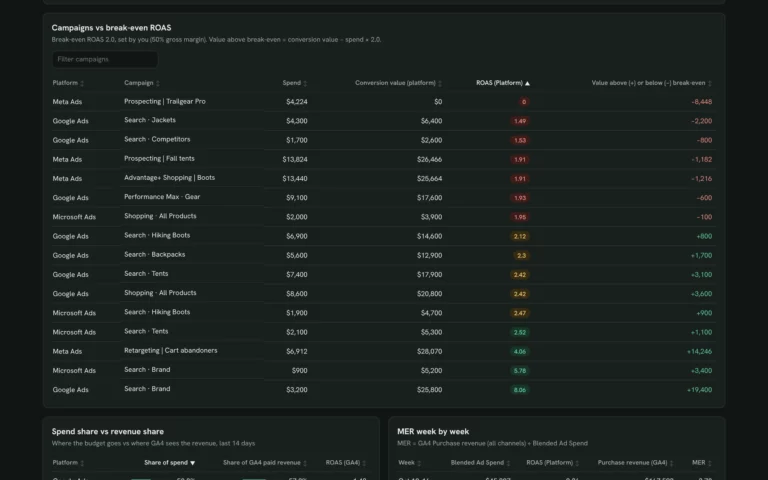
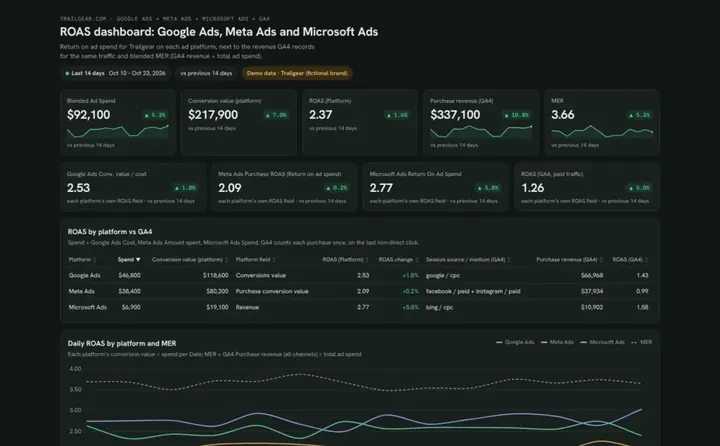
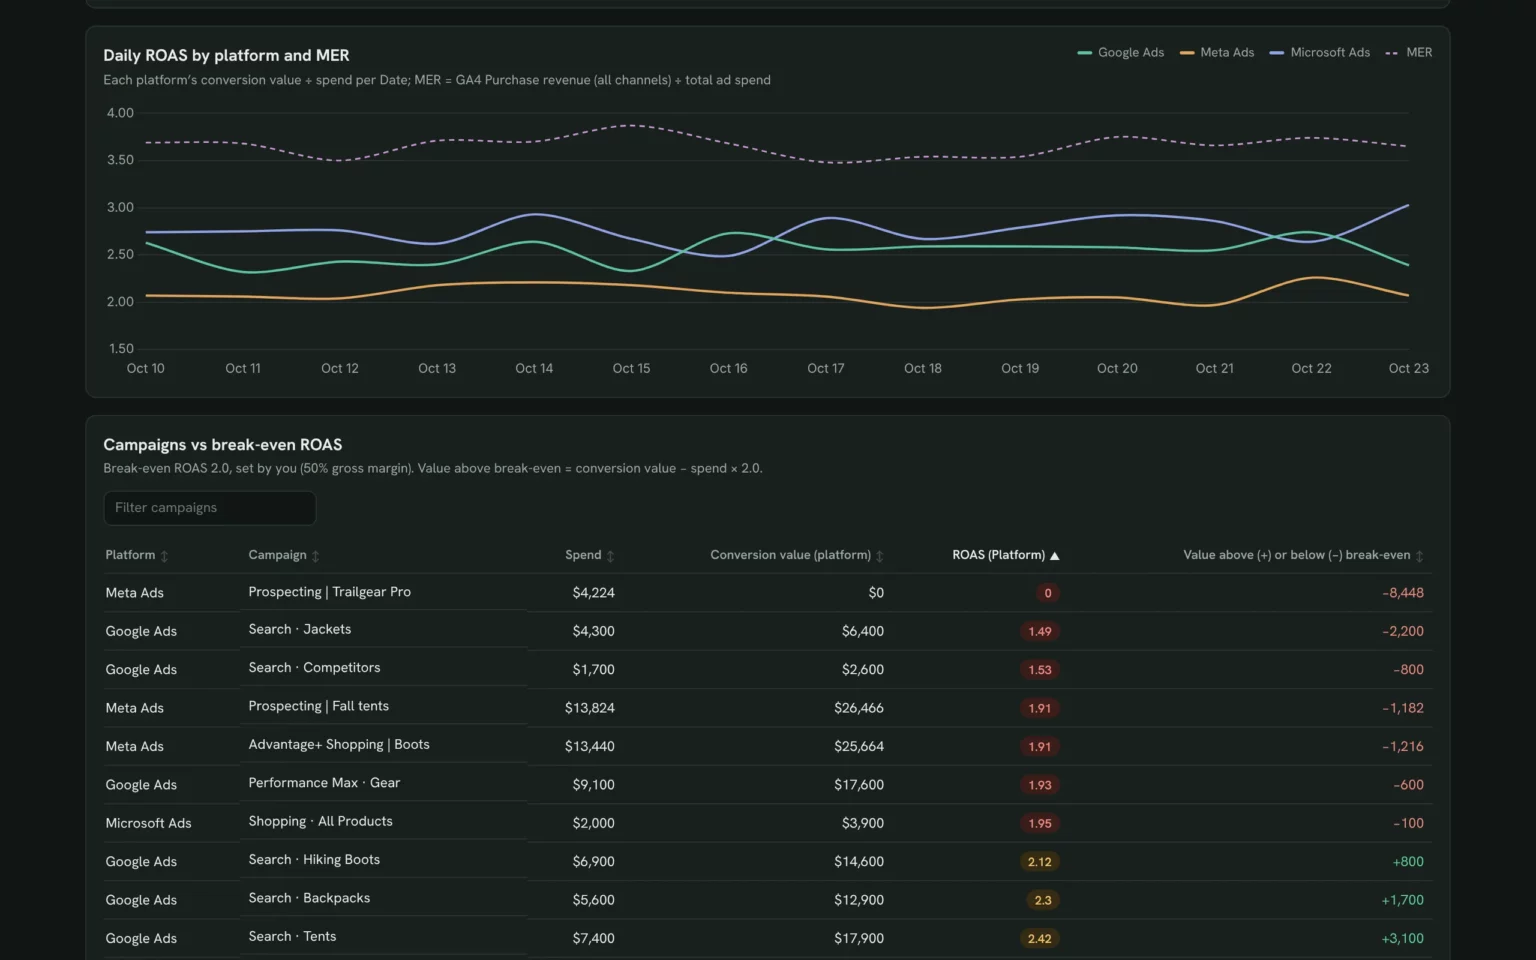
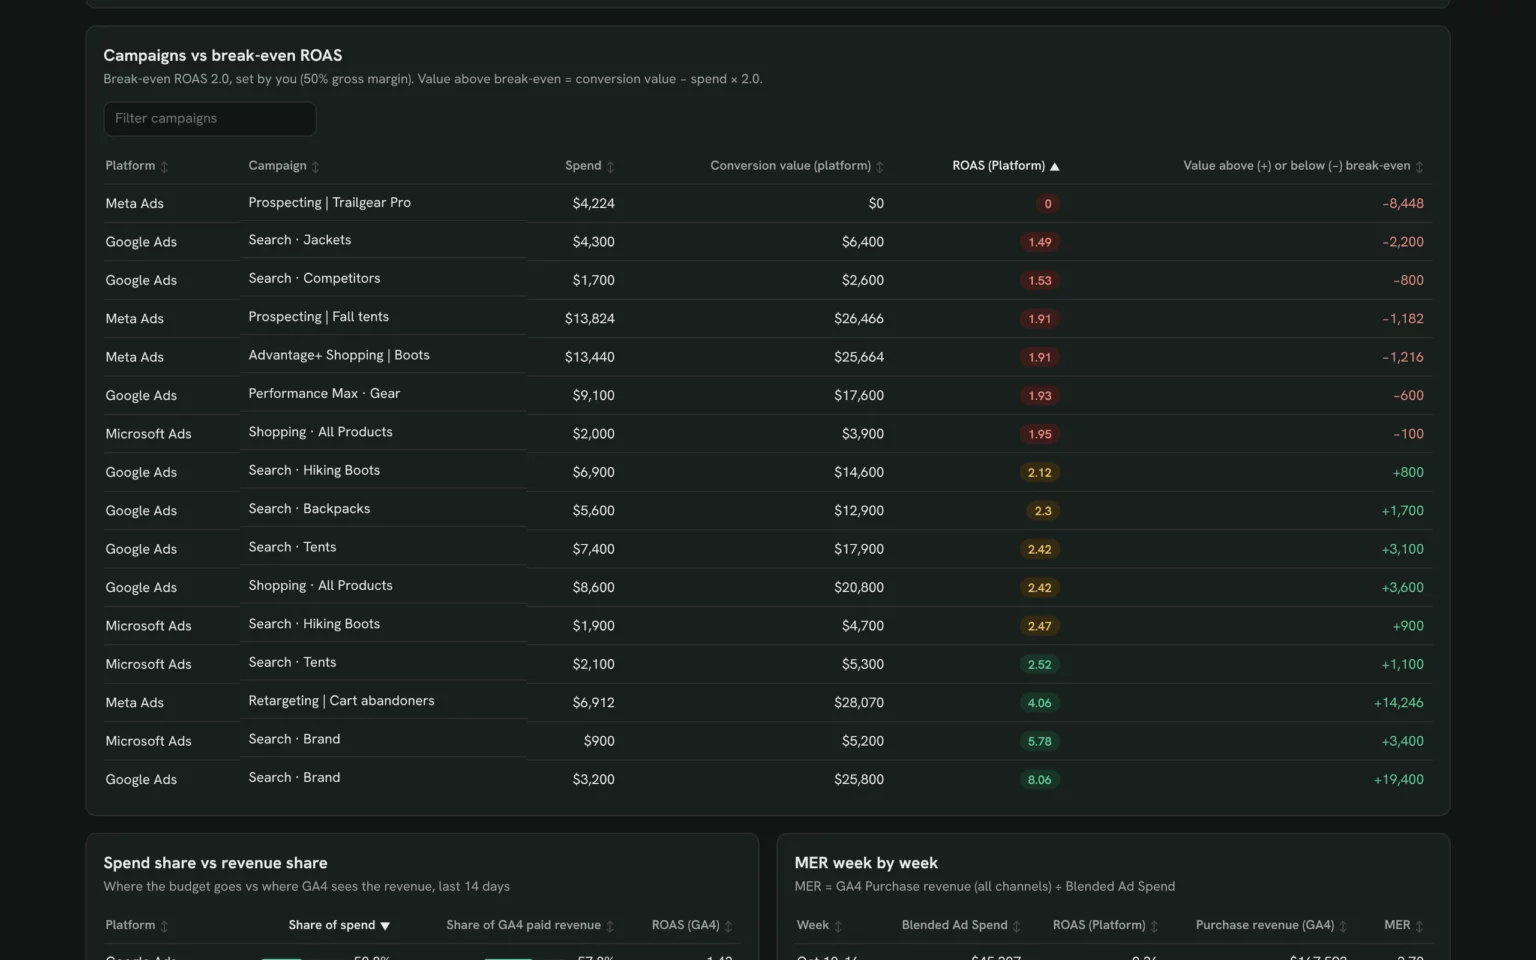
Check each ad platform's ROAS against GA4 revenue and find campaigns below break-even.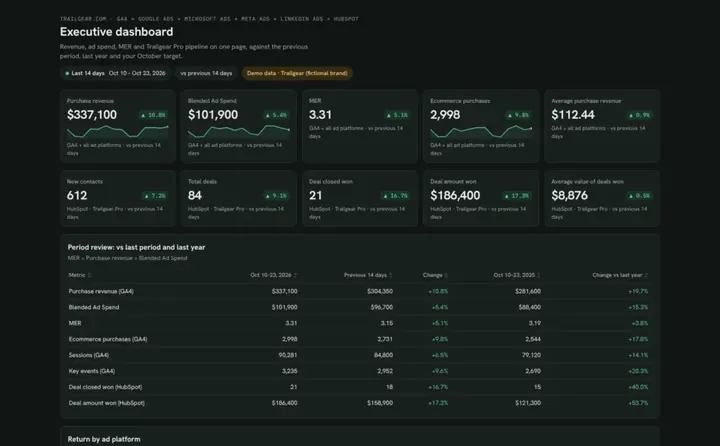 Claude

Executive dashboard template
Show leadership revenue, ad spend, MER and pipeline on one page.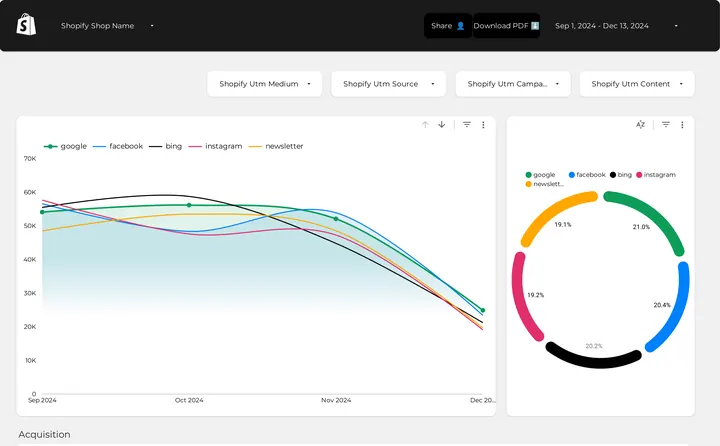 Porter dashboard
Shopify attribution dashboard
See which UTM source, medium and landing page bring Shopify sales.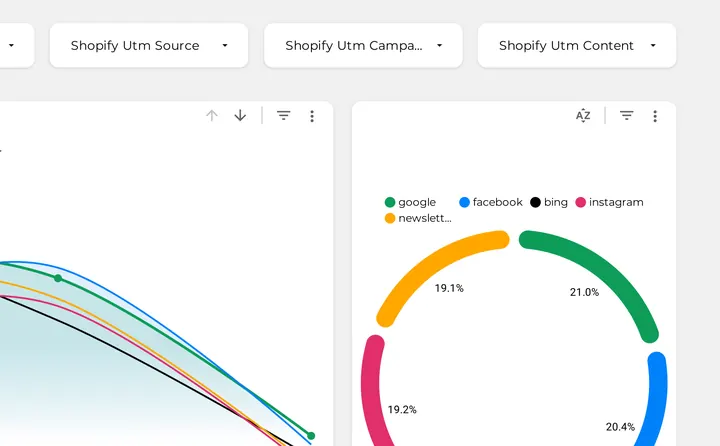 Data Studio
Shopify attribution report template
Compare sales by UTM campaign and source to see which channel pays.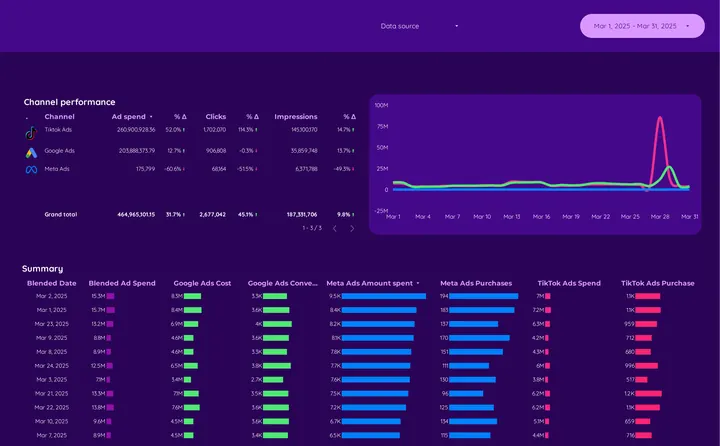 Porter dashboard

Paid media e-commerce
Put Google Ads, Meta Ads and TikTok Ads spend next to purchases, day by day.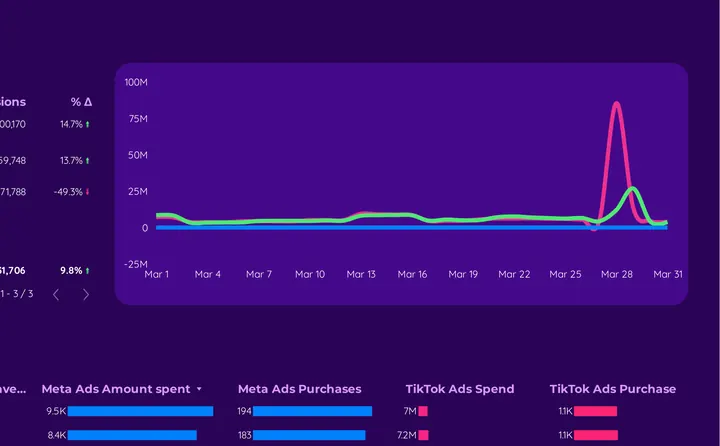 Data Studio
Paid media e-commerce
Compare ad spend and purchases from TikTok Ads, Google Ads and Meta Ads by day.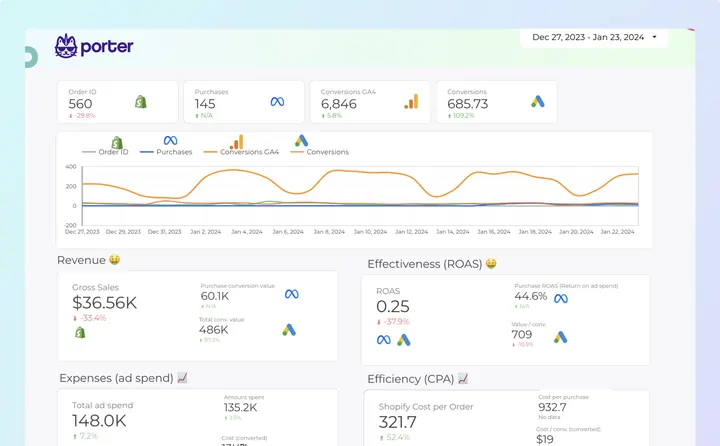 Porter dashboard
Dropshipping dashboard
Put Shopify revenue next to ad spend, ROAS and cost per order.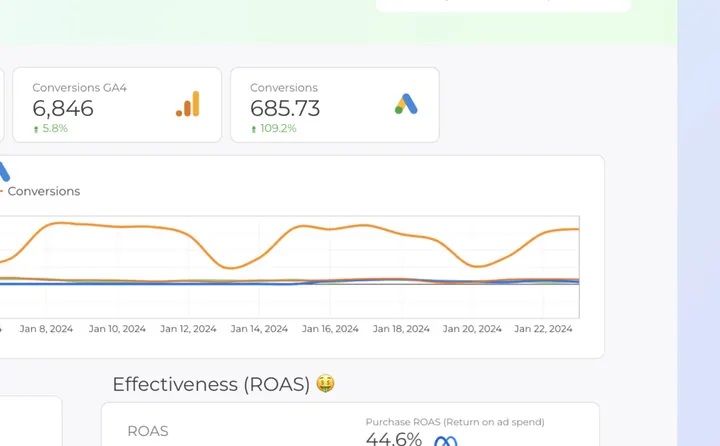 Data Studio
Dropshipping report template
Track revenue, ad spend and cost per order for a dropshipping store.Shopify customer and order dashboards
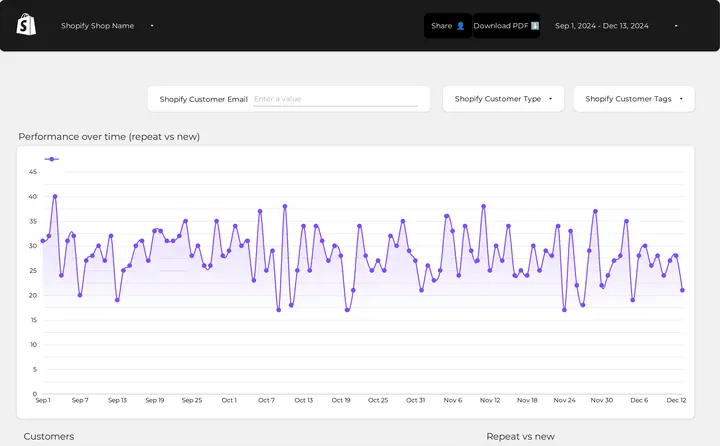 Porter dashboard
LTV dashboard
See what each customer spends over time and how many come back.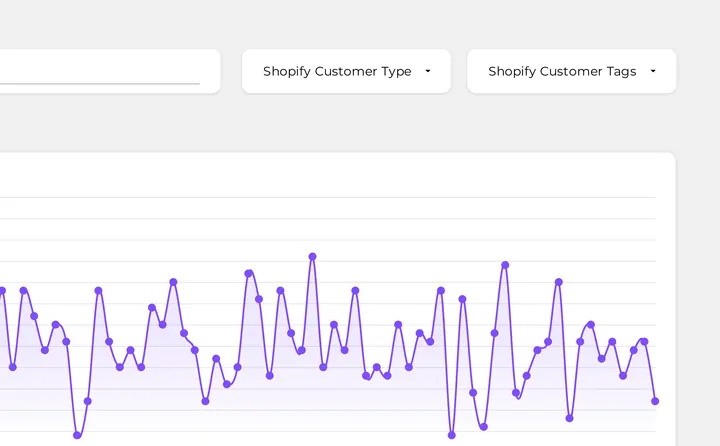 Data Studio
LTV report template
List customers by total sales and returns and compare repeat and new buyers.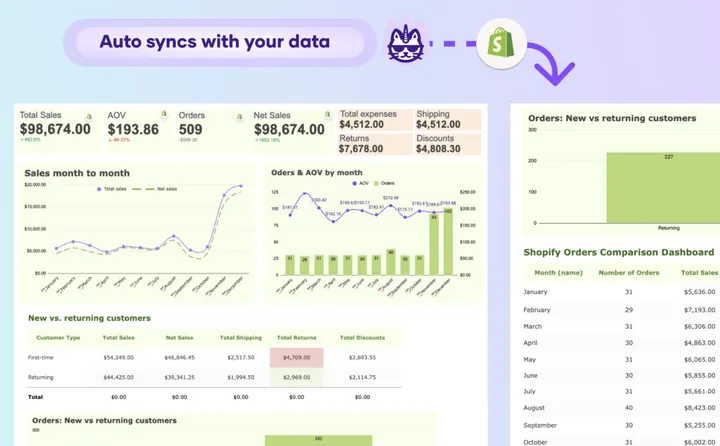
 Google Sheets
Shopify sales and orders
Pull Shopify sales and orders into a sheet you can total by month.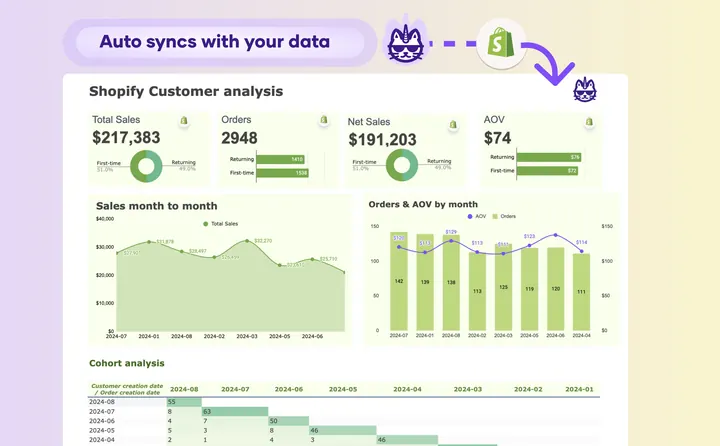 Google Sheets
Shopify customer and cohort analysis
See how many customers from each month come back to buy again.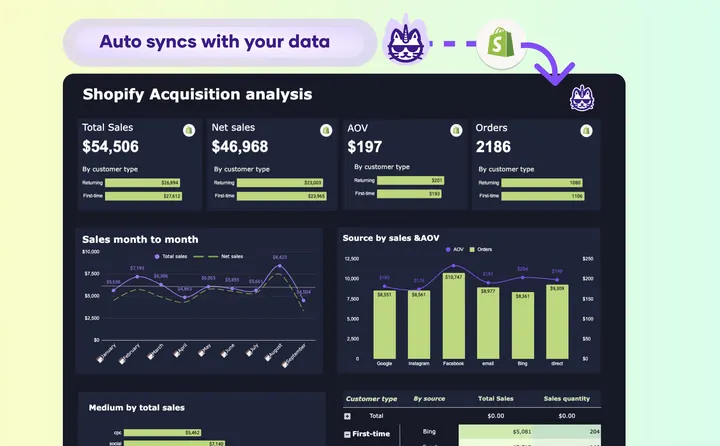 Google Sheets
Shopify acquisition source
Compare Shopify sales and AOV by the source that brought each customer.E-commerce dashboard example in Claude
There is no Shopify template for Claude yet. Porter’s closest example is the Claude ROAS dashboard on Trailgear demo store data: GA4 revenue against Google Ads, Meta Ads and Microsoft Ads spend.
What to include in a Shopify dashboard
A Shopify dashboard should tell you how the store sells, who buys and what marketing paid off. These six parts cover it.
Sales and orders
Net sales, orders, returns and discounts against the previous period: Shopify KPIs dashboard.
Next steps
Which products, channels or offers to push next month.
For ad spend against revenue across Google Ads and Meta Ads, add the Claude ROAS dashboard.
How to set up a Shopify dashboard template
Every Porter Shopify dashboard template starts with one free step: connect your Shopify store in Porter. Then open it in your tool.
On Porter’s Free plan, Claude reads the last 15 days and Porter dashboards, Data Studio and Google Sheets up to 30 days. The 14-day trial has full access and needs no card (Porter pricing).
In Claude
Sign up free at Porter, open Data sources and connect the accounts the ROAS dashboard needs: your GA4 property and your ad accounts, for example Meta Ads.
In Claude, go to Customize → Connectors → Add custom connector, paste
https://mcp.portermetrics.com/mcpand name it Porter Metrics. Click Continue, sign in to Porter and allow access.Open a new chat, paste the install prompt and put your accounts in place of the one in brackets (Meta Ads to Claude tutorial). Claude reads your data through Porter’s MCP (Model Context Protocol), an open standard that lets Claude read data from other tools.
Duplicate this Claude dashboard template and keep its layout, views and styling: https://claude.ai/artifact/SkDeerWRyTXgnPAJ5UNgFT
Then rebuild it with my own data through Porter: a ROAS dashboard for [brand] for the last 14 days from Google Ads, Meta Ads, Microsoft Ads and GA4: KPI cards for total ad spend, conversion value, ROAS, GA4 Purchase revenue and MER (GA4 Purchase revenue ÷ total ad spend); each platform's own ROAS (Google Ads Conversions value ÷ Cost, Meta Ads Purchase ROAS, Microsoft Ads Return On Ad Spend) next to GA4 Purchase revenue by Session source / medium; daily ROAS per platform and MER; every campaign's ROAS against a break-even ROAS of [2.0]; share of spend vs share of GA4 revenue; and MER by week.
Claude Dashboards is in beta on Pro, Max, Team and Enterprise (Anthropic’s guide to Claude Dashboards).
As a Porter dashboard
Open a Porter dashboard card and click Download template.
Sign in to Porter and pick your accounts.
Share it with viewer or editor access, or schedule it by email.
In Data Studio
Open a Data Studio card and click Download template.
Click the three-dot menu (⋮) in the top-right corner and select Make a copy.
Choose your Porter data sources, click Copy Report and set the date range you want to track.
In Google Sheets
Open a Google Sheets card and make a copy.
Install the Porter extension, authorize it and choose your accounts.
Run the prebuilt queries and set the refresh to daily or weekly.
Need Excel? In Google Sheets, choose File → Download → Microsoft Excel (.xlsx).
What makes these Shopify dashboard templates different
Shopify Analytics shows the store. These templates put the store next to the marketing that drives it.
Sales next to ad spend
See revenue, ad spend and cost per order together in the dropshipping and paid media e-commerce templates.
Customer cohorts in a sheet
See how many customers from each month come back, in a Google Sheet that refreshes itself.
One store or many
Connect unlimited stores on any plan and switch with the shop filter.
Four tools
Share a Porter link, copy the Data Studio report, work in Google Sheets or ask Claude about ROAS.
Scheduled by email
Send a Porter dashboard to your team by email every week or month.
More dashboard template galleries
Porter has a gallery for each channel, data source and tool.
Shopify dashboard FAQ
What is a Shopify dashboard?
A Shopify dashboard is one page that shows how a store sells: net sales, orders, average order value, returns, top products and repeat customers, often next to the traffic and ads behind them.
Are these Shopify dashboard templates free?
Yes. All 22 templates on this page are free to download, and Porter’s Free plan never expires and connects unlimited accounts. Longer date ranges need the 14-day trial (no card) or a paid plan, with Reporting from $12.50 per account a month, billed annually (Porter pricing).
Which metrics should a Shopify dashboard track?
Net sales, orders, average order value, returns, discounts, repeat purchase rate and lifetime value, plus the sources and campaigns that bring sales.
Can I see Shopify sales next to Facebook Ads and Google Ads?
Yes. The dropshipping and paid media e-commerce dashboards put store revenue next to ad spend.
Is there a Shopify dashboard template for Claude?
Not yet. The Claude ROAS dashboard reads store revenue from GA4 and compares it with your ad spend; the other templates here read Shopify directly.
Porter dashboard, Data Studio, Google Sheets or Claude: which should I use?
Use Claude to build the dashboard and ask follow-up questions, but anyone opening a shared Claude dashboard needs their own Claude access (Anthropic’s guide to sharing artifacts). Use a Porter dashboard to share a live link or send it by scheduled email, Data Studio if your reports already live there, and Google Sheets for formulas or Excel.
Get your free Shopify dashboard template
Pick a template, connect your Shopify store for free and see your sales, customers and ads on one dashboard today.
Free plan · 14-day trial · No card needed