How to Connect Mailchimp to Google BigQuery
Step-by-step: how to connect Mailchimp to Google BigQuery. Compare free and paid methods including the Data Transfer Service and Porter no-code connector.
How to Connect Pinterest to Google BigQuery
Home Tutorials Pinterest to BigQuery Pinterest Google BigQuery Tutorial How to Connect Pinterest to Google BigQuery Juan Bello Founder, Porter Metrics Jan 30, 2026 15
How to Connect ActiveCampaign to Google BigQuery
Step-by-step: how to connect ActiveCampaign to Google BigQuery. Compare free and paid methods including the Data Transfer Service and Porter no-code connector.
How to Connect DV360 to Google BigQuery
Step-by-step: how to connect DV360 to Google BigQuery. Compare free and paid methods including the Data Transfer Service and Porter no-code connector.
How to Connect Google Sheets to Google BigQuery
Step-by-step: how to connect Google Sheets to Google BigQuery. Compare free and paid methods including the Data Transfer Service and Porter no-code connector.
How to Connect Instagram to Google BigQuery
Step-by-step: how to connect Instagram to Google BigQuery. Compare free and paid methods including the Data Transfer Service and Porter no-code connector.
How to Connect Facebook Pages to Google BigQuery
Step-by-step: how to connect Facebook Pages to Google BigQuery. Compare free and paid methods including the Data Transfer Service and Porter no-code connector.
How to Connect LinkedIn Pages to Google BigQuery
Step-by-step: how to connect LinkedIn Pages to Google BigQuery. Compare free and paid methods including the Data Transfer Service and Porter no-code connector.
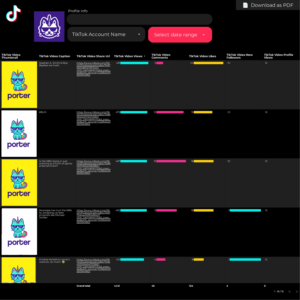
How to Connect TikTok to Google BigQuery
Step-by-step: how to connect TikTok to Google BigQuery. Compare free and paid methods including the Data Transfer Service and Porter no-code connector.
How to Connect Facebook Competitors to Google BigQuery
Home Tutorials Facebook Competitors to BigQuery Facebook Competitors Google BigQuery Tutorial How to Connect Facebook Competitors to Google BigQuery Juan Bello Founder, Porter Metrics Jan
Connect Google Business Profile to Data Studio for free: tutorial and templates
To connect Google Business Profile to Data Studio (formerly Looker Studio), visit portermetrics.com, start a free trial or use the free-forever plan, and sign in
Connect HubSpot to Data Studio for free: tutorial and templates
To connect HubSpot to Google Data Studio (formerly Looker Studio), go to Create report (or the Data Studio community connectors gallery), select Single data source,
Connect Facebook Pages to Data Studio for free: tutorial and templates
To connect Facebook Pages to Google Data Studio (formerly Looker Studio) with Porter Metrics, visit Create report, log in, select Single data source, and choose
Connect LinkedIn Ads to Data Studio for free: tutorial and templates
To connect LinkedIn Ads to Google Data Studio (formerly Looker Studio), start by visiting Porter Metrics and creating a report. Select “Single data source” and
Connect Shopify to Data Studio for free: tutorial and templates
To connect Shopify to Google Data Studio (formerly Looker Studio), visit portermetrics.com and start a free trial or use the free forever plan. Sign in
Connect Google Analytics 4 to Data Studio for free: tutorial and templates
to connect Google Analytics 4 to Data Studio (formerly Looker Studio), visit portermetrics.com, create a trial or free account, select single data source, and choose
Connect Klaviyo to Data Studio for free: tutorial and templates
To connect Klaviyo to Data Studio (formerly Looker Studio), start by visiting powermetrics.com and sign up with the same Google account you use for Data
Connect ActiveCampaign to Data Studio for free: tutorial and templates
To connect ActiveCampaign to Google Data Studio (formerly Looker Studio), visit Porter Metrics, start a free trial or use the free plan, and sign in
Connect LinkedIn Pages to Data Studio for free: tutorial and templates
To connect LinkedIn Pages to Google Data Studio (formerly Looker Studio), go to Porter Metrics, start a free trial or use the free forever plan,
Connect Instagram to Data Studio for free: tutorial and templates
To connect Instagram to Google Data Studio (formerly Looker Studio) with Porter Metrics, visit portermetrics.com, create a report and select Single data source, then choose
How to Connect Meta Ads to Data Studio for free: tutorial and templates
To connect Meta Ads to Google Data Studio (formerly Looker Studio), go to Create report (or to the Data Studio community connectors gallery), Select single
Modelo de relatório de Email marketing para agências e equipes de marketing
Analiza métricas clave como tasas de conversión y rebote con esta plantilla de informe de Email marketing. Rastrea campañas por nombre, tipo y duración. Consolida datos de Mailchimp, Klaviyo, ActiveCampaign y Hubspot. Segmenta por demografía y niveles de engagement. Ideal para equipos de marketing para medir el rendimiento y optimizar estrategias.
Modelo de relatório de Presentación de redes sociales para clientes para agências e equipes de marketing
Analiza métricas clave con esta plantilla de informe de presentación para clientes de redes sociales. Rastrea tasas de conversión, engagement e insights de audiencia de Instagram y Facebook. Segmenta datos por campaña, demografía y tiempo. Perfecto para agencias que desean presentar insights accionables y rendimiento, alineándose con objetivos y estrategias de marketing.
Modelo de relatório de KPIs de Instagram Insights para agências e equipes de marketing
Realiza un seguimiento de métricas clave con la plantilla de informe de KPIs de Instagram Insights. Analiza clics en el sitio web, visitas al perfil y engagement. Segmenta por campaña, ubicación y tiempo. Perfecto para que los marketers de redes sociales consoliden datos de Instagram Insights, optimizando la estrategia. Monitorea el rendimiento a través de demografías y objetivos para obtener insights accionables.

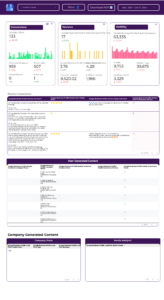
Modelo de relatório de Rendimiento de contenido para agências e equipes de marketing
Optimiza tu estrategia de redes sociales con la plantilla de informe de rendimiento de contenido. Rastrea las tasas de conversión, engagement y demografía de la audiencia utilizando datos de Google Analytics 4, Instagram Insights y Facebook Insights. Analiza métricas clave por campaña, duración y tiempo. Perfecto para que los equipos de marketing midan el rendimiento y logren objetivos de manera eficiente.
Modelo de relatório de Community manager para agências e equipes de marketing
Plantilla de informe de Social Media para community managers que rastrea métricas clave como la tasa de conversión, el costo por conversión y el engagement. Analiza dimensiones como la duración de la campaña, el presupuesto y la demografía de la audiencia. Monitorea los likes, shares y comentarios en las plataformas de Social Media. Ideal para community managers que buscan consolidar datos y refinar la estrategia de social media.
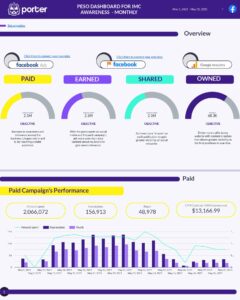
Modelo de relatório de Modelo Peso para agências e equipes de marketing
Analiza métricas clave como leads, tasas de conversión y engagement con la plantilla de informe del modelo Peso. Evalúa el rendimiento de las campañas en Facebook Ads, Instagram Insights y SEO. Segmenta por demografía de audiencia y periodos de tiempo. Perfecto para que los equipos de marketing rastreen estrategias de comercio electrónico y redes sociales de manera eficiente.
Modelo de relatório de Google Ads para agências e equipes de marketing
Optimiza tu estrategia de PPC con esta plantilla de informe de Google Ads. Rastrea la tasa de conversión, el costo por conversión y el CTR. Analiza por tipo de campaña, audiencia y tiempo. Perfecto para equipos de marketing para medir el rendimiento y alinearse con los objetivos. Consolida datos de Google Ads y Paid Media para obtener insights accionables y mejorar la gestión de campañas.
Modelo de relatório de Google Ads para agências e equipes de marketing
Optimiza tu estrategia de PPC con esta plantilla de informe de Google Ads. Rastrea métricas clave como la tasa de conversión, ROI y CTR. Analiza el rendimiento por tipo de campaña, objetivo y estado. Segmenta los datos por edad, género y ubicación. Ideal para que los equipos de marketing midan y refinen campañas de medios pagados de manera efectiva.
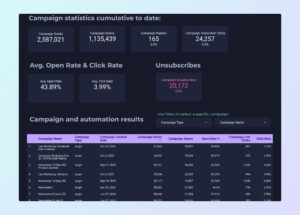
Modelo de relatório de Mailchimp para agências e equipes de marketing
Analiza métricas clave como la tasa de conversión, CTR y RPE con esta plantilla de informe de Mailchimp. Rastrea las tasas de apertura, tasas de clics y tendencias de engagement. Segmenta por campaña, audiencia y tipo de contenido. Ideal para equipos de email marketing para consolidar la estrategia y evaluar el rendimiento a lo largo del tiempo.
Modelo de relatório de Inbound marketing para agências e equipes de marketing
Optimiza tu estrategia con esta plantilla de informe de Inbound marketing. Rastrea KPIs como tasas de conversión y engagement en redes sociales. Analiza datos de CRM, E-commerce, Facebook Ads, Google Analytics 4 y LinkedIn Ads. Segmenta por demografía y periodos de tiempo. Ideal para equipos B2B y de e-commerce para medir el rendimiento y alcanzar objetivos de marketing.
Modelo de relatório de Investigación de palabras clave SEO para agências e equipes de marketing
Optimiza tu estrategia con la plantilla de informe de investigación de palabras clave SEO. Rastrea métricas como la tasa de conversión, el costo por adquisición y el tráfico de búsqueda orgánica. Analiza dimensiones como el volumen de búsqueda y la dificultad de palabras clave. Segmenta por demografía y tiempo. Ideal para equipos de marketing para medir el rendimiento y alcanzar objetivos específicos.
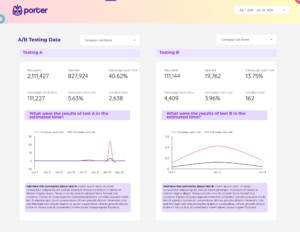
Modelo de relatório de Pruebas A/B para agências e equipes de marketing
Optimiza tus campañas con esta plantilla de informe de pruebas A/B. Mide las tasas de conversión, ROI y click-through rates. Analiza el público objetivo, demografía y mensajes de campaña. Consolida datos de Email Marketing y Copy para obtener insights accionables. Ideal para que los equipos de marketing rastreen el rendimiento y refinen estrategias.
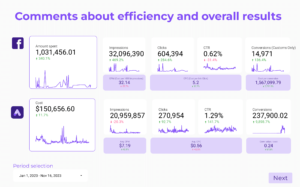
Google Business Profile Reviews dashboard example
Optimize your local SEO strategy with the Google Business Profile Reviews dashboard example. Track and measure key metrics from Google Business Profile. Analyze reviews for actionable insights. Ideal for marketing teams focused on improving local presence and achieving specific goals.
B2B KPI tracker dashboard example
Optimize your strategy with the B2B KPI tracker dashboard example. Track key metrics from HubSpot and other sources. Measure performance against goals. Analyze specific KPIs for actionable insights. Perfect for marketing teams and CMOs focused on enhancing B2B efforts.
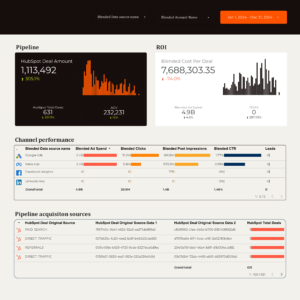
B2B dashboard example
This B2B dashboard example consolidates data from Hubspot, CRM, Facebook Ads, Google Ads, and LinkedIn Ads. Track PPC and SEO metrics. Designed for marketing teams to analyze performance and align strategies with objectives.
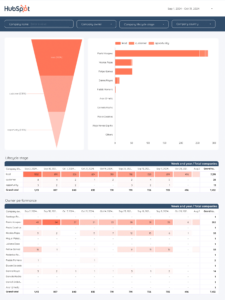
B2B Funnel dashboard example
Analyze key metrics with the B2B Funnel dashboard example. Consolidate data from Hubspot and Funnels to track performance. Designed for marketing teams to align strategy with goals. Offers actionable insights for CMOs to optimize B2B marketing strategies.
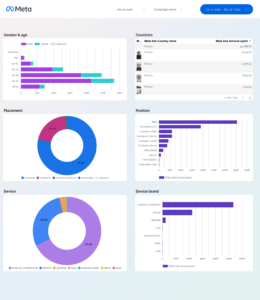
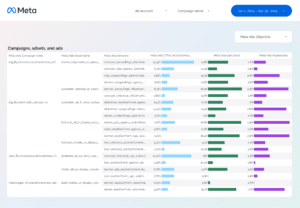
Meta Ads dashboard example
Meta Ads dashboard example: Track and measure key metrics from Facebook Ads and PPC. Analyze performance against goals. Unify data for actionable insights. Ideal for marketing teams to optimize strategy and monitor specific KPIs.
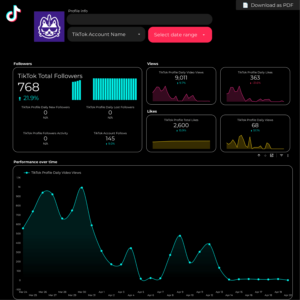
TikTok dashboard example
Monitor and measure key metrics with this TikTok dashboard example. Blend data from TikTok and Social Media to track performance and align with marketing goals. Perfect for marketing teams to analyze KPIs and optimize strategies.

Cross-channel dashboard example
Track KPIs with the Cross-channel dashboard example. Consolidate data from PPC, E-commerce, and B2B platforms. Analyze Facebook Ads, Google Ads, LinkedIn Ads, and TikTok Ads performance. Designed for marketing teams to measure goals and refine strategies efficiently.
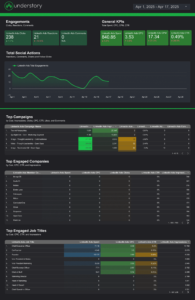
LinkedIn Ads dashboard example
Optimize your LinkedIn Ads strategy with this dashboard example. Track KPIs for B2B and SaaS lead generation. Analyze performance and consolidate data from LinkedIn Ads. Ideal for marketing teams focused on achieving specific goals and actionable insights.
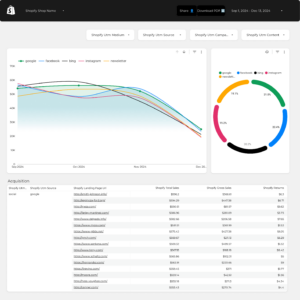
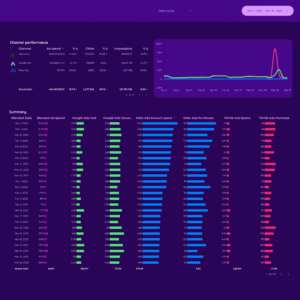
Shopify Attribution dashboard example
Shopify Attribution dashboard example: Track and measure key metrics across E-commerce and PPC channels. Analyze performance to meet objectives. Ideal for marketing teams to optimize attribution strategies and achieve specific goals. Consolidate data from Shopify and other sources for actionable insights.
Shopify KPIs dashboard example
Track key metrics with the Shopify KPIs dashboard example. Consolidate E-commerce data to analyze performance and meet goals. Designed for marketing teams to monitor specific KPIs and strategy effectively.

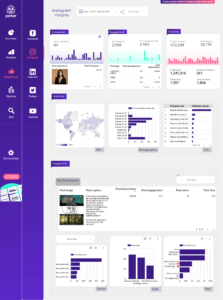
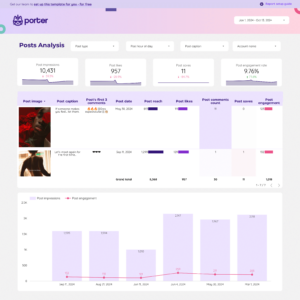
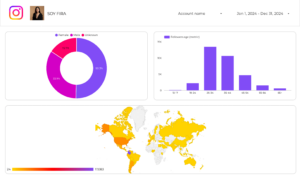
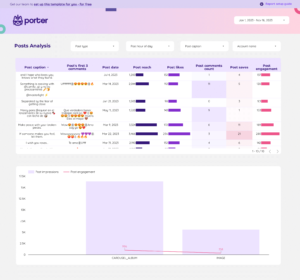
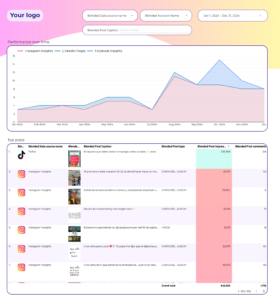
Instagram Insights Post performance dashboard example
Track key metrics with the Instagram Insights Post performance dashboard example. Analyze engagement, impressions, and audience interactions. Perfect for social media marketers to refine strategies. Consolidate data from Instagram Insights for actionable insights. Ideal for presenting results to your marketing team.
Instagram Insights Audience dashboard example
Instagram Insights Audience dashboard example: Track and measure key metrics to analyze audience performance. Consolidate data from Instagram Insights and Audience for specific KPIs. Ideal for marketing teams to optimize Instagram strategy and achieve goals.
Instagram Insights Followers tracking dashboard example
Monitor follower growth and engagement with the Instagram Insights Followers tracking dashboard example. Consolidate social media data to analyze key metrics and refine marketing strategies. Designed for marketing teams to track performance and achieve specific goals. Ideal for understanding audience trends and optimizing social media efforts.
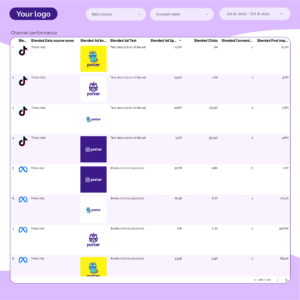
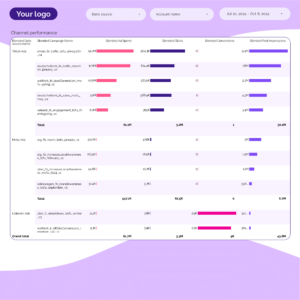
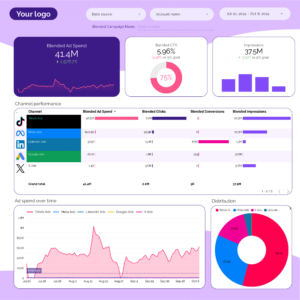
PPC Creative performance dashboard example
PPC Creative performance dashboard example: Analyze key metrics from TikTok, Facebook, Google, Twitter, and LinkedIn Ads. Designed for marketing teams to consolidate data and optimize strategies. Track and measure creative performance to achieve goals and enhance campaign effectiveness.
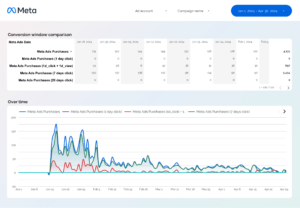
Facebook Ads Attribution dashboard example
Get the actual Facebook Ads Attribution on Looker Studio template used by Porter to monitor PPC performance.
AOV dashboard example
Analyze key metrics with the AOV dashboard example. Track conversion rates, average order value, and CPC. Integrate data from E-commerce, Google Analytics 4, Shopify, Google Ads, and Facebook Ads. Segment by audience, campaign, and time. Perfect for marketing teams to measure performance and refine strategies.

ROAS dashboard example
Optimize your PPC strategy with this PPC ROAS dashboard example. Track metrics like CTR, CPA, and conversion rate. Analyze ad placement, audience, and creative format. Integrate data from Facebook Ads and Paid Media. Segment by time and demographics for actionable insights. Ideal for marketing teams focused on performance.
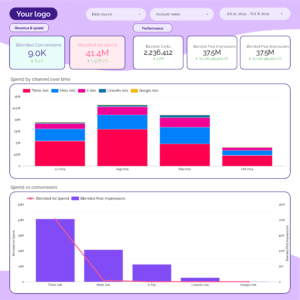
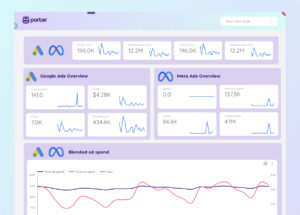
Marketing Ad spend dashboard example
Track key metrics with this Marketing Ad spend dashboard example. Measure conversion rate, ROI, and CTR across Facebook, TikTok, and Google Ads. Analyze performance by audience, platform, and time. Ideal for PPC specialists to optimize paid media strategies and achieve marketing objectives efficiently.
Instagram Insights Hashtags dashboard example
Analyze key metrics with the Instagram Insights Hashtags dashboard example. Measure conversion rates, social media reach, and brand mentions. Segment by audience, channel, and time. Perfect for marketing teams to optimize strategy and performance using data from Instagram Insights and social media.
Instagram Insights Reels dashboard example
Analyze key metrics with the Instagram Insights Reels dashboard example. Measure CTR, conversion rate, AOV, impressions, and reach. Segment by audience, media type, and objectives. View data by timeframes. Perfect for social media marketers to optimize strategy using Instagram Insights and social media analytics.
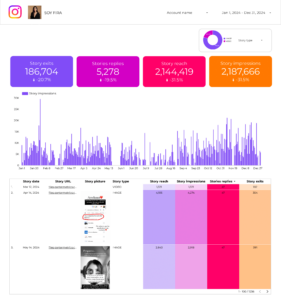
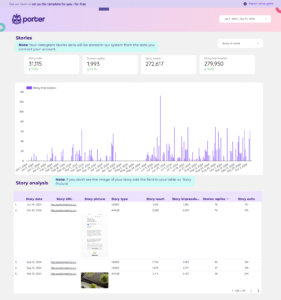
Instagram Insights Stories dashboard example
Instagram Insights Stories dashboard example: Analyze key metrics like conversion rate, CPA, AOV, likes, shares, comments, impressions, reach, and CTR. Segment by audience, media type, and time. Ideal for marketing teams to consolidate strategies and track performance using Instagram Insights and social media analytics.

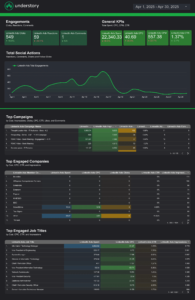
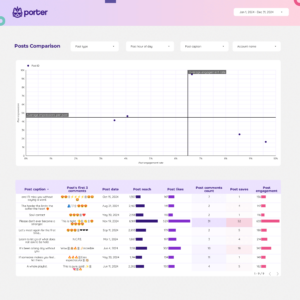
Social Media Post performance dashboard example
Track conversion rate, ROI, and CTR with this Social Media Post performance dashboard example. Segment by audience, platform, or campaign objective. Leverage data from Social Media and Instagram Insights to refine strategy. Ideal for marketing teams focused on maximizing engagement and reach.
Engagement rate dashboard example
Engagement rate dashboard example tracks key metrics like CTR, conversion rate, and CPA across Instagram Insights and LinkedIn Pages. Analyze performance by time, channel, and audience demographics. Ideal for marketing teams to measure strategy effectiveness and optimize campaigns.
Social Media Engagement dashboard example
Analyze key metrics like CTR, ROI, and conversion rates with this Social Media Engagement dashboard example. Leverage data from Social Media and Instagram Insights to optimize performance. Ideal for marketers to track audience segmentation, channel selection, and message personalization, enhancing strategy across demographics and timeframes. Perfect for understanding engagement trends and improving marketing efforts.
Social Media Followers tracking dashboard example
Track key metrics like conversion rate, cost per conversion, and engagement rate with the Social Media Followers tracking dashboard example. Analyze audience breakdowns and campaign objectives across platforms. Utilize data from Social Media and Instagram Insights to optimize strategy. Perfect for marketing teams to measure performance and achieve specific goals.
Paid media E-commerce dashboard example
Analyze key metrics such as cost per conversion, ROAS, and CTR with the Paid media E-commerce dashboard example. Integrate data from Google Analytics 4, Shopify, Google Ads, and Facebook Ads. Segment by audience, ad placement, and time. Perfect for marketing teams to track performance and refine strategies.
Facebook Ads budget tracking and pacing dashboard example
Monitor key metrics with the Facebook Ads budget tracking and pacing dashboard example. Analyze CTR, conversion rates, and cost per conversion. Segment by audience, ad placement, and timing. Optimize budget allocation across demographics and timeframes. Perfect for PPC specialists to enhance Facebook Ads performance and achieve marketing objectives.
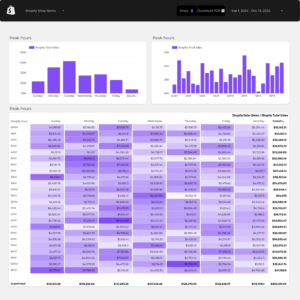
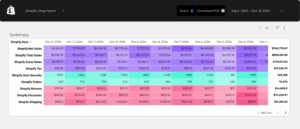
Shopify Store performance dashboard example
Store performance dashboard example: Analyze total revenue, conversion rates, and traffic sources. Segment by audience targeting, marketing channels, and campaign objectives. Integrate data from E-commerce, Google Analytics 4, Shopify, Google Ads, Facebook Ads, and SEO. Perfect for marketing teams to track KPIs and optimize strategies efficiently.
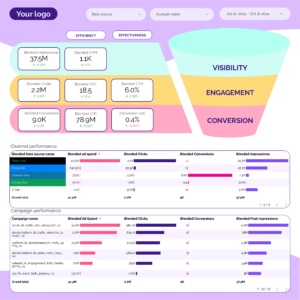
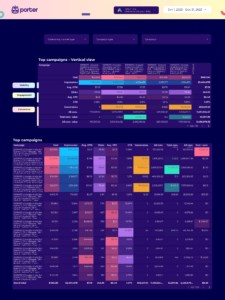
Paid media Client presentation dashboard example
Optimize your strategy with the Paid media Client presentation dashboard example. Track metrics like conversion rate, CPA, ROI, and CTR. Analyze by audience, channel, and KPIs. Segment by age, gender, and location. Perfect for marketing teams using Paid Media and Facebook Ads to achieve goals.
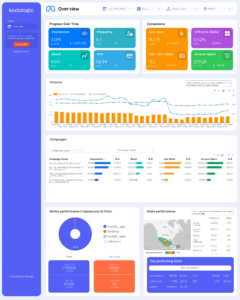
Multi-channel Marketing performance dashboard example
Analyze key metrics such as CTR, ROI, and engagement with the Multi-channel Marketing performance dashboard example. Blend data from SEO, Google Analytics 4, Facebook Ads, Instagram Insights, and more. Segment by demographics and timeframes. Perfect for marketing teams to track performance and refine strategies across multiple channels.
Facebook Ads + Google Ads dashboard example
Track and analyze key metrics with the Facebook Ads + Google Ads dashboard example. Measure conversion rates, ROI, and CTR. Understand audience demographics and behavior. Monitor campaign performance by hour, day, or month. Ideal for marketing teams to consolidate insights and achieve specific goals across paid media platforms.
SEM dashboard example
Optimize your SEM strategy with this dashboard example. Track cost per conversion, conversion rate, and ROAS. Measure click-through rate, social media engagement, and organic search ranking. Segment by audience, content, platform, and more. Perfect for PPC specialists to enhance Google Ads and Paid Media performance.
Lead generation dashboard example
Optimize your strategy with this lead generation dashboard example. Track conversion rates, cost per conversion, and ROI. Analyze B2B, CRM, Email Marketing, and Facebook Ads data. Segment by audience, demographics, and behavior. Measure sales qualified leads and CRM contact performance. Ideal for marketing teams seeking actionable insights and improved campaign performance.
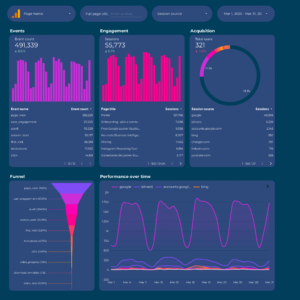
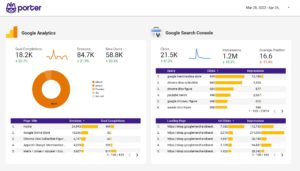
Google Analytics 4 dashboard example
Optimize your e-commerce strategy with this Google Analytics 4 dashboard example. Track conversion metrics, session duration, and bounce rate. Analyze impressions, CTR, and average position. Segment by campaign, age, gender, and device. View data by time intervals. Perfect for marketing teams to measure website performance and achieve specific objectives.
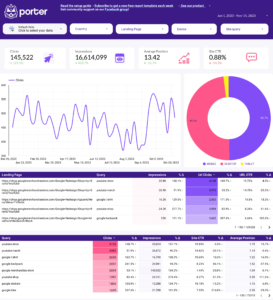
SEO dashboard example
This SEO dashboard example tracks key metrics like conversion rate, ROI, and CTR. Analyze organic search traffic and keyword rankings. Segment by audience, channel, or time. Integrate data from Google Search Console and content marketing. Ideal for marketing teams to measure performance and achieve specific goals.
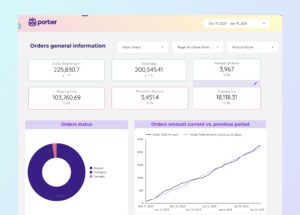
Sales dashboard example
This Sales dashboard example tracks key metrics like conversion rate, cost per conversion, and average order value. Analyze geographical, time, and demographic breakdowns. Ideal for E-commerce and B2B marketing teams to measure performance and achieve objectives efficiently.
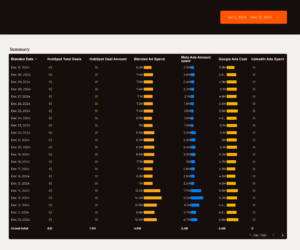
ActiveCampaign dashboard example
ActiveCampaign dashboard example: Track KPIs like click-through rate, conversion rate, and ROI. Analyze metrics such as customer acquisition cost and average order value. Segment by audience, campaign goals, and timeline. Perfect for B2B, CRM, and email marketing teams aiming for actionable insights through automation.
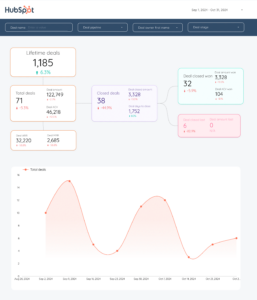
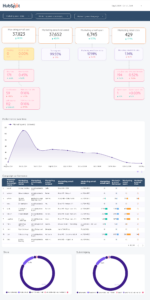
HubSpot dashboard example
Optimize B2B marketing with this HubSpot dashboard example. Track conversion rates, ROI, and average deal size. Analyze CRM contacts and campaign performance by demographic and psychographic dimensions. Ideal for inbound marketing teams to measure and refine email marketing and funnel strategies across different timeframes.
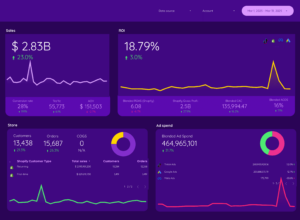
E-commerce dashboard example
This E-commerce dashboard example tracks key metrics like conversion rate, average order value, and CPA. Analyze by audience, channel, and time. Integrate data from E-commerce, Paid Media, and SEO. Ideal for marketing teams to measure performance and refine strategies effectively.
Amazon Seller Central dashboard example
Analyze key metrics with this Amazon Seller Central dashboard example. Monitor GMV, AOV, and CPA. Segment by demographics, ad format, and time. Perfect for e-commerce marketing teams to consolidate data from Amazon Seller Central, optimizing performance. Measure success across platforms and refine strategies for targeted audiences.
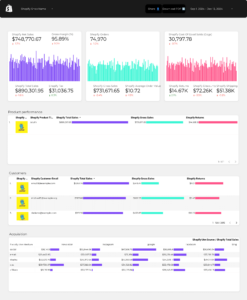
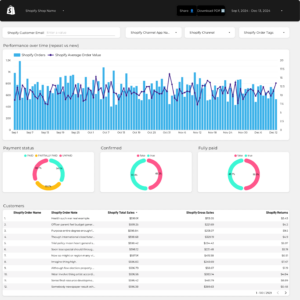
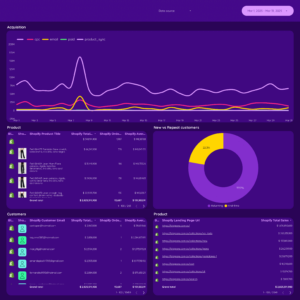
Shopify dashboard example
Analyze key metrics like revenue, average order value, and conversion rate with this Shopify dashboard example. Track dimensions such as target audience and advertising channels. Segment data by time periods. Ideal for e-commerce marketing teams to consolidate insights and optimize strategies, enhancing Shopify store performance and achieving business goals.
Google Business Profile dashboard example
Google Business Profile dashboard example: Analyze CTR, conversion rate, CAC, clicks, and impressions. Segment by location, age, gender, and time. Perfect for local SEO strategies, it empowers marketing teams to consolidate performance insights and meet specific goals.