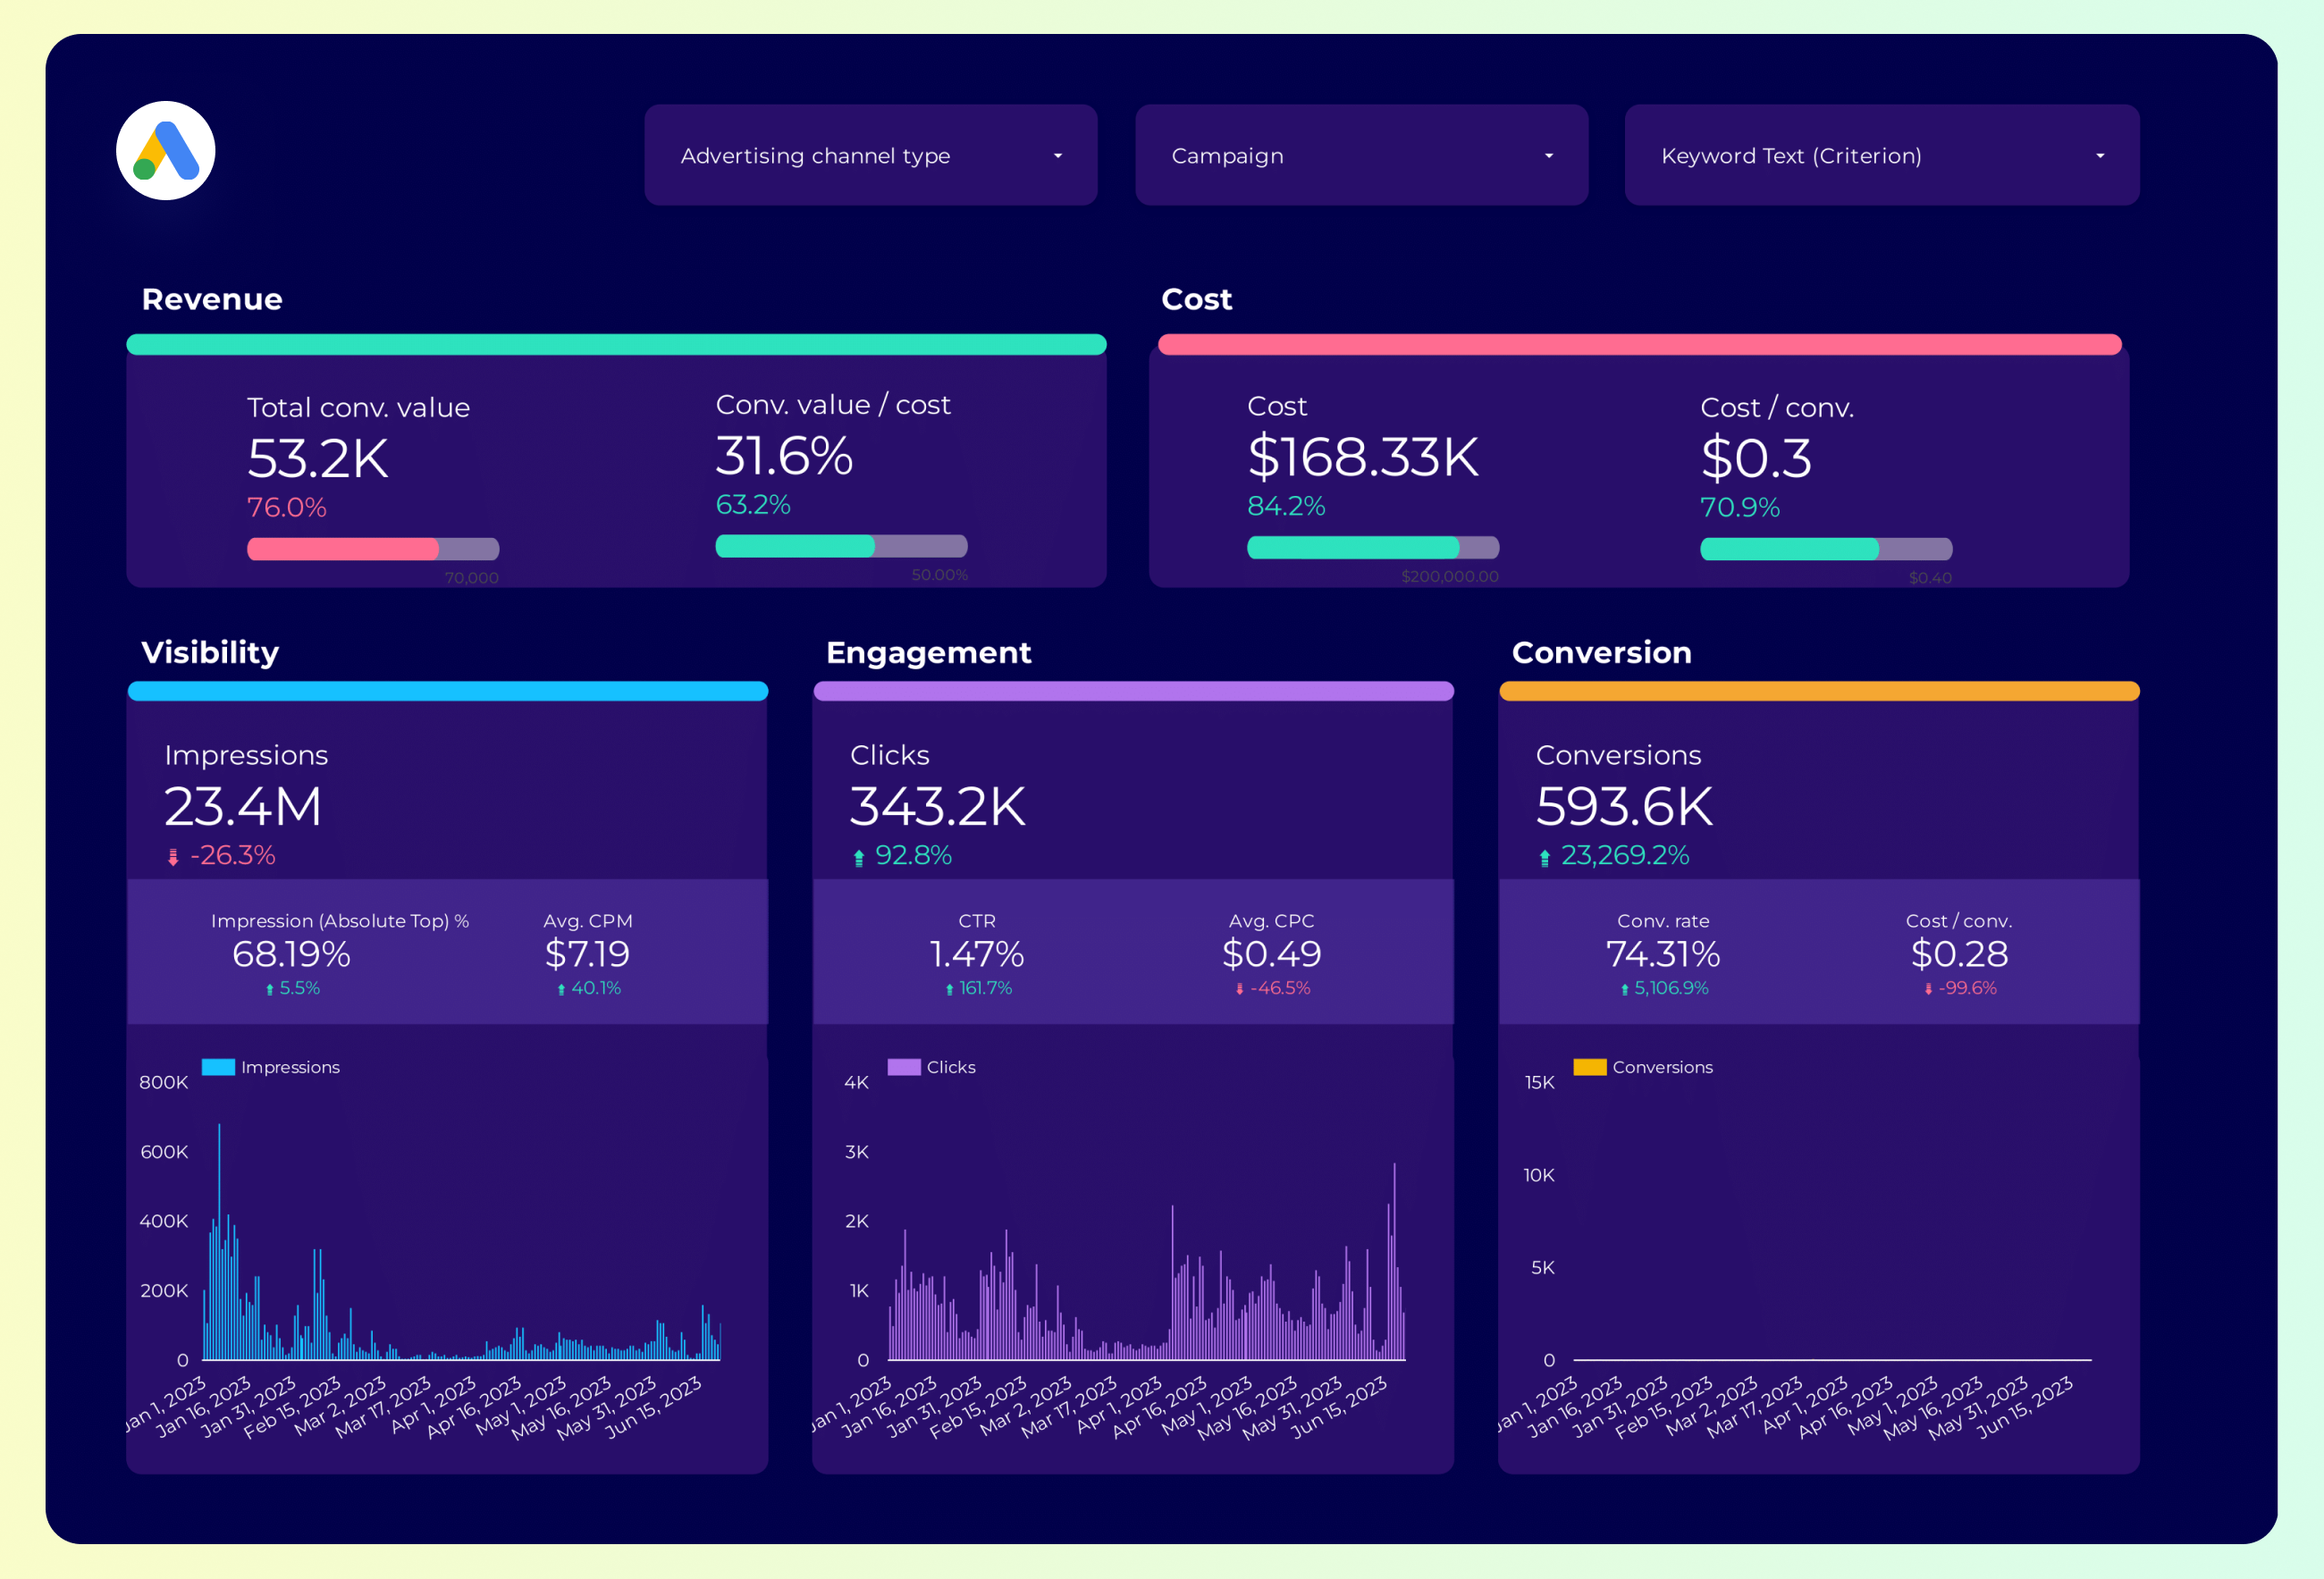
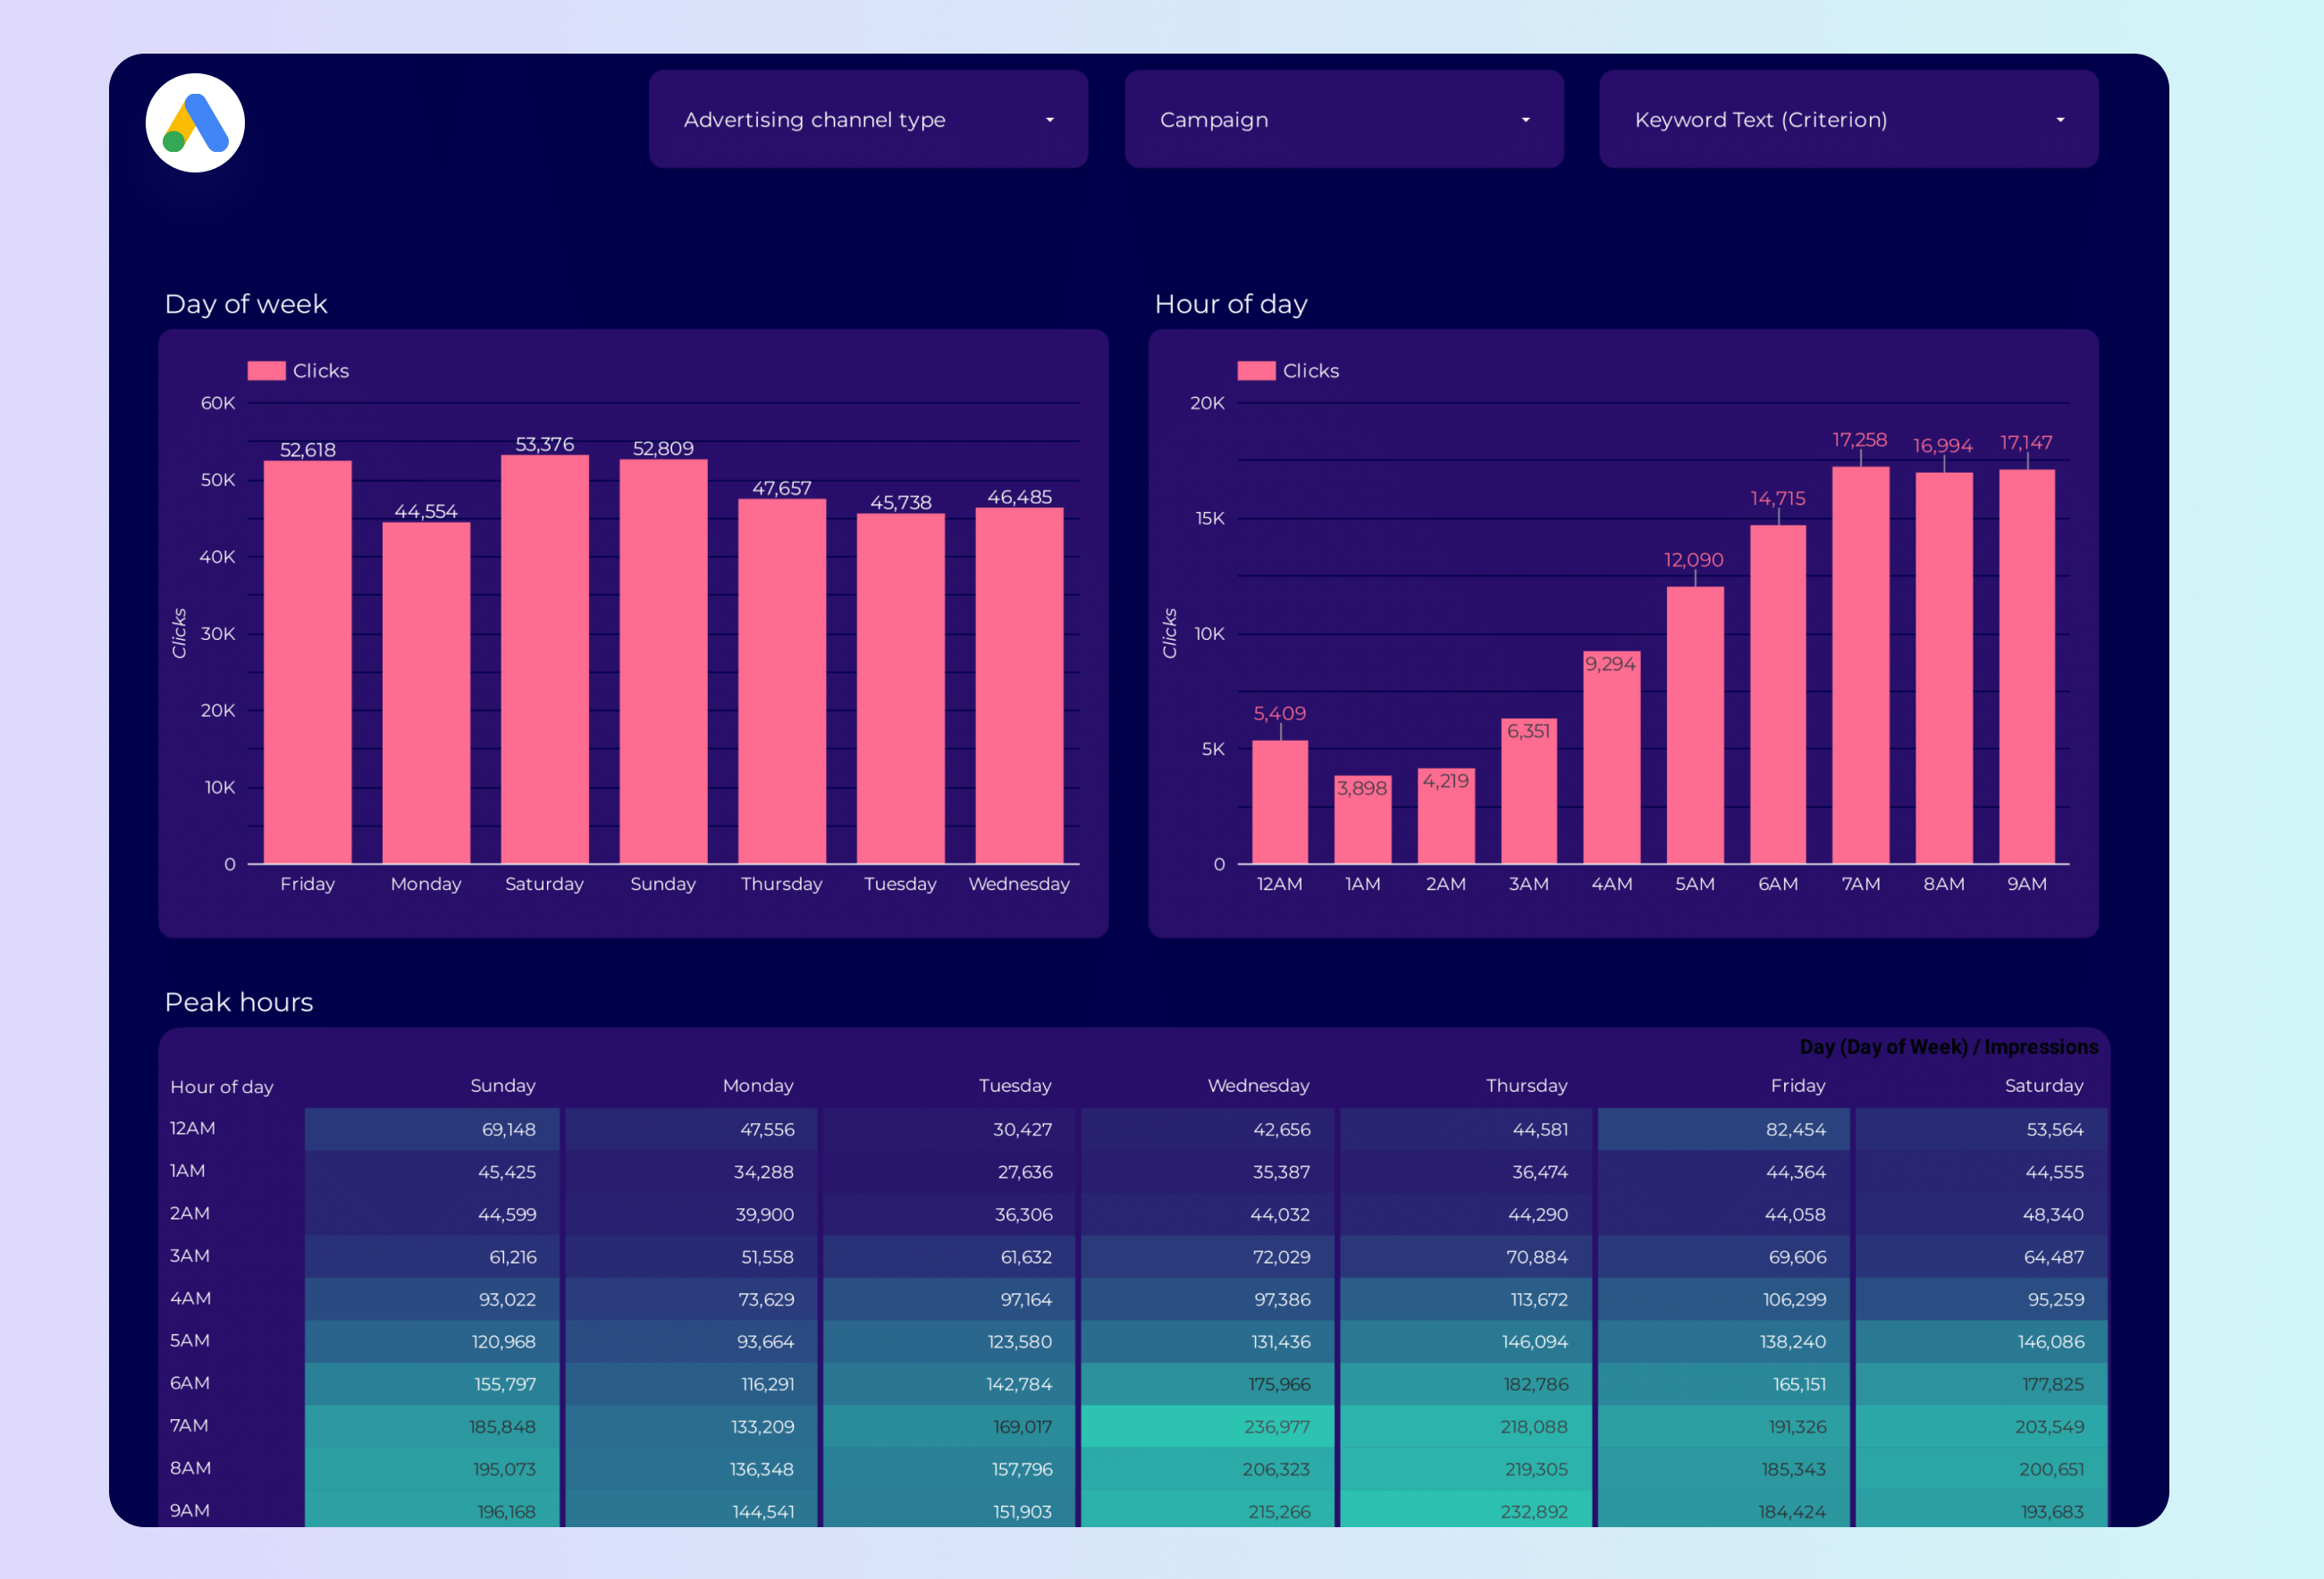
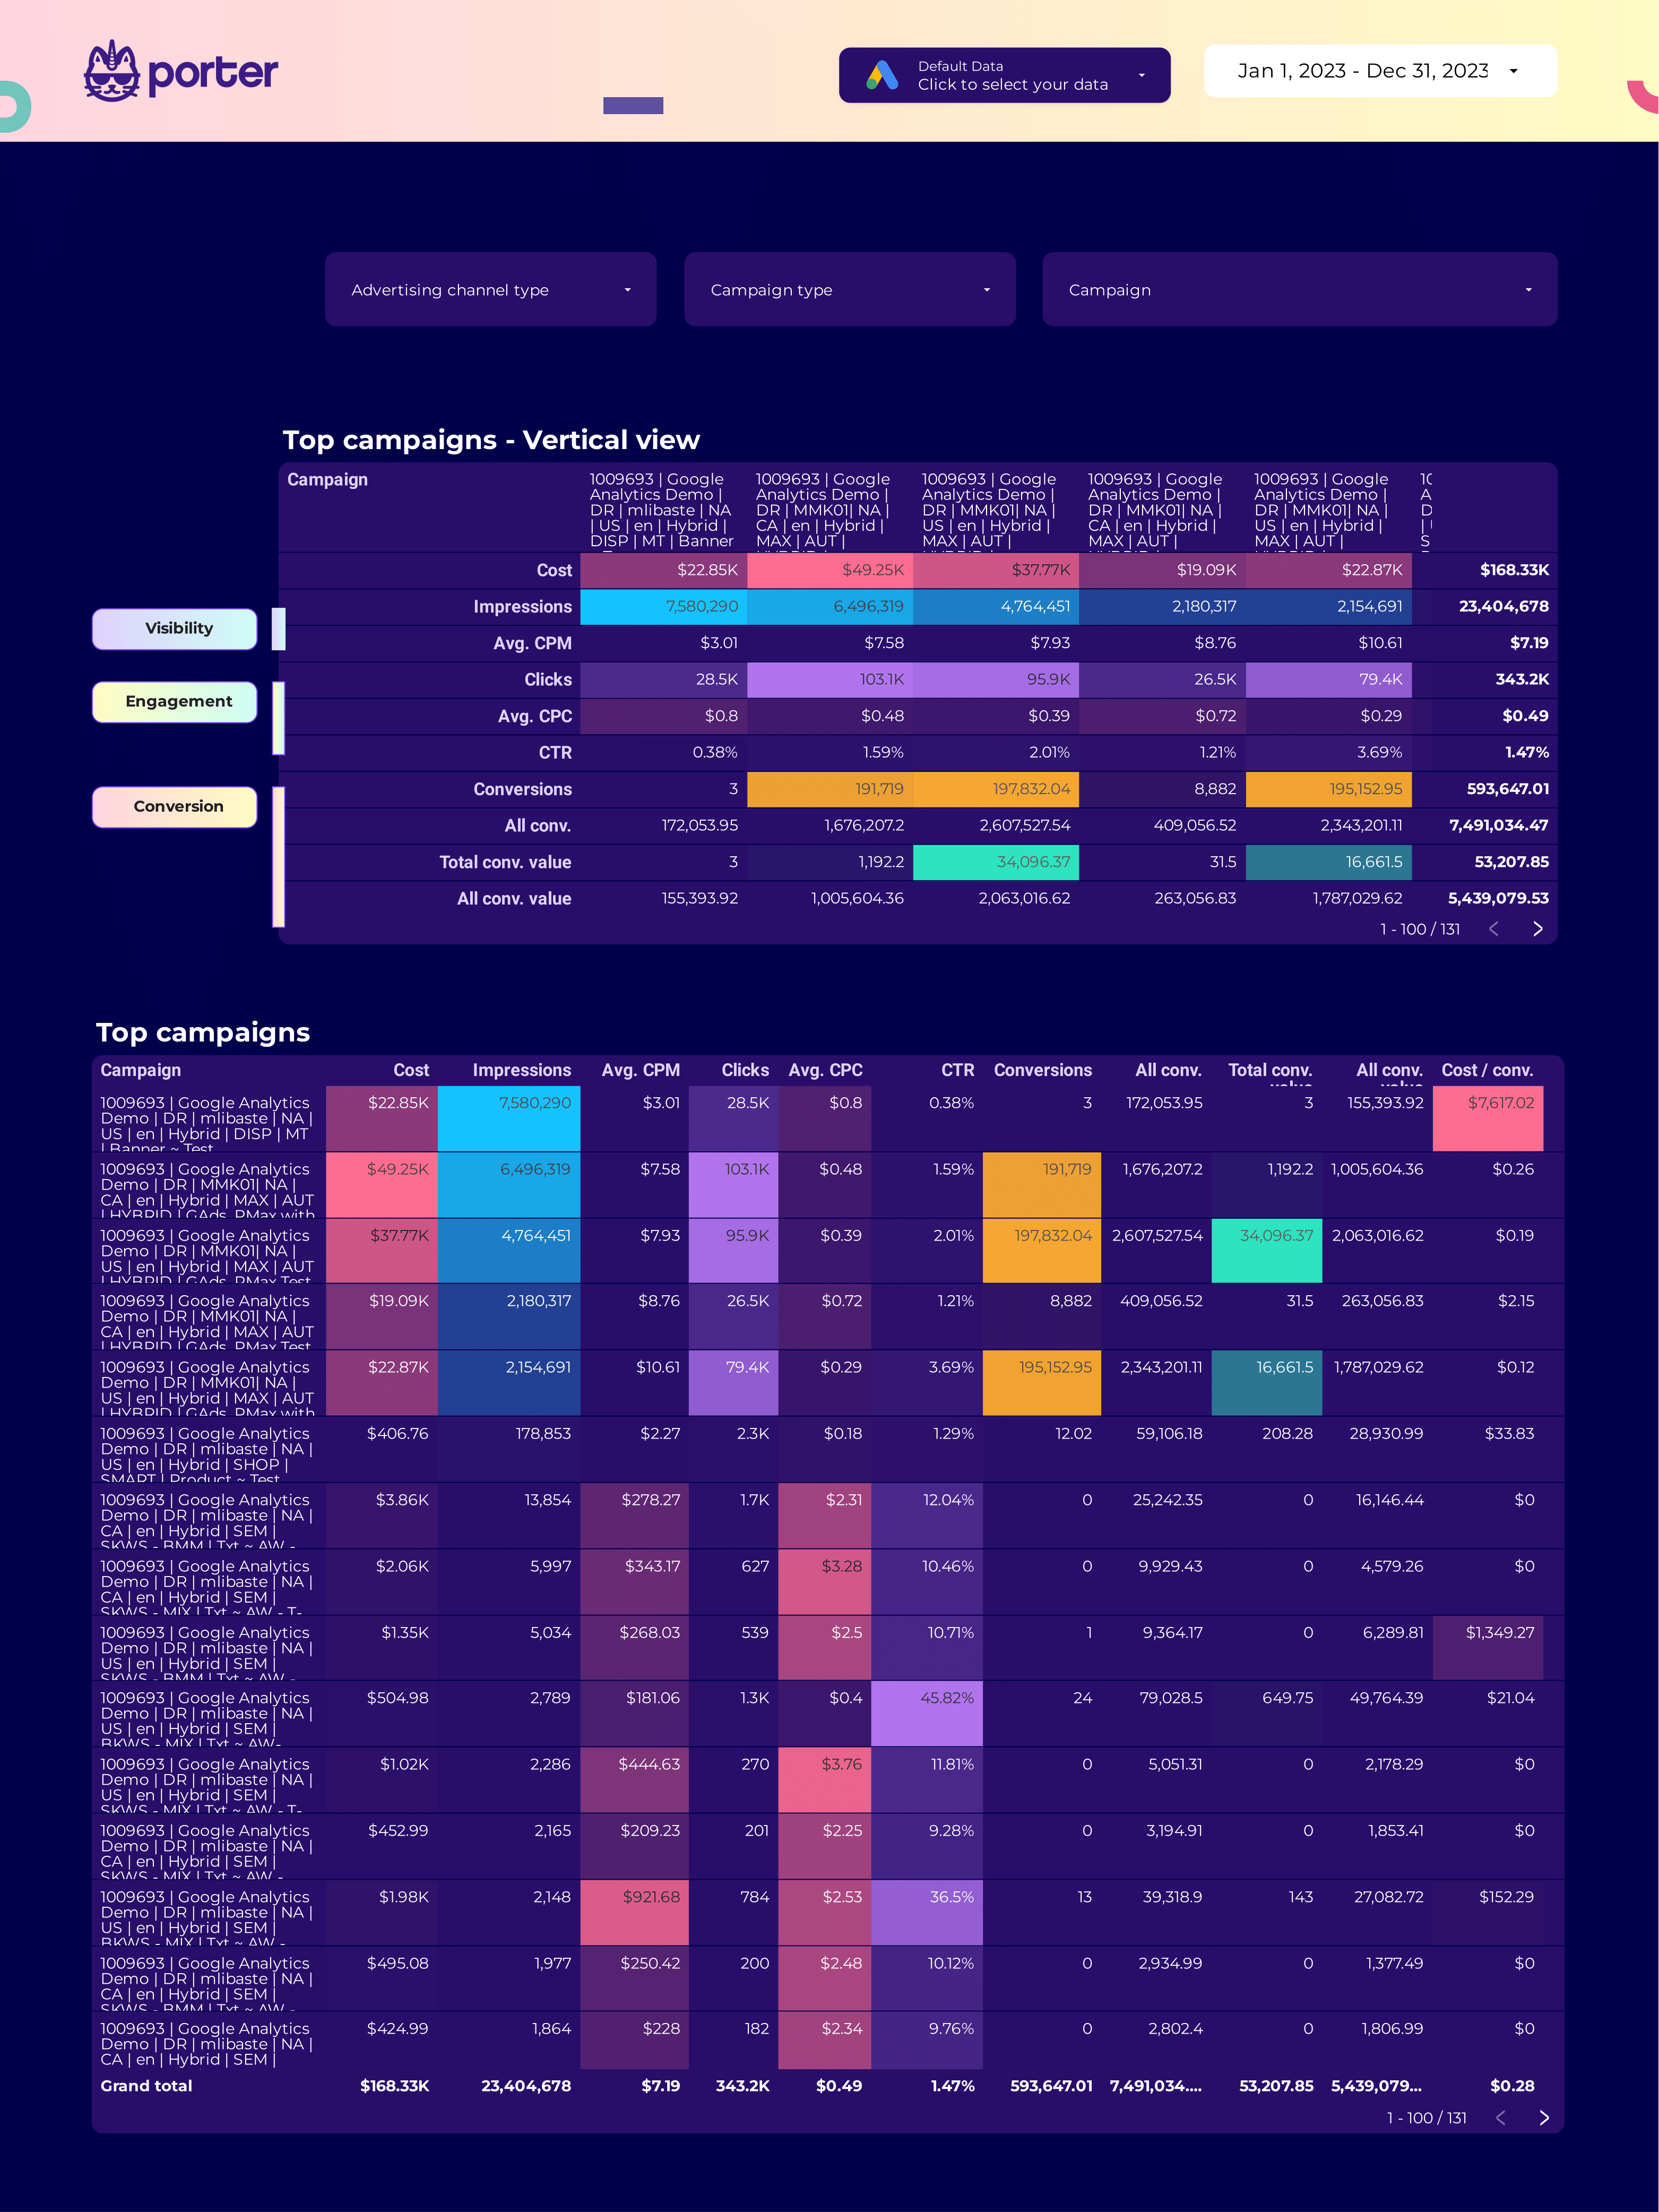
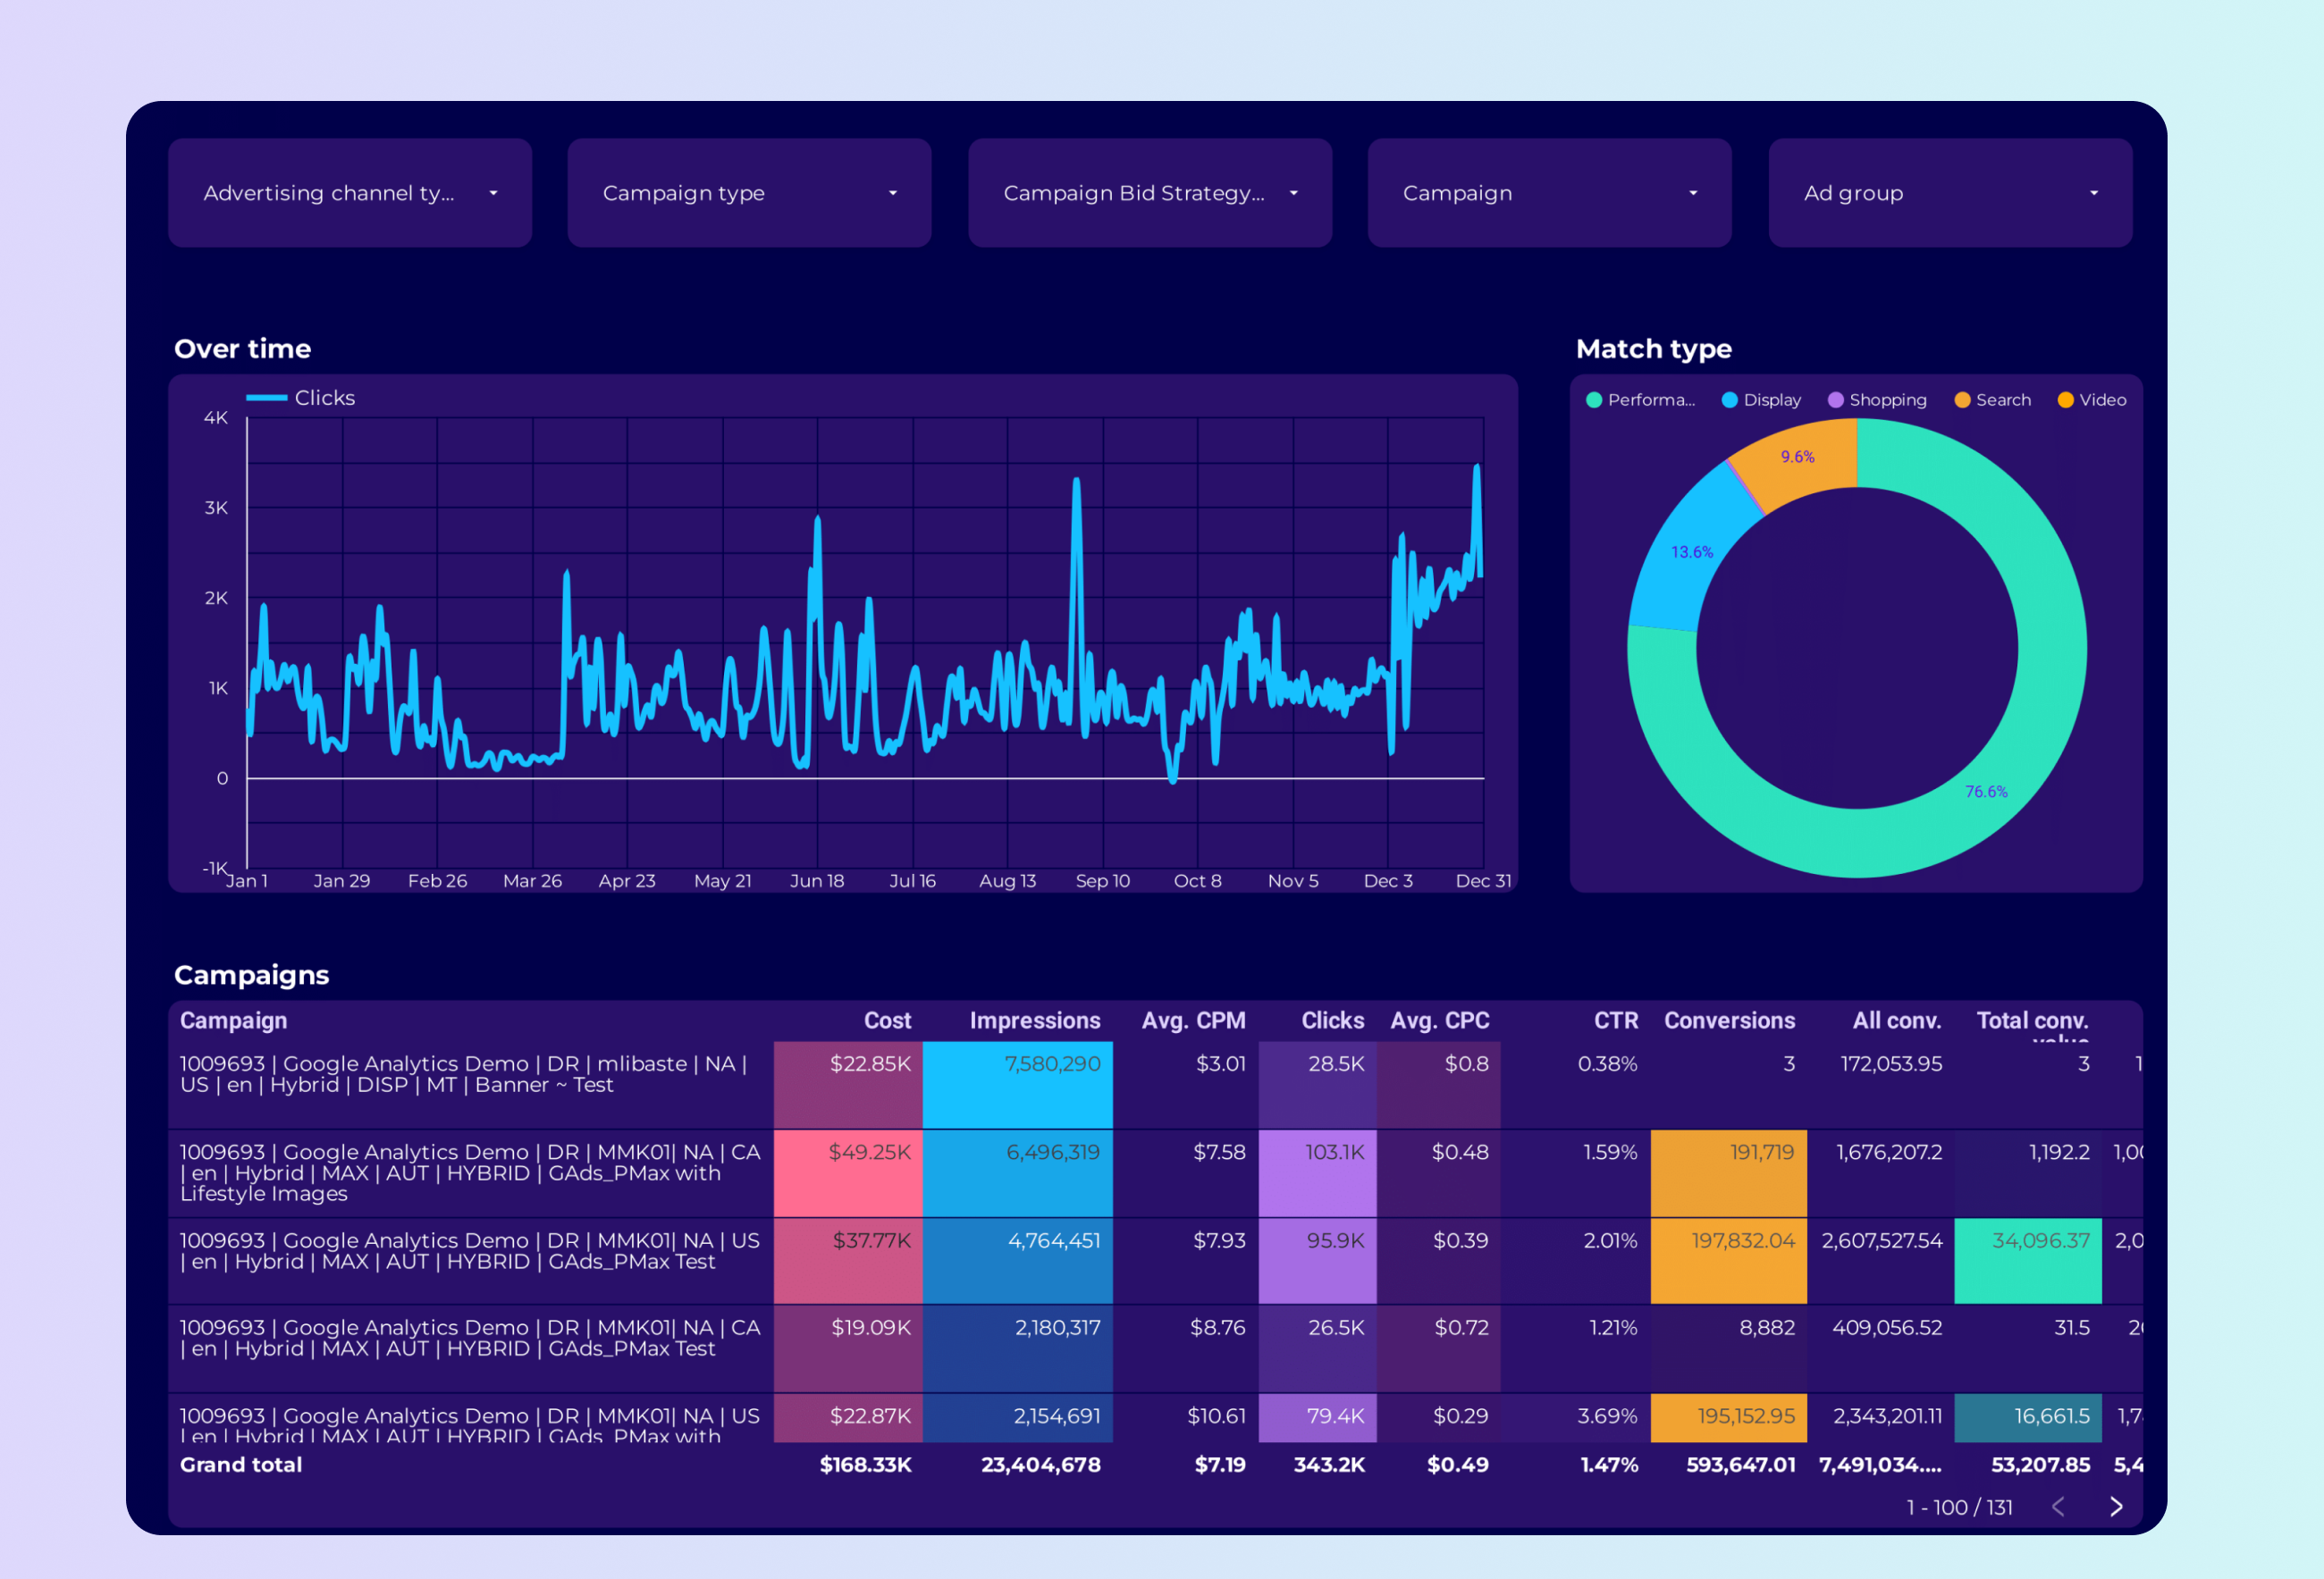
Google Ads Peak Hours Report
Visualize performance by hour/day to spot peak conversion times.
View Template

Visualize performance by hour/day to spot peak conversion times.
View Template
Monitor spend, conversions, and ROAS across Google/Bing.
View Template
Break down asset groups, audiences, and conversions.
View Template
Review search terms, match types, cost, and conversions.
View Template
Follow users from impressions to conversions to find drop-offs.
View Template
Segment results by audience, demographics, location, and device.
View Template
Track spend, clicks, conversions, and ROAS with filters.
View Template
Porter✓ No-code marketing data warehouse |
Others✓ Connectors & ETL |
|
|---|---|---|
| Storage | Built-in, self-managed BigQuery with automated transformations, transfers, queries, and costs included. | Requires setting up your own BigQuery project, managing tables, transfers, and costs. |
| Data syncing | Switch between stored BigQuery and real-time API data in the same connection. | Either stored (manual BigQuery setup) or real-time, not both. |
| Data blending | Blend Google Ads campaigns, keywords, and ad groups—see cross-campaign ROAS, CPA, and conversion trends instantly. | Manual table selection, field mapping, and join setup. |
| Destinations | Looker Studio + Google Sheets in one subscription. | Separate price per destination. |
Step 1: Choose the Google Ads integration on portermetrics.com
Step 2: Log in with your Google account and start a free trial or use the free plan
Step 3: Click Add Account and connect your Google Ads profile, reauthorizing if needed
Step 4: Select your connected profile and choose one or multiple Google Ads accounts
Step 5: Click Create Report to load your Google Ads dashboard in Looker Studio and save it
Full tutorial: How to connect Google Ads to Google Looker Studio
Access every field available in Google Ads—over 900 in total—including calculated metrics like Quality Score, conversion rate, and impression share, plus custom fields not shown in the native UI.
Retrieve every conversion and performance metric with full aggregation: unique, device, network, and account-level. For example: conversions, view-throughs, cross-device, and assisted conversions.
Compare every attribution model supported by Google Ads—last click, data-driven, position-based, time decay, linear—side by side in one dashboard to see how conversions and ROAS shift.
Along with performance, Porter retrieves ad previews and creative assets (headlines, descriptions, images, videos, URLs) so you can connect reporting directly with creative and policy analysis.
Fields are named exactly as in Google Ads, so campaigns, ad groups, ads, and keywords are instantly familiar. Porter also standardizes them for blending with GA4, Meta, and CRM data.
Segment data by campaign, ad group, ad, keyword, device, audience, location, network, hour, date, week, and every other breakdown supported by Google Ads for granular analysis.
Billed annually
Avg. price per account: $12.5/mo ↓
Start 14-day free trial