



 Claude

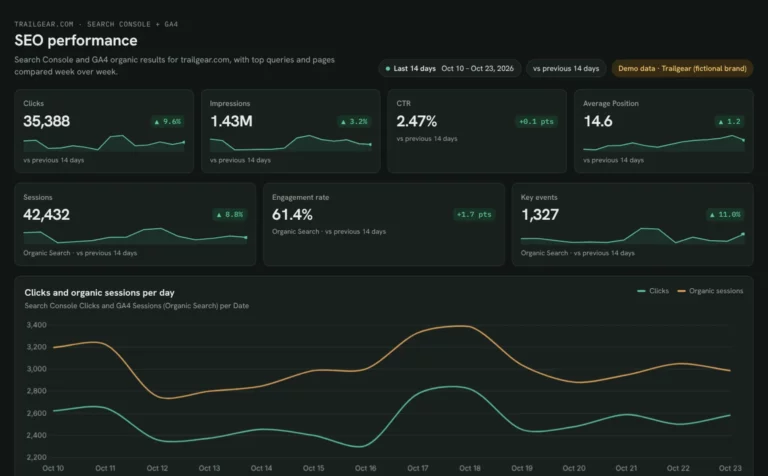
 SEO dashboardSee which Search Console clicks turn into GA4 sessions and key events.Open live demo
Connect GA4, Search Console, Google Ads and more in Porter, then ask Claude or ChatGPT for an AI dashboard and get a live one, on your own numbers, in minutes.
Sources: GA4, Search Console, Business Profile, Google Ads, Meta Ads, Shopify, HubSpot and 20+ more. You get: KPI cards, trends and tables in Claude, ChatGPT or a Porter dashboard you share by link.


 By Juan BelloLast updated October 30, 2026 · See pricing


Each example is a live dashboard that Claude built from one Porter prompt, while the numbers are demo data from a fictional outdoor brand. Open a demo, then its template page for the prompt to run on your own accounts. All 8 cover SEO and local search for now.
8 examples
ClaudeSEO dashboardSee which Search Console clicks turn into GA4 sessions and key events.Open live demo 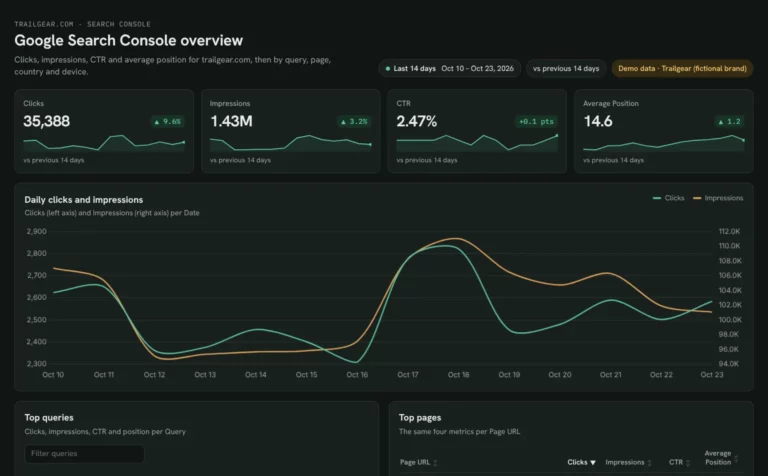 ClaudeGoogle Search Console dashboardFind queries close to page one and fix low CTR by page and device.Open live demo
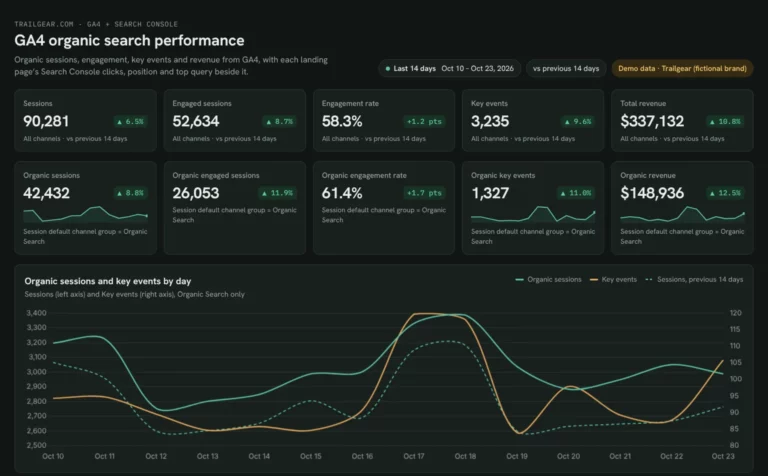 ClaudeGA4 SEO dashboardSee which landing pages bring organic sessions and key events.Open live demo
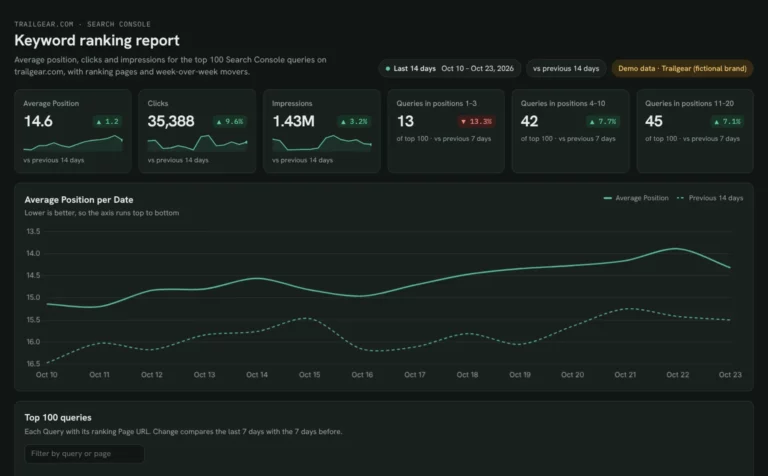 ClaudeKeyword ranking dashboardTrack which keywords reach page one and what moved this week.Open live demo
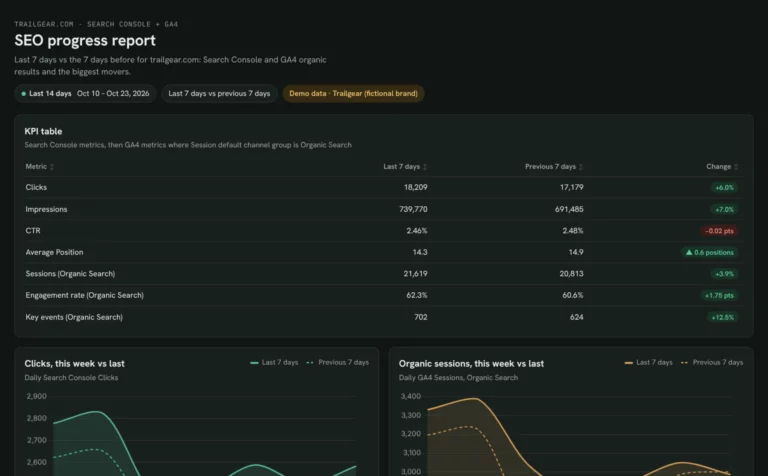 ClaudeMonthly SEO dashboardShow month-on-month SEO results and the pages that moved them.Open live demo
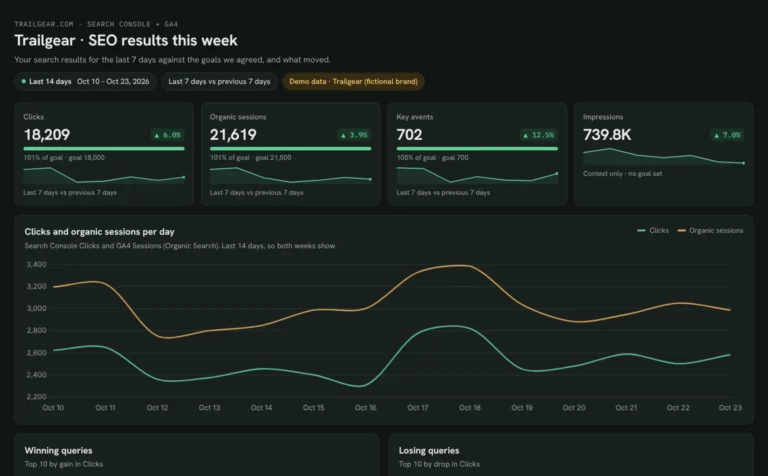 ClaudeClient SEO dashboardReport clicks, sessions and key events against each client’s goals.Open live demo
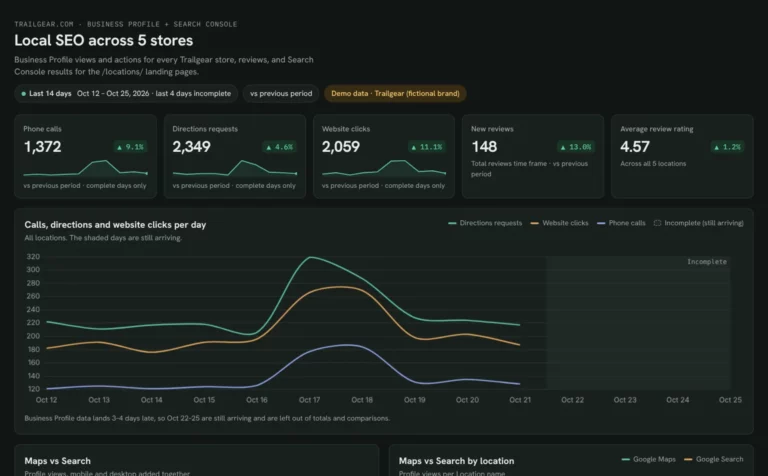 Claude
 Local SEO dashboardCompare calls, directions and website clicks for every location.Open live demo
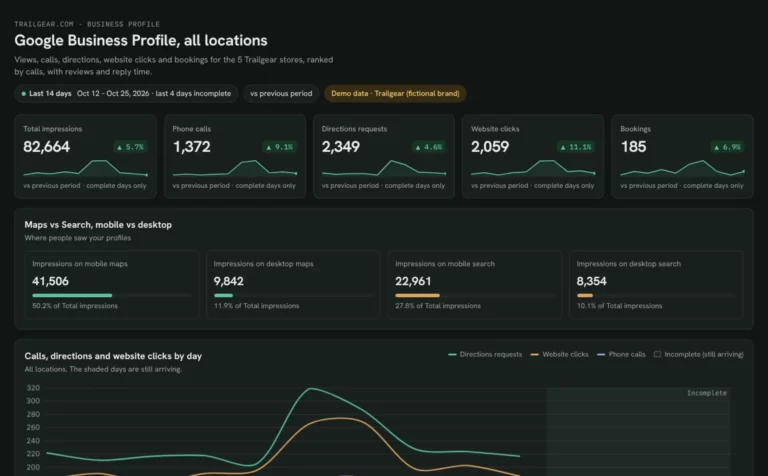 ClaudeGoogle Business Profile dashboardSee Maps and Search views, calls and reviews for each location.Open live demo
An AI dashboard is a page of KPI cards, trends and tables that an AI assistant builds when you ask for one in plain language. To build one on marketing data, connect your accounts in Porter, then add Porter to Claude or ChatGPT and paste a prompt. After that, the assistant queries your data and lays out the dashboard.
After you sign up, connect GA4, Search Console, Google Ads, Meta Ads or any other source. Also, every account you connect works in Claude and ChatGPT, with no second setup.
In Claude, open Customize › Connectors › Add custom connector, paste https://mcp.portermetrics.com/mcp, then sign in to Porter and allow access. In ChatGPT, open + › More › Add sources and connect the Porter Metrics app. Both have step-by-step guides: Porter for Claude and Porter for ChatGPT.
Copy a prompt from the examples above, paste it into a new chat and replace [site] with your site. Then the assistant reads your data through Porter and builds the dashboard.
What you need
Watch the build · 8:12 · Build a Google Search Console dashboard with Claude · Porter Metrics on YouTube ↗
In the video
Because both assistants read the same Porter connection, the choice comes down to where the dashboard should live and who needs to see it. Claude has a Dashboards feature with charts that refresh on request, while in ChatGPT the dashboard is built inside the chat.
| Question | Claude |  ChatGPT |
|---|---|---|
| Where the dashboard lives | Claude Dashboards (beta), saved with your other artifacts | Charts, tables and a summary inside the chat |
| Plan needed | Pro, Max, Team or Enterprise for Dashboards, although Porter connects on every Claude plan | A paid plan: Plus, Pro, Business or Enterprise |
| Refresh | Claude pulls fresh numbers from Porter when you ask it to update, and each chart shows when it was refreshed | When you ask again, ChatGPT runs a new query through Porter |
| Sharing | Each viewer needs their own Claude and their own data connection. Otherwise, publish it as a Porter dashboard for people without Claude | Not tested by Porter yet |
| How to add Porter | Customize › Connectors › Add custom connector, then paste Porter’s MCP URL | + › More › Add sources › Porter Metrics › Connect |
| Porter’s 8 example prompts | Tested | Not tested yet |
Checked October 28, 2026 against Anthropic’s guide to Claude Dashboards, Anthropic’s guide to sharing artifacts and Porter’s ChatGPT tutorial.
An AI dashboard is only useful when its numbers match the source. Before you share one, run four quick checks. These checks catch the usual mistakes before a client does.
Before anything else, ask the assistant which source, fields, filters and dates each chart uses. Also, in Claude Dashboards each chart shows the query that produced it (Anthropic).
Open Search Console, GA4 or the ad platform for the same dates and check one total, such as clicks or sessions. When the gap is big, it points to a filter or the wrong account.
“Last 7 days” can end today or yesterday, and each platform reports in its own account time zone. So ask the assistant to state both.
Google Ads conversions, Meta Ads results and GA4 key events count different things, so keep them in separate columns rather than adding them up.
Porter’s limits: reporting is read-only, each query returns up to 1,000 rows, and some platforms report with up to a 48-hour delay. Also, Search Console days fill in over 2 to 3 days.
A good AI marketing dashboard answers one question for one reader, on data that keeps updating. Every example above has these six parts, so they also make a fair test for any tool.
Live connectors
Data comes from GA4, Search Console or the ad platform through their APIs, instead of a CSV export that goes stale.
KPI cards with the change
Three to five numbers, each compared with the previous period or a goal, so changes stand out.
A trend
Daily or weekly lines, so a drop shows when it started.
A top-items table
Top pages, queries or campaigns, with the change next to each one.
One breakdown
A split by device, country, channel or location, because a total alone hides where a change came from.
An “explain this change” prompt
A follow-up question the reader can ask, so the dashboard leads to the next step.
Most AI dashboard tools fall into four types, and they differ in where the data comes from, how it refreshes and where the dashboard lives. So the right one depends more on your data than on the AI model.
| Type | Data | Refresh | Where it lives | Best for |
|---|---|---|---|---|
| File-upload generators | CSV, Excel or Sheets files you upload | When you upload a new file | The generator’s own app | One-off charts from a spreadsheet |
| BI tools with AI | Company databases and warehouses | Scheduled, set up by a data team | The BI tool | Teams with an analyst and a warehouse |
| Reporting apps with AI | Marketing platforms, through the app’s connectors | Scheduled in the app | The reporting app | Agencies happy to work in one more app |
| Connectors into your AI assistant (Porter) | Marketing platforms, through live connectors | Whenever you ask | Claude, ChatGPT or a shared Porter dashboard | Teams that already use Claude or ChatGPT |
AI report generators are close cousins: they write a fixed report for one period, often as a document or slides, while an AI dashboard stays live and can be filtered.
ChatGPT, Claude, cost, refresh, safety and reports.
Yes, with Porter connected, ChatGPT pulls live numbers from your marketing accounts and turns them into charts, tables and a summary in the chat. However, connectors need a paid ChatGPT plan: Plus, Pro, Business or Enterprise. Porter hasn’t tested its 8 example prompts in ChatGPT yet, so check the numbers on your first one.
Yes, Claude Dashboards, in beta on the Pro, Max, Team and Enterprise plans, builds a dashboard as an artifact and refreshes it from Porter when you ask. Also, each of Porter’s Claude dashboard templates comes with a demo and a tested prompt.
Porter’s Free plan never expires and needs no card: unlimited connected accounts, up to 30 days of history, and 15 days in AI chats. After a 14-day trial with full access, paid plans start at $12.50 per account a month billed annually (Porter pricing). Your Claude or ChatGPT plan, however, is billed separately.
Not on its own schedule: in Claude, the dashboard pulls fresh numbers from Porter when you ask it to update, and each chart shows when it was refreshed. In ChatGPT, similarly, you ask again in the chat. So for viewers without an AI tool, publish it as a Porter dashboard, which keeps updating.
Porter’s reporting tools, the ones dashboards use, are read-only: the assistant can list accounts and fields and query data, but it can’t change campaigns or settings. Also, sign-in uses OAuth, the assistant only sees the rows it asks for, and you can revoke access at any time. Ad and social changes are a separate Automation feature that asks before it writes anything.
An AI dashboard stays live: you open it, filter it and ask it to refresh. An AI report generator, however, writes a fixed report for one period, usually a document or slides with a summary. Many teams use both: a dashboard for weekly tracking and a report at month end.
Connect one source in Porter, then add Porter to your AI assistant and paste a prompt. Also, the Free plan needs no card.