





Trusted by 1,600+ marketing teams and agencies


What you can do with this LinkedIn Ads dashboard
Click a job to see it on demo data, then paste its prompt into Claude.
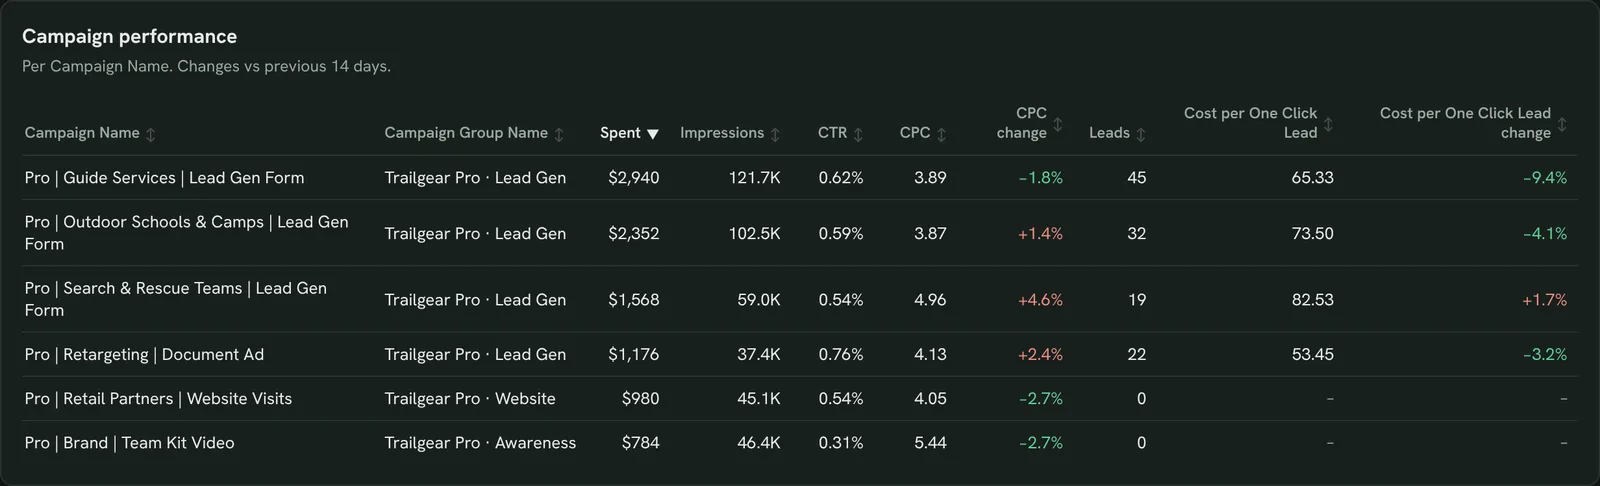
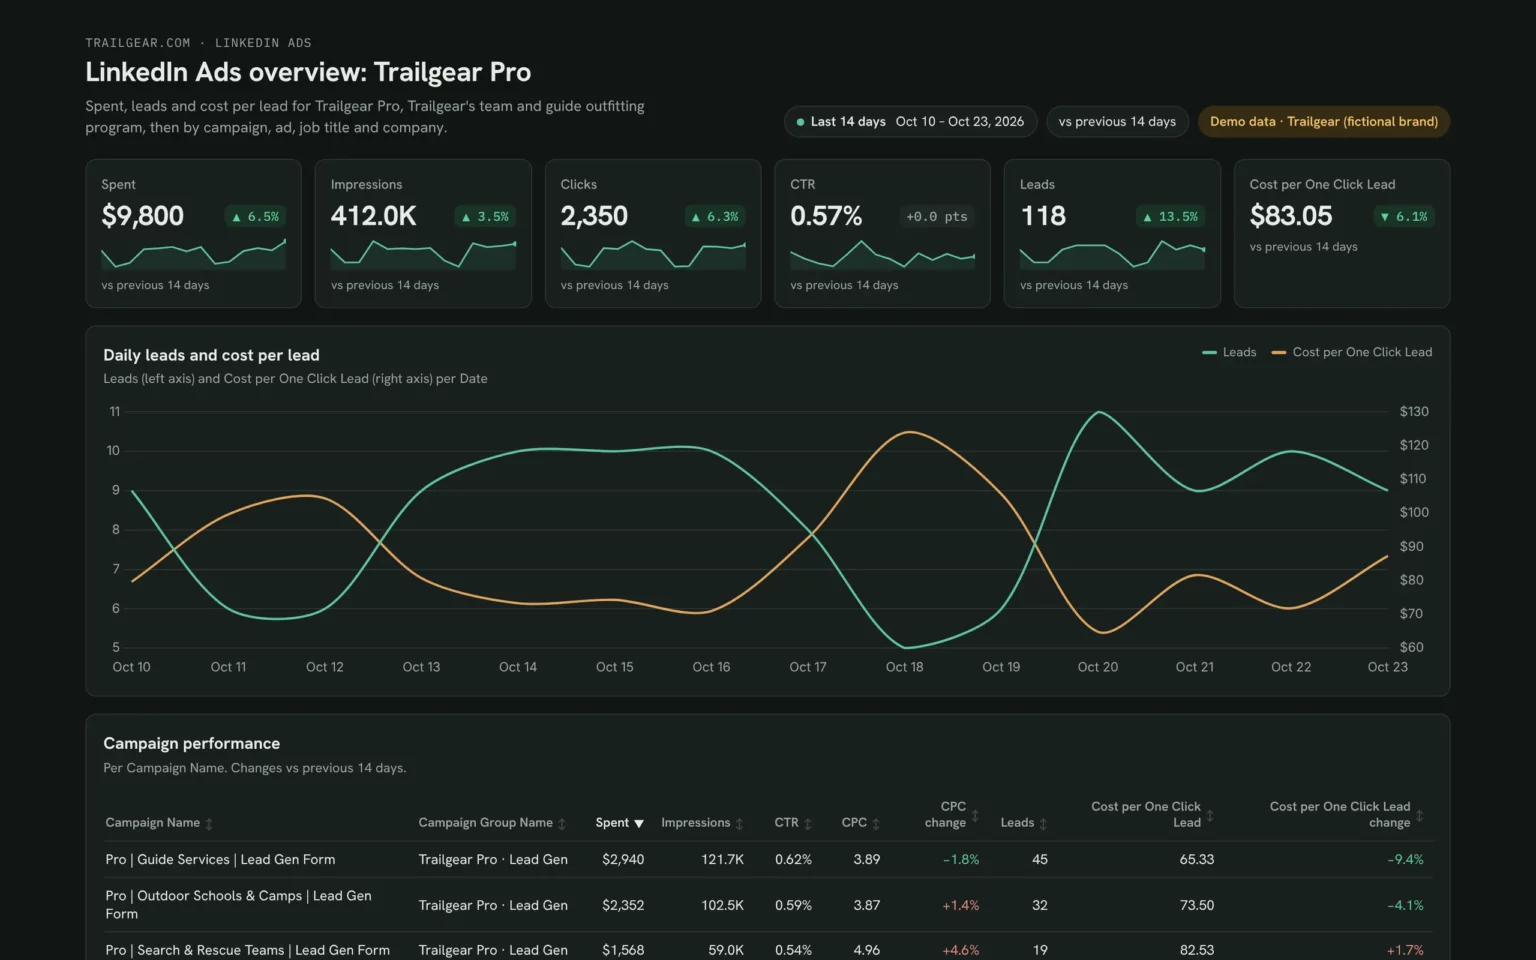
Spot campaigns going off track
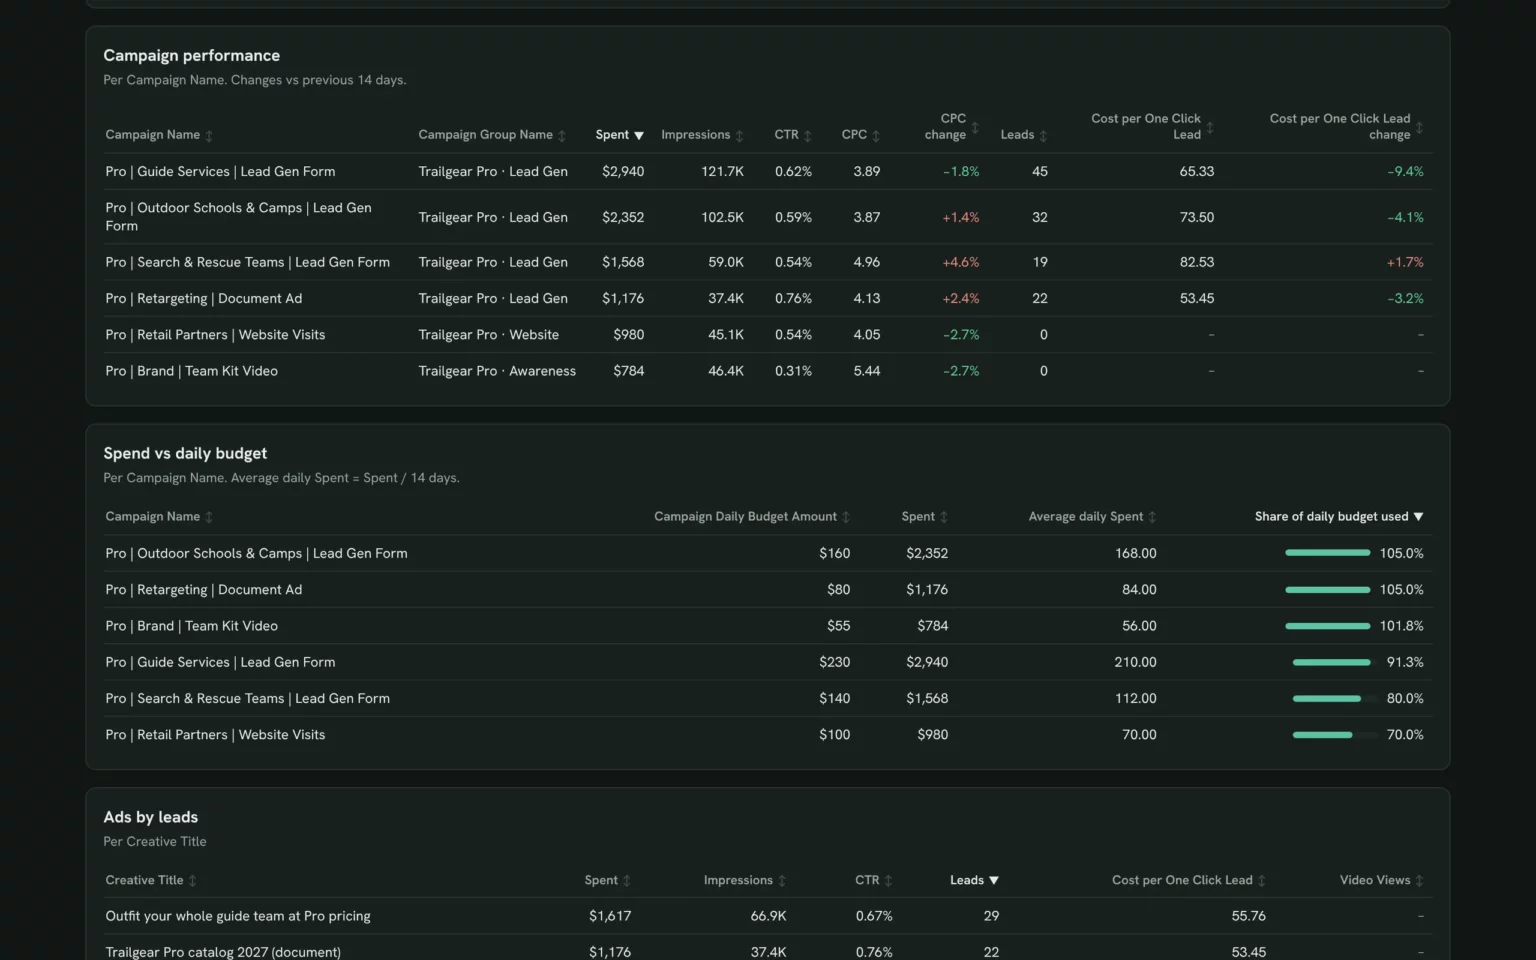
CPC and cost per lead by campaign, so you see which one got more expensive.
- Which campaigns spend most per lead?
- Whose cost per lead rose?
Show my LinkedIn Ads campaigns for the last 14 days with Spent, CTR, CPC, Leads and Cost per One Click Lead.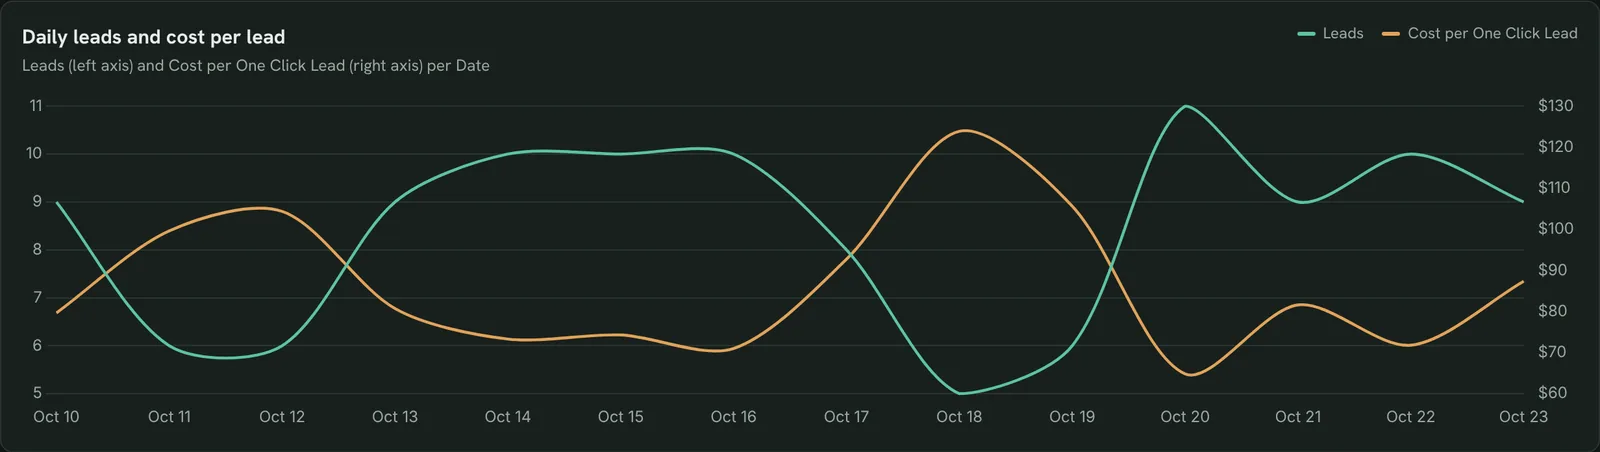
Track leads and cost per lead
Leads and cost per lead by day, so expensive days show up early.
- How many leads arrive each day?
- Did cost per lead jump on any day?
Chart Leads and Cost per One Click Lead per day for the last 14 days.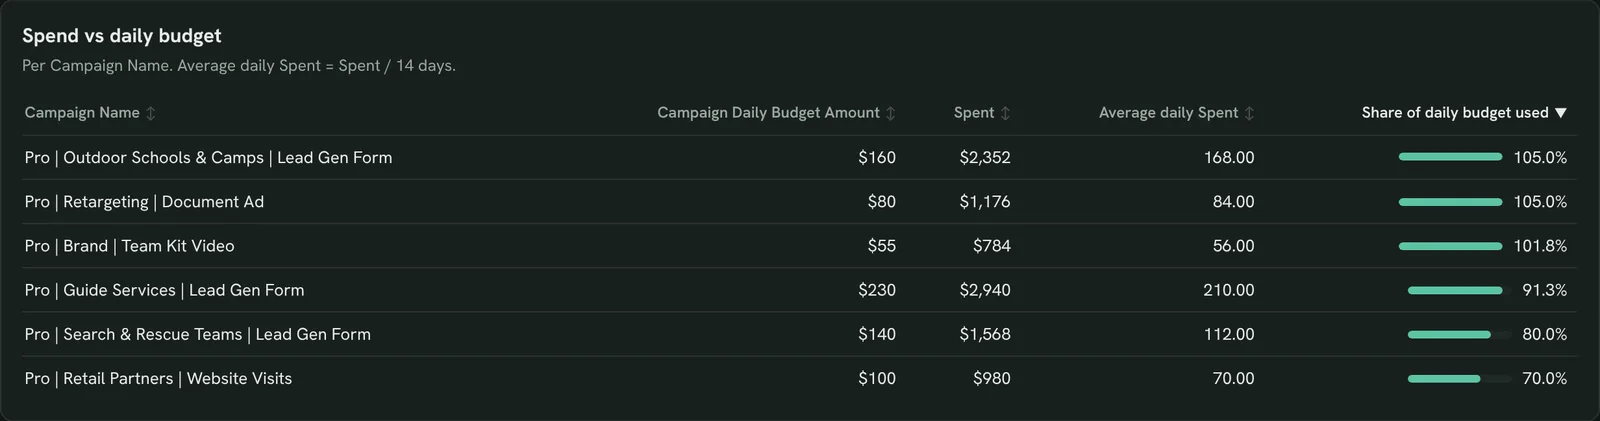
Keep spend on budget
Daily budget against real daily spend, so you catch campaigns that over- or underspend.
- Which campaigns overspend?
- Which ones leave budget unspent?
Show Campaign Daily Budget Amount and average daily Spent per campaign for the last 14 days.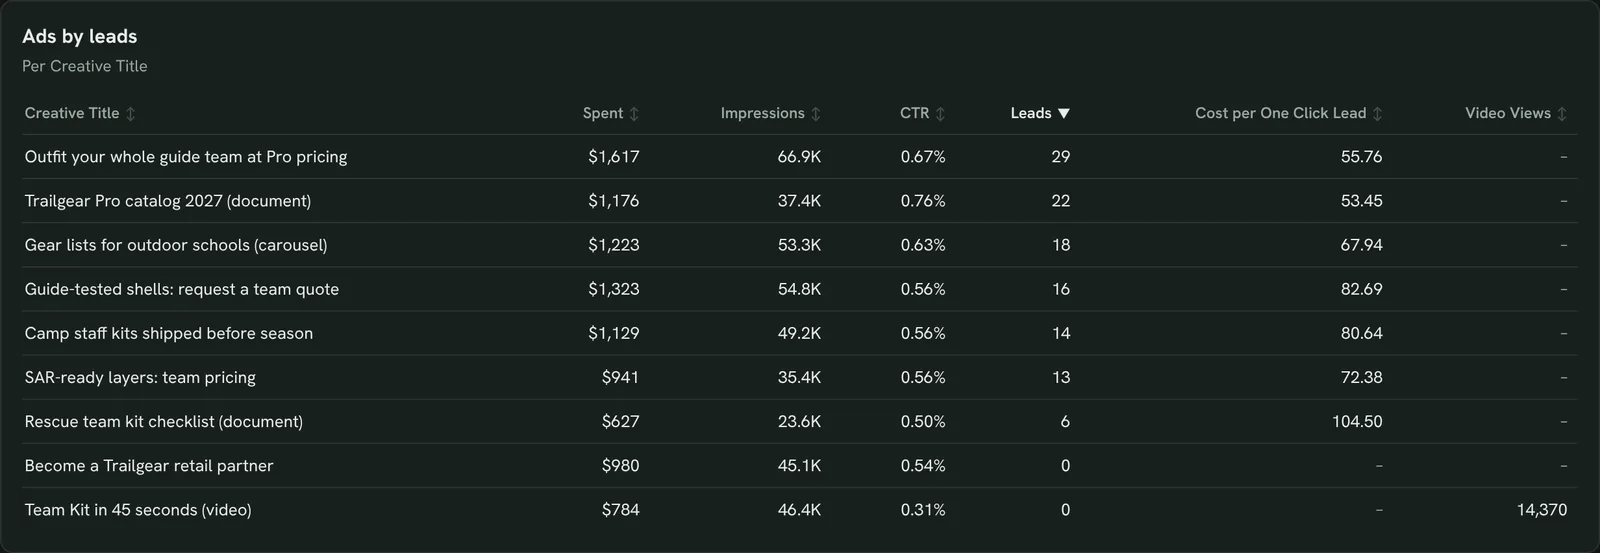
Find the ads that bring leads
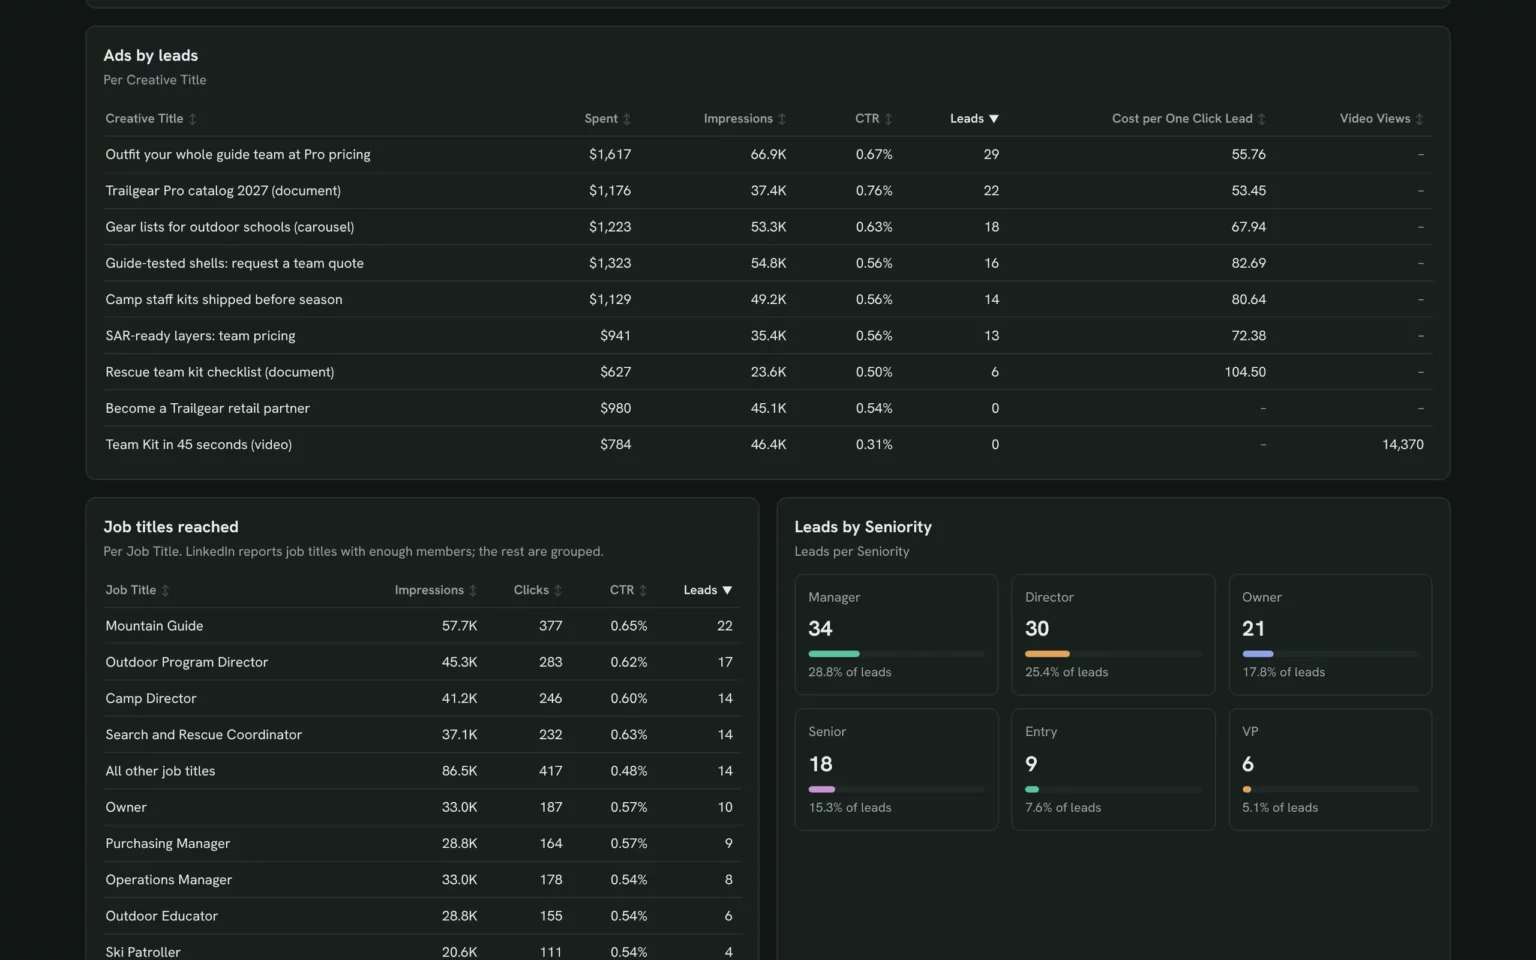
Ads ranked by leads, so you know which message and format to keep.
- Which ads get the cheapest leads?
- Do document ads beat single images?
List my LinkedIn ads by Creative Title for the last 14 days with Spent, CTR, Leads and Cost per One Click Lead.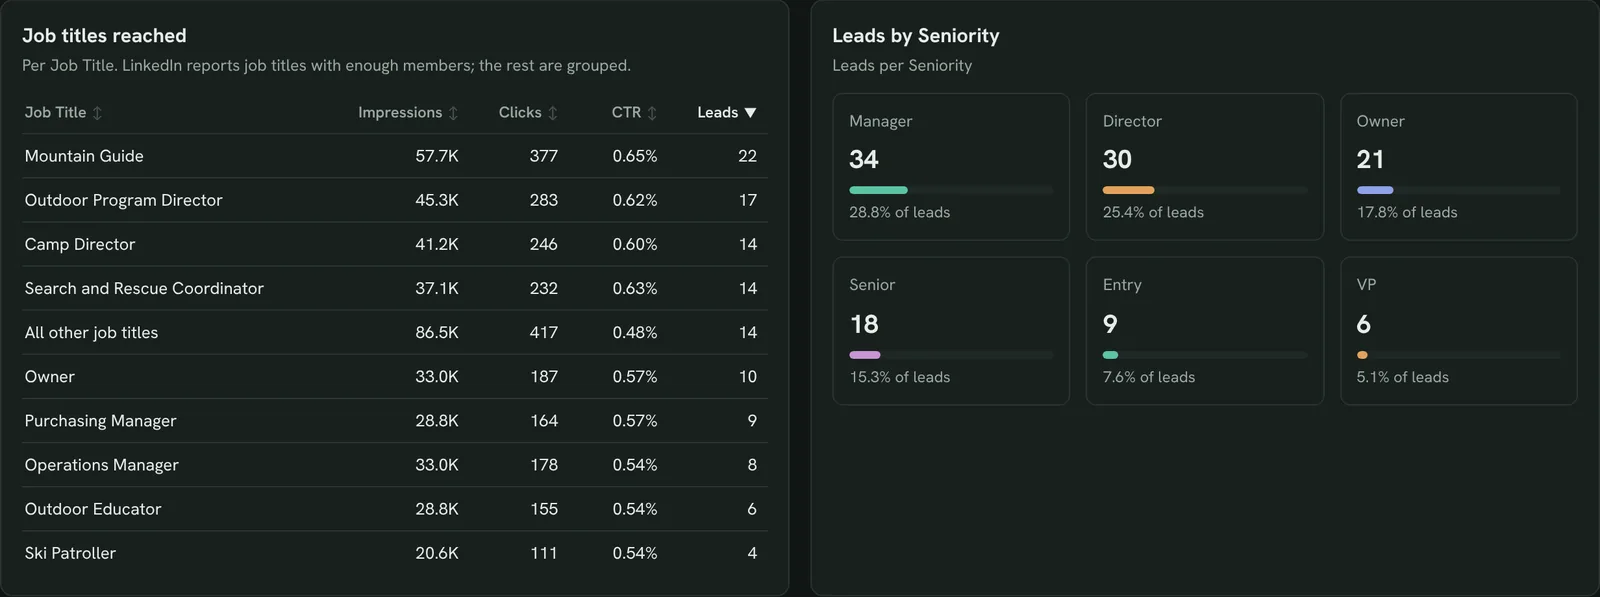
See which job titles your ads reach
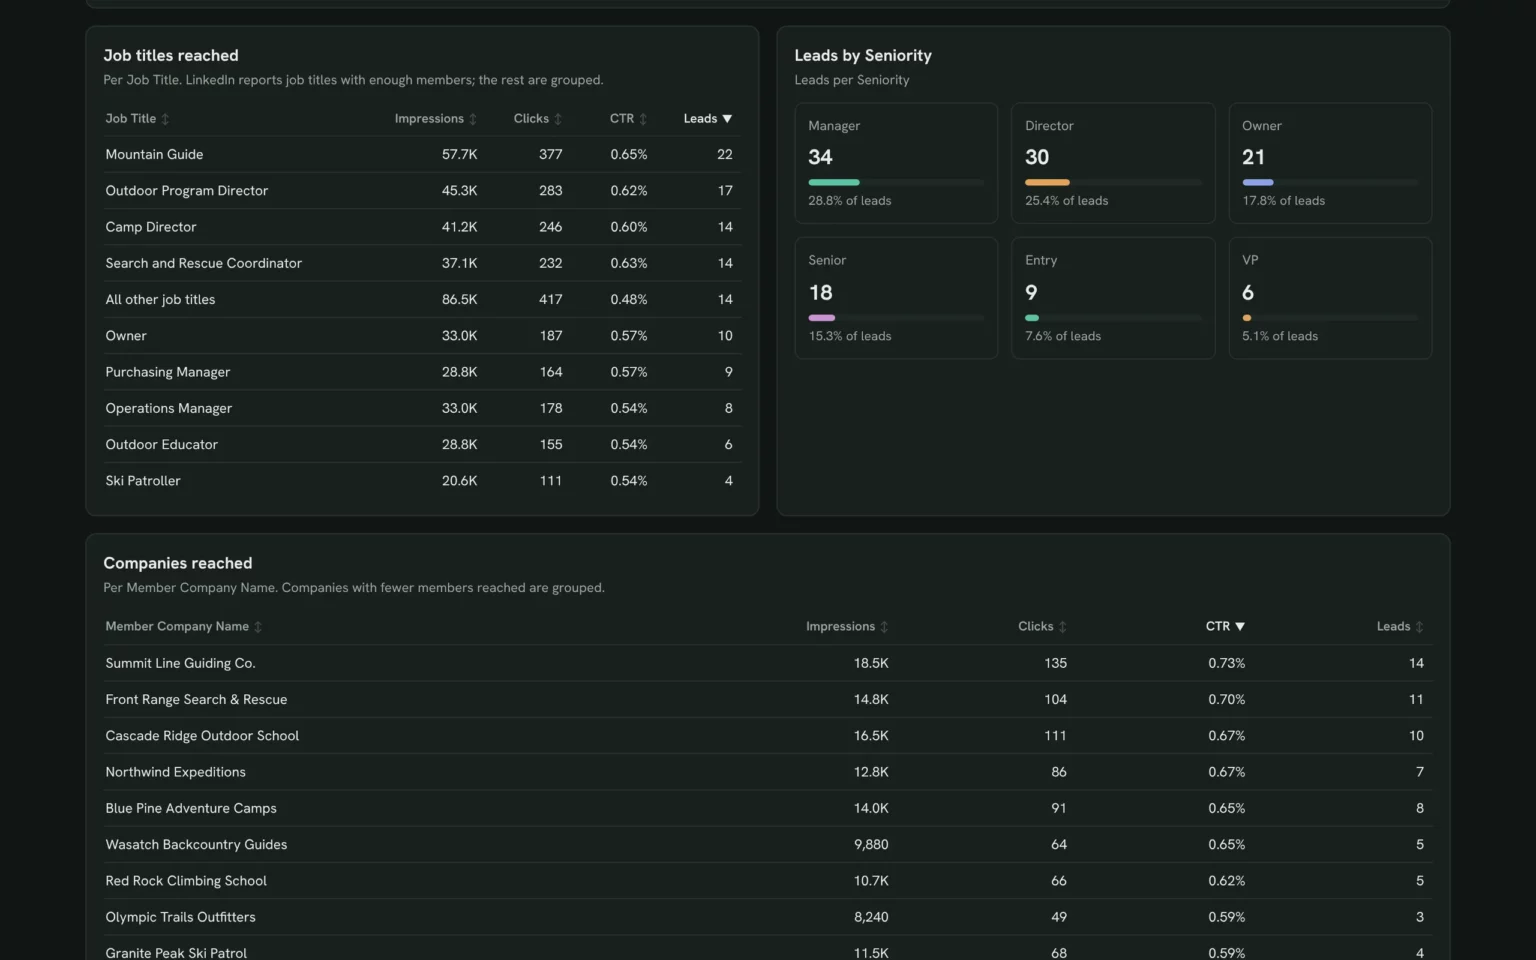
Clicks and leads by job title and seniority, so spend reaches the people who buy.
- Which job titles click and convert?
- Which seniority brings most leads?
Show Impressions, Clicks, CTR and Leads by Job Title for the last 14 days, then Leads by Seniority.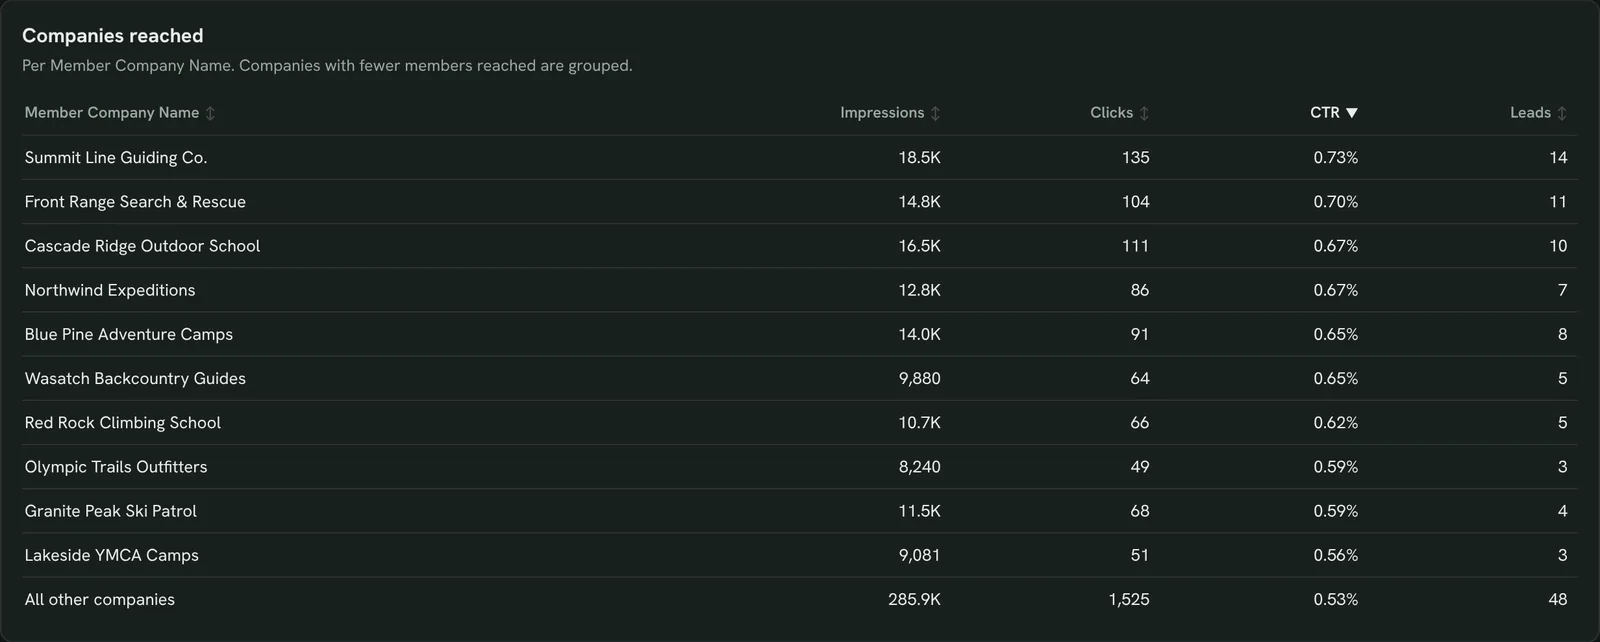
Track target accounts
The companies your ads reach, so you see which target accounts engage.
- Which companies click your ads?
- Which target accounts already sent leads?
Show Impressions, Clicks, CTR and Leads by Member Company Name for the last 14 days, sorted by CTR.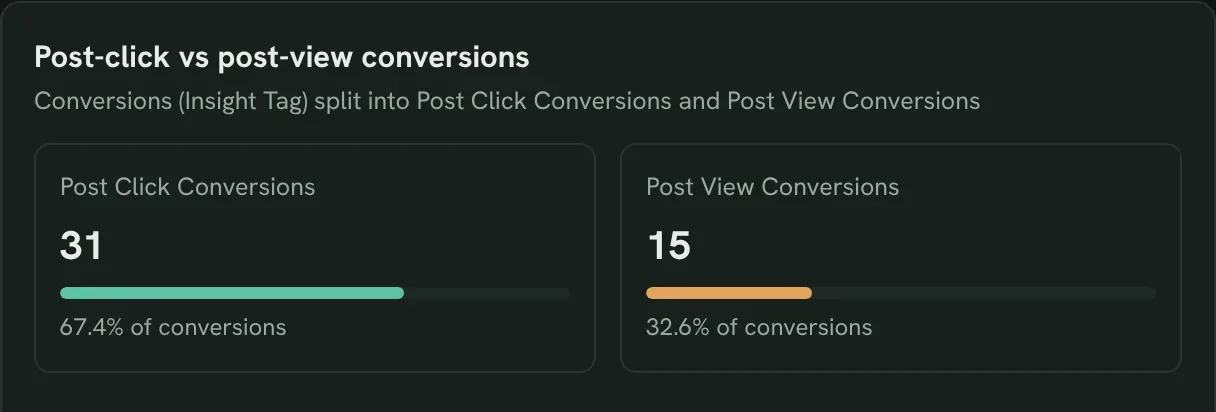
Split post-click and post-view conversions
Conversions after a click against after a view, so you know what needed the click.
- How many came after a click?
- How many came after a view only?
Show Conversions split into Post Click Conversions and Post View Conversions for the last 14 days, by Campaign Name.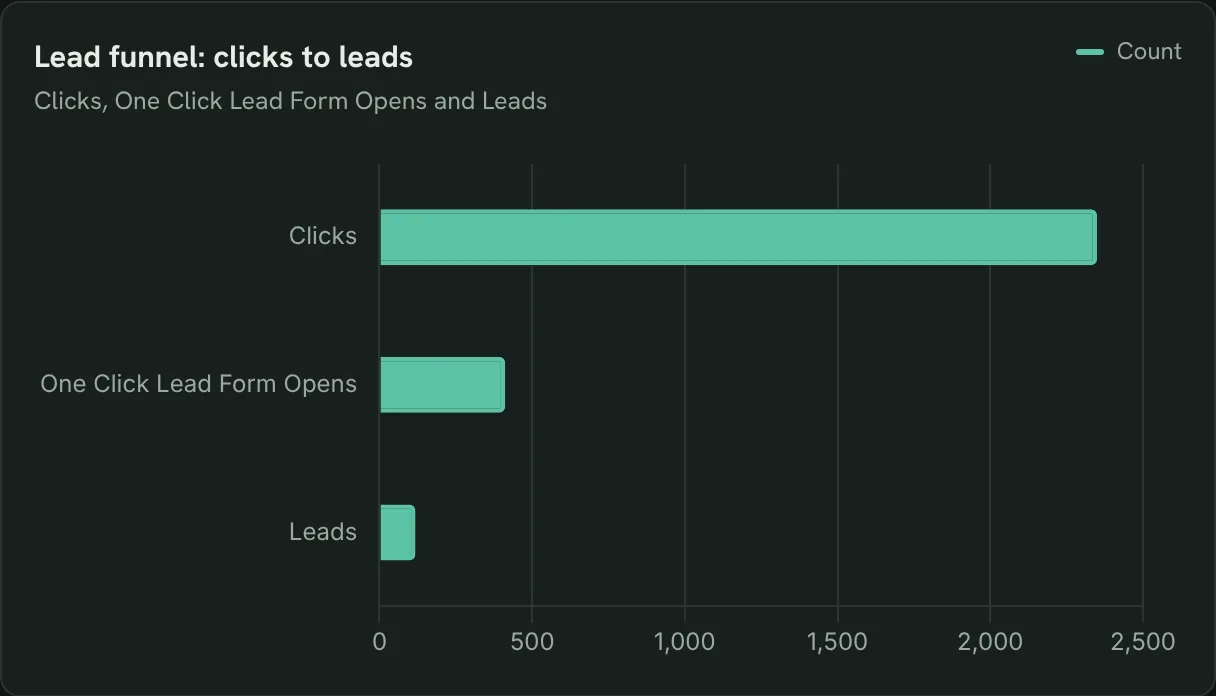
Find where leads drop
Clicks, form opens and leads in one funnel, so you know if the ad or form loses people.
- How many clicks open the lead form?
- How many form opens become leads?
Chart Clicks, One Click Lead Form Opens and Leads for the last 14 days as a funnel, by Campaign Name.How to set up the LinkedIn Ads dashboard in Claude
You need a LinkedIn ad account, a free Porter account and a paid Claude plan. Setup takes about 10 minutes.
Connect LinkedIn Ads in Porter
Sign up free at Porter, sign in with LinkedIn, tick your ad accounts and pick Claude as the destination. The LinkedIn Ads to Claude tutorial shows each click.
Add Porter to Claude
In Claude, go to Customize → Connectors → Add custom connector, paste https://mcp.portermetrics.com/mcp and name it Porter Metrics. Then sign in to Porter and allow access.
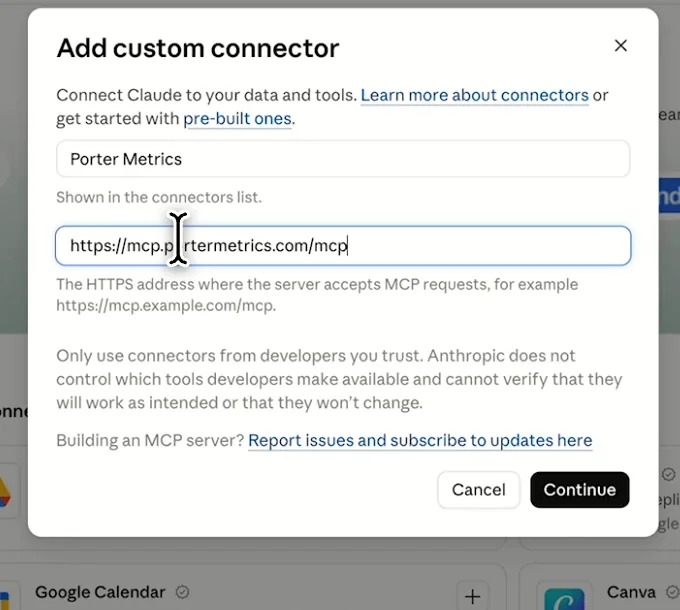
In Claude: Customize, Connectors, Add custom connector, then paste Porter’s MCP URL Paste the install prompt
Paste this prompt into a new chat and swap in your ad account. The Free plan covers 14 days; the trial adds comparisons.
Install promptDuplicate this Claude dashboard template and keep its layout, views and styling: https://claude.ai/artifact/Nju3at5VE4sft8wrG5V9FN Then rebuild it with my own data through Porter: a LinkedIn Ads dashboard for [ad account] for the last 14 days: KPI cards for Spent, Impressions, Clicks, CTR, Leads and Cost per One Click Lead; daily Leads and cost per lead; Campaign Name and Creative Title tables with Spent, CTR, CPC, Leads and Cost per One Click Lead; Campaign Daily Budget Amount vs average daily Spent; Clicks and Leads by Job Title, Seniority and Member Company Name; Post Click vs Post View Conversions; and a funnel from Clicks to One Click Lead Form Opens to Leads. Open in Claude with this prompt

The first thing Claude builds: KPI cards for your own ad account. Demo data shown.
How to connect LinkedIn Ads to Claude (no code)
LinkedIn Ads fields and data
The template uses 13 of the 226 LinkedIn Ads fields Porter reads, such as job function or company size.
Top 5 LinkedIn Ads KPIs to watch
Trailgear Pro demo data · last 14 days vs the 14 before
- Spent$9,800+6.5%
Check it against each campaign’s daily budget.
- Leads118+13.5%
Spend up, leads flat? Check the form before the ad.
- Cost per One Click Lead$83.05−6.1%
Move budget to campaigns under what a lead is worth to sales.
- CTR0.57%+0.0 pts
Falling on the same audience means the message wore out.
- Clicks2,350+6.3%
Rising clicks with flat leads mean the form is too long.
How the numbers are calculated
- Cost per One Click Lead
- Spent ÷ Leads.
- CTR
- Clicks ÷ Impressions.
- CPC
- Spent ÷ Clicks.
- Form completion
- Leads ÷ One Click Lead Form Opens.
- Share of daily budget
- Daily Spent ÷ Daily Budget.
Data sources
Metrics
 Spent
- Impressions
- Clicks
- CTR
- CPC
- Leads
- Cost per One Click Lead
- One Click Lead Form Opens
- Conversions
- Post Click Conversions
- Post View Conversions
- Video Views
- Campaign Daily Budget Amount
Dimensions
- Date
- Campaign Group Name
- Campaign Name
- Creative Title
- Job Title
- Seniority
- Member Company Name
See all fields:LinkedIn Ads · 226 fields
What makes this LinkedIn Ads dashboard different
Campaign Manager splits campaigns, demographics and conversions across reports. This puts them on one screen you can act on from the chat.
Ask why cost per lead rose in the same chat
Ask Claude which campaign or ad caused an expensive day.
Pause a campaign without opening Campaign Manager
Claude pauses or re-budgets campaigns once you approve.
Compare any two periods
Set any range against the one before or last year.
Follow leads into HubSpot
See LinkedIn leads next to the deals they became.
Send clients a report on your logo
Email it with your logo on a schedule.
Share it without Campaign Manager access
Anyone with the link sees it, no ad account seat needed.
What the dashboard includes
- Six KPI cards
- Leads and cost per lead per day
- Campaign table with CPC and cost per lead change
- Daily budget against average daily spend
- Ads ranked by leads
- Job titles and leads by seniority
- Companies reached
- Post-click vs post-view conversions and the lead form funnel
- Share by link, PDF or email
Related dashboard templates
 Claude

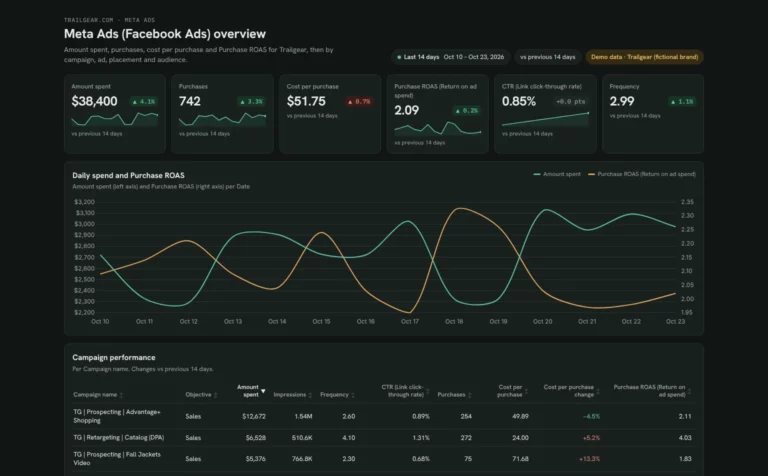
Meta Ads dashboard template
Track Meta Ads spend, ROAS and cost per purchase by campaign, ad and placement, and catch ad fatigue early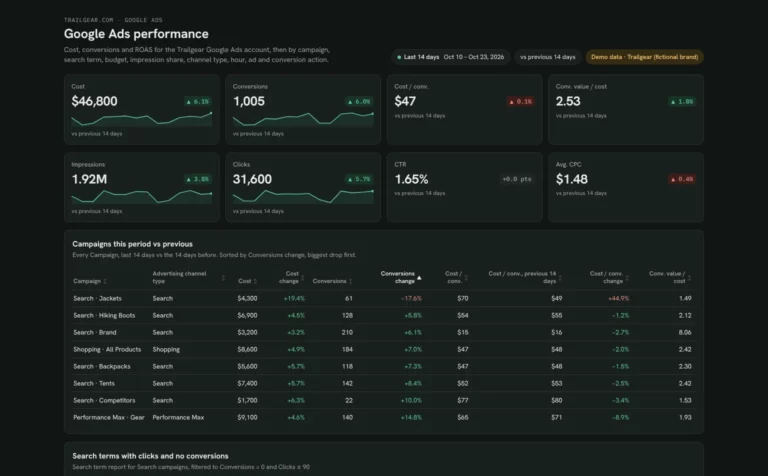 Claude

Google Ads dashboard template
Find search terms that waste spend and see which campaigns are limited by budget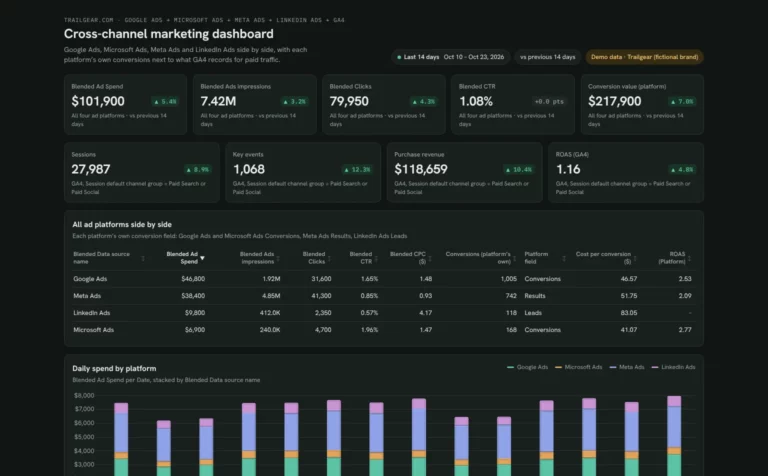 Claude


Cross-channel marketing dashboard template
Compare spend, CPA and ROAS across your ad platforms next to GA4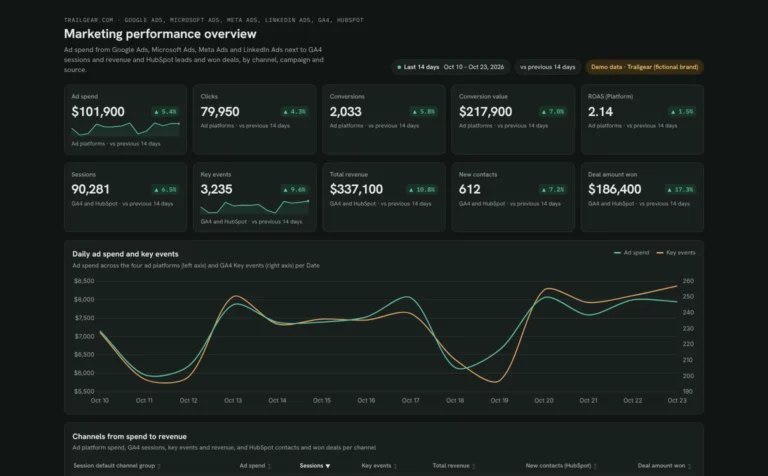 Claude

Marketing dashboard template
See which channels turn ad spend into leads, won deals and revenueBrowse more Claude dashboard templates
By data source
LinkedIn AdsCross-channel marketing dashboard
 Data Studio
 Google Sheets
 ChatGPT
Get your free LinkedIn Ads dashboard
Connect your LinkedIn ad account and paste the prompt. Your campaigns fill the same layout.
Free plan · 14-day trial · No card needed