


To connect Meta Ads to Google Looker Studio (formerly Data Studio), go to Create report (or to the Looker Studio community connectors gallery), Select single data source, as connection type, choose the Meta Ads integration by Porter Metrics, connect your Google account, connect your Facebook profile, choose your ad accounts, Click on Create report, and generate a a Meta Ads dashboard template to monitor your campaigns, creatives, budget pacing, and attribution performance.
Free and paid ways to Connect Meta Ads to Looker Studio
The free plan lets you connect up to 3 Meta Ads accounts to Looker Studio, Google Sheets, or BigQuery with unlimited use and 30 days of historical data.
Looker Studio Connector (Recommended)
Pulls data directly from Meta Ads API with drag-and-drop functionality and fresh data. Loading speed varies with data volume—use Sheets or BigQuery for large accounts.
Google Sheets Import
import data automatically via add-on or manually import CSV files from Meta Ads (free but manual), then connect Sheets to Looker Studio with Google’s native connector. Advantages include instant load times for small datasets and data editing (goals, markups, commissions); downsides include reduced granularity (only use fields from Sheets queries) and freshness dependent on sync frequency. Manual CSV uploads have additional limitations: 100-upload limit, 100MB max per file, and identical file structures required.
Google BigQuery
Best performance and scalability for large data volumes, but typically requires BigQuery knowledge and maintenance. Data freshness depends on sync frequency to avoid API limits. Porter simplifies this by handling all transformations automatically—unlike other tools that import raw tables requiring manual work, Porter makes it completely no-code.
Porter Metrics offers all three methods.. This tutorial focuses on the direct Meta Ads connector for Looker Studio.
Free Meta Ads connector for Looker Studio
To use the free Meta Ads connector for Looker Studio by Porter Metrics, create a report, choose a single data source as the connection type, and choose the Meta Ads integration.
Step 1: Connect your Facebook profile
Connect your Facebook profile to grant access to your desired ad accounts. We recommend selecting access to both current and future Business Managers and Meta ad accounts. This prevents the need to repeatedly re-authorise your Facebook profile later.

Note: Your Facebook profile email can be different from the Google email you use for Looker Studio.
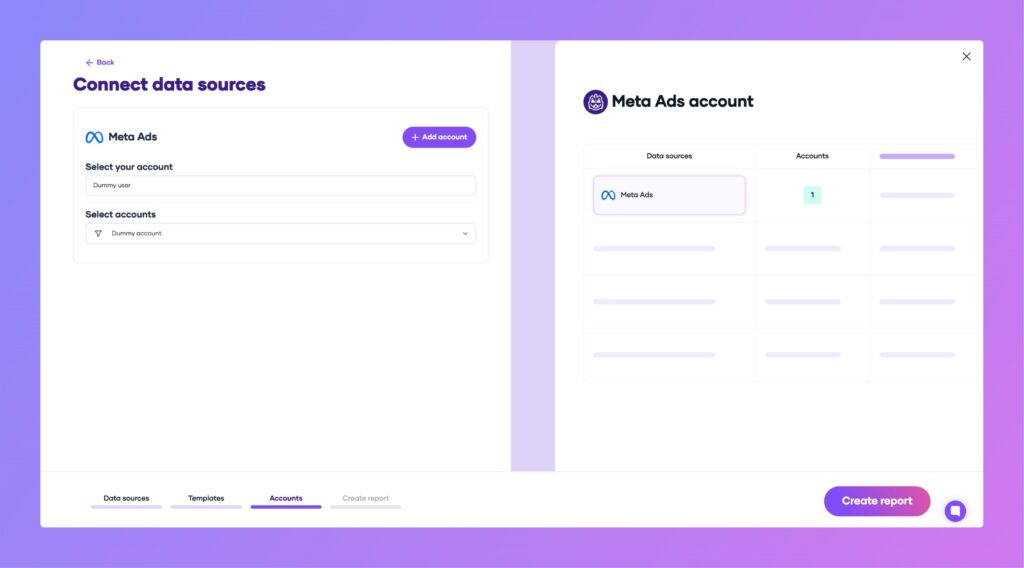
Step 2: Select ad accounts
Choose the ad accounts you want to include in your report. When you select multiple ad accounts for a single connection, Porter automatically blends their data together.
Optional: Enable automatic BigQuery storage if you’re connecting multiple ad accounts with large data volumes. This ensures your reports load quickly.
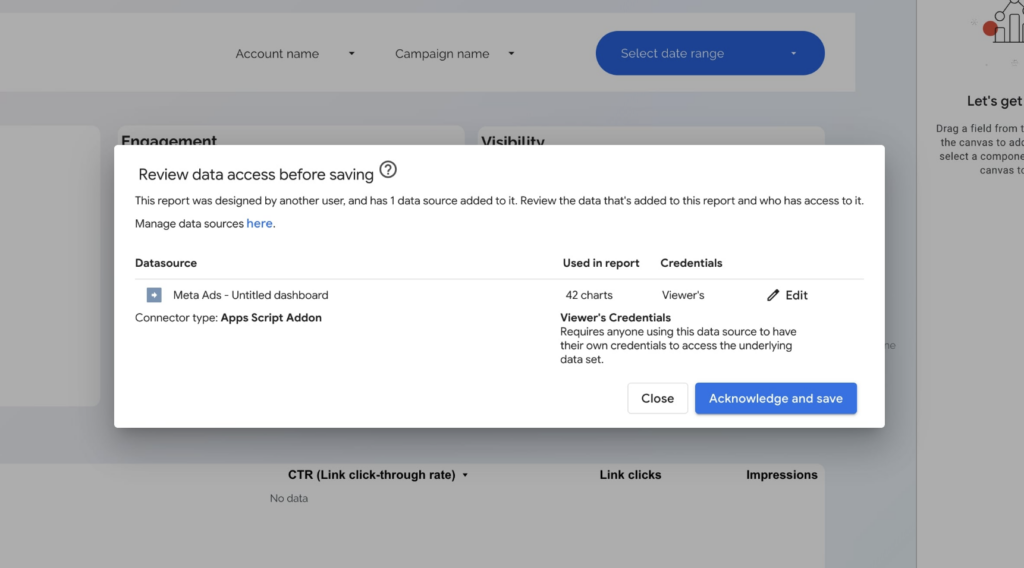
Step 3: Create and authorise your report
Click “Create report” to be redirected to Google Looker Studio. When authorising Porter Metrics, ensure you log in with the same Google account you’re currently using in Looker Studio. This email should appear as the first (default) option.
Important: If you’re logged into multiple Google accounts simultaneously, Google may return an error. To avoid this:
- Use a browser session with only one Google account logged in
- Or ensure your preferred account is listed first during Google authentication
After your report loads in Looker Studio (this may take a few seconds), click “Save and Share” in the top right corner to publish your report.
Note: A direct Looker Studio connector pulls data directly from the Meta Ads API:
- Flexible data combination: Freely combine multiple metrics and dimensions in a single query without intermediate tables.
- Freshness: data is as fresh as possible from the API. Meta documentation mentions up to 48 48-hour delay, but it’s typically instant or just minutes.
- Speed: Small accounts load in 4-8 seconds. Large accounts take longer—use BigQuery storage for faster loading.
- Usage Limits: Intensive usage may hit API rate limits based on: Calls per hour = 60 + 400 * Active ads – 0.001 * User Errors.
Meta Ads Dashboard Templates
Once you connect your Meta Ads dashboard template, you’ll access these use cases:
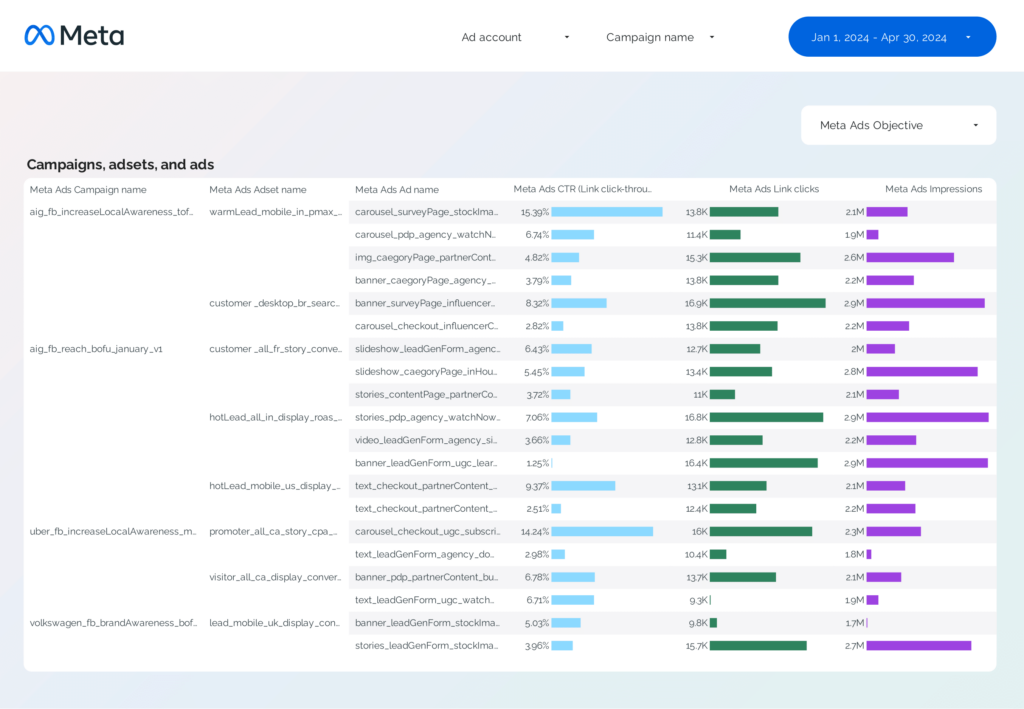
Campaign Performance dashboard
Segment by campaign names, objectives, and bidding types. Filter your naming convention to segment by product, hooks, and other “levers”.
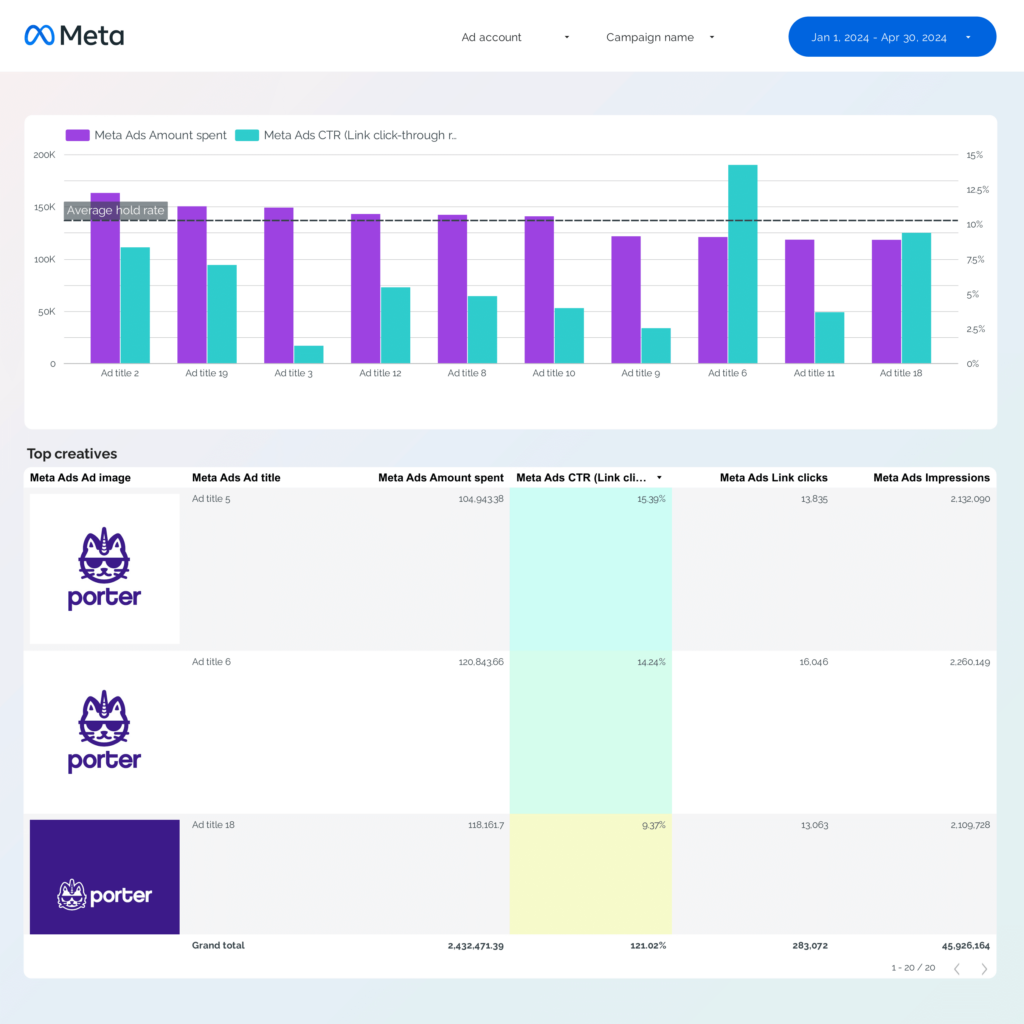
Creative Analytics dashboard
Display creative images, links, copy, and titles to compare hook rate, hold rate, ROAS, CTR, and conversions to spot winning and losing ads.
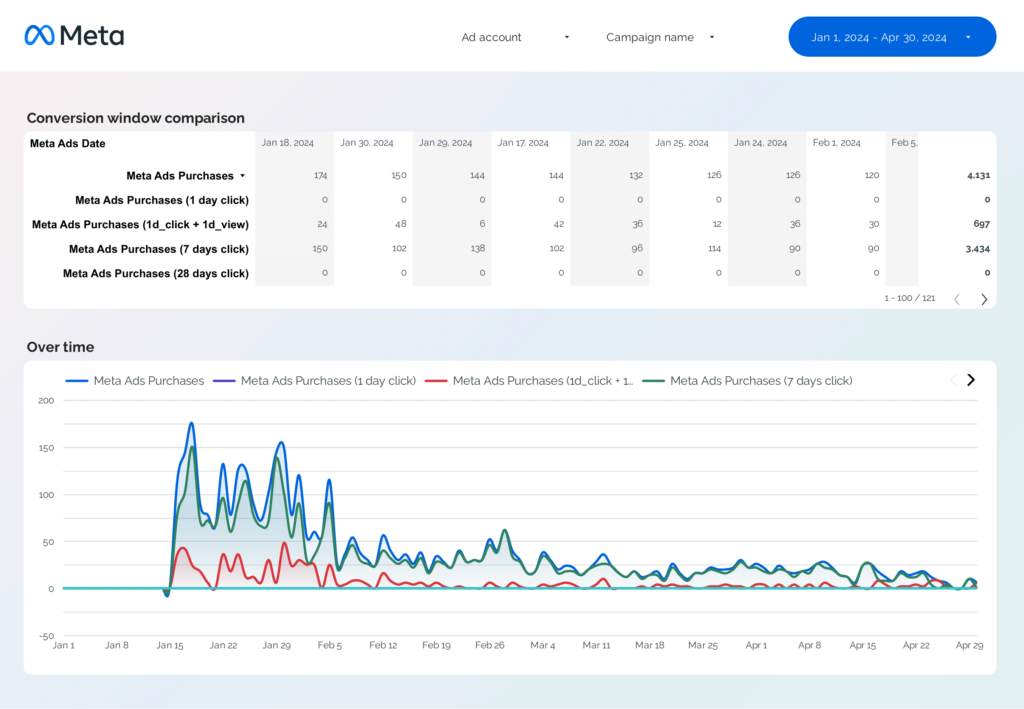
Attribution dashboard
Unlike other connectors, Porter lets you compare all conversion windows of your Meta Ads custom and standard conversions.
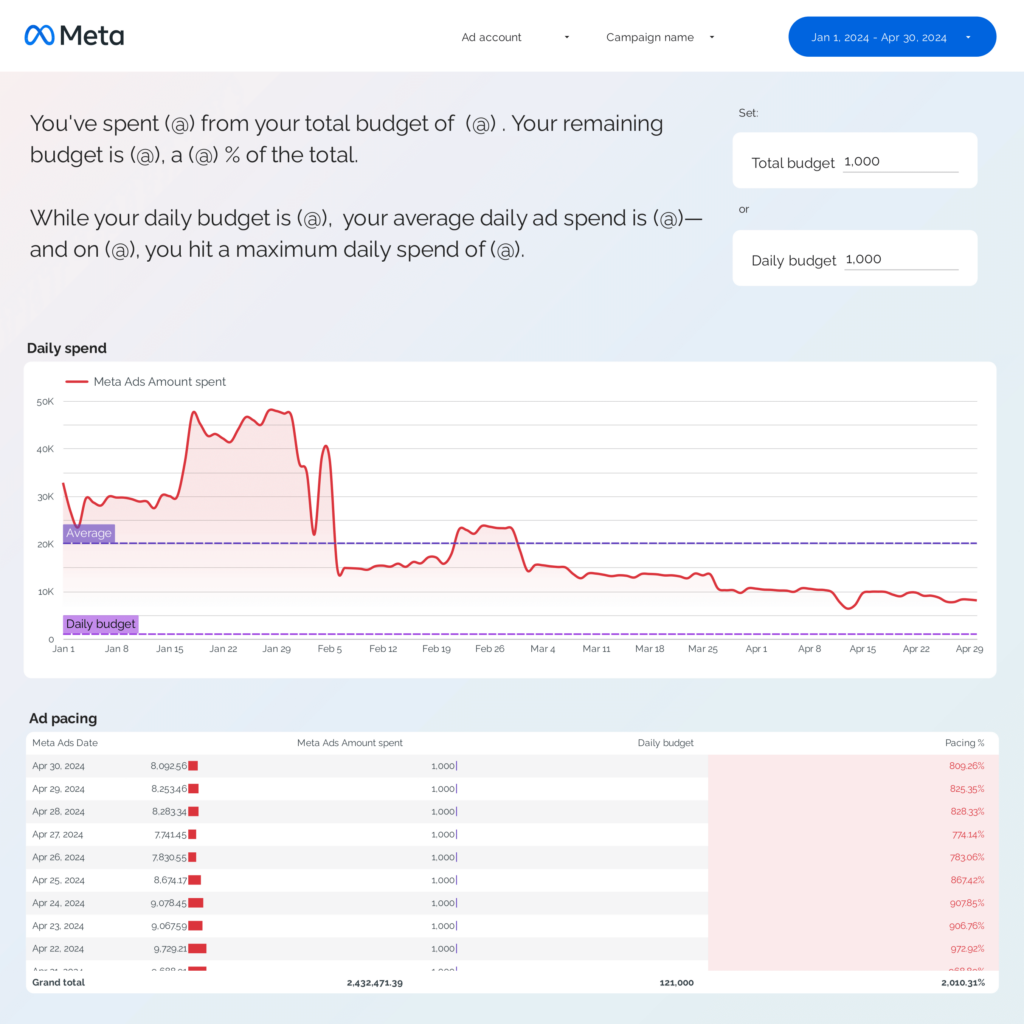
Ad Pacing dashboard
Track your daily, weekly, and monthly ad spend and compare it against your campaign or daily budget to track if you’re over- or underspending.
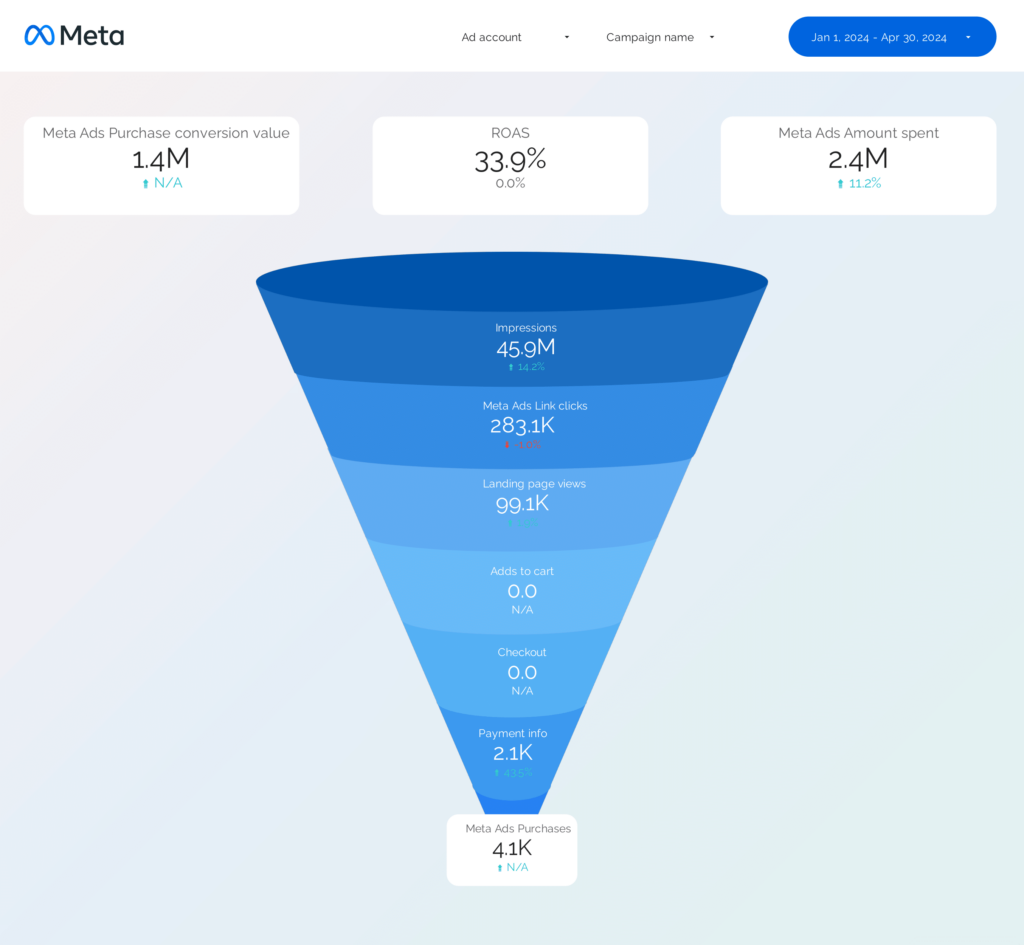
Funnel dashboard
Map your events and conversions in a funnel to understand where your traffic is leaking, from impressions to conversions.
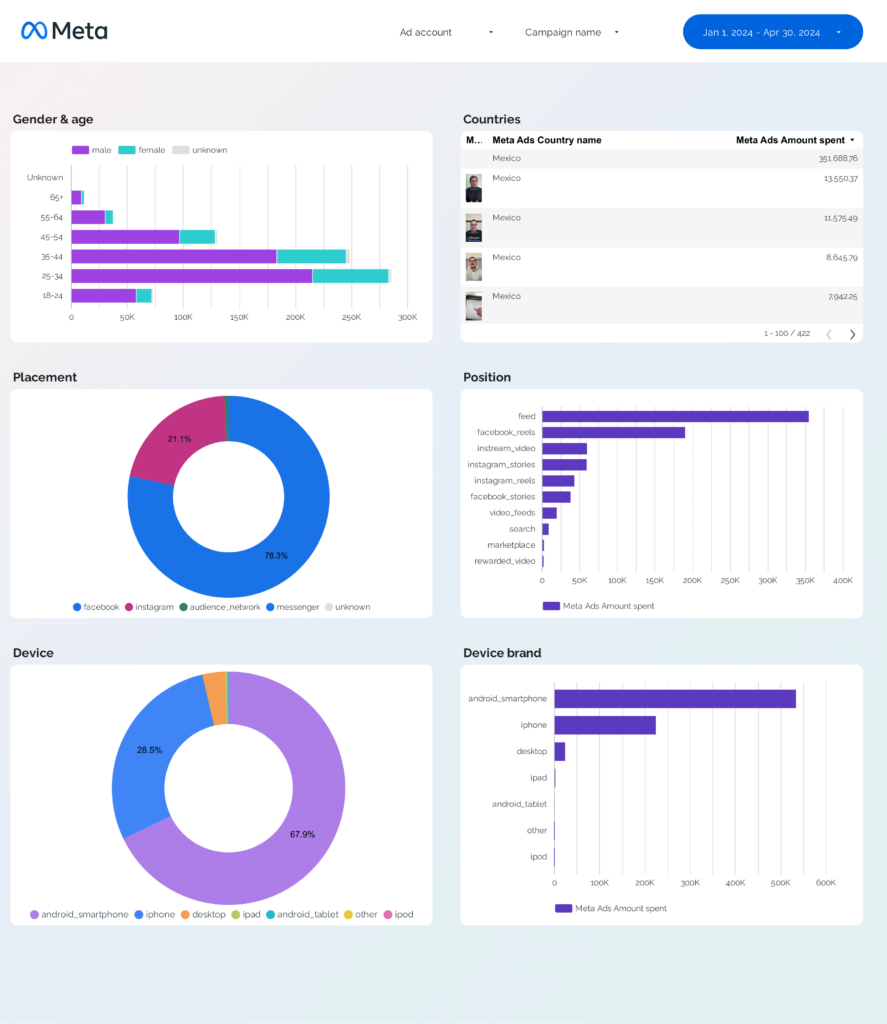
Audience dashboard
Segment performance data by demographics (age, gender), geography (country, region), and tech (device, platform, ad format).
Visit our template gallery to explore additional Meta Ads templates for Looker Studio.
Meta Ads KPIs
The Meta Ads connector brings all metrics and dimensions from Meta Ads Manager, including:
Conversions
- Events: Landing page views, add to cart, contacts, leads, purchases, and other standard or custom events.
- Efficiency: CPL, CPA.
Effectiveness: ROAS, conversion rate, average order value.
Aggregation:
- Total: Total occurrences (e.g., Purchases)
- Unique: Unique users who triggered the event
- Value: Economic value (e.g., Purchase value)
- Cost: Spend per event (e.g., Cost per Purchase)
- Event location: Total, Offline, Website, On‑Facebook, Mobile App
Note: The API doesn’t return “Results”; pick the event aligned with your campaign objective.
Engagement
- Clicks: All clicks, link clicks (unique/total), outbound clicks
- Social actions: Likes, comments, reactions, shares, saves, views, responses, check‑ins
Video: Plays, average play time, completions (25%, 50%, 75%, 95%, 100%), 2‑s and 3‑s views - Messaging: Messenger/WhatsApp conversations started
- Rates: CTR, engagement rate
- Costs: CPC, CPE
Visibility
- Metrics: impressions, reach, Frequency
- Cost: Cost per thousand impressions (CPM)
- Brand Awareness: Estimated Ad Recall Lift (People) and Estimated Ad Recall Lift Rate
Budget
Ad spend, Campaign lifetime budget, and Campaign daily budget
Dimensions
Segment data by:
- Time: Hour, Date, Week, Month, Quarter
- Account: Account, Client, Brand
- Channel: Facebook, Instagram, Messenger
- Campaigns: Campaign name, Objective, Type, Bidding, adsets. Advantage+.
- Audience: Geo (City, region), demographics (Gender, age), Tech (Device, platform), Behavior (Funnel stage, remarketing)
- Content Performance: Creatives, copy, format, hook
Custom fields
- Custom Metrics: build new KPIs ( conversion rates, CPA, ROAS, budget pacing, currency conversion, custom conversions)
- Custom Dimensions: Use REGEX and naming conventions to group by brand, client, product line, etc.
Filters: Apply filters at the chart, page, or report level (e.g., Publisher Platform contains “instagram”). - Data blending: blend Meta Ads with Google Ads, LinkedIn Ads, HubSpot, GA4, or Shopify for cross-channel reporting, attribution, and ROI measurement.
How to build a Meta Ads dashboard
To customise the dashboard, either add a new page to the downloaded template or create a new report from scratch, then switch to Edit mode.
If you create a new report, here’s how to connect your data and manage data sources in Looker Studio.
Step 1: Add charts to visualise KPIs
Add scorecards, time series, tables, pie charts, and more chart types to visualise your data.
- Bar charts: compare values by categories. Example: Age vs. Gender to see audience distribution for impressions.
- Scorecards: show a single KPI with trend or comparison. Example: Total spend vs. previous period.
- Tables: combine multiple dimensions and metrics in one view. Example: Campaign, Ad creative, Purchases, ROAS to find the best-performing ads.
- Time series: track trends over time. Example: Daily leads to see if a campaign is improving after changes.
- Geo charts: show performance by region. Example: Clicks by city to decide where to expand targeting.
Area charts: show how parts contribute to a total. Example: Placement type (Feed, Stories) over time to see which drives most conversions. - Pie charts: show proportions. Example: Device platform share (mobile vs. desktop) for spend allocation.
- Scatter plots: show relationships between two metrics. Example: CTR vs. Cost per lead per ad to identify outliers.
- Treemaps: show hierarchical contributions. Example: Publisher platform → Placement to see where most impressions come from.
Bullet / Gauge charts – Show progress toward goals. Example: Track engagement rate vs. a set target for a branding campaign.
Step 2: Add context with comparisons
Add goals, reference lines, and conditional formatting to compare data and add context.
- Comparison date range: Compare KPIs like spend, clicks, or conversions against the previous period to spot performance shifts in Meta Ads campaigns.
- Reference lines: Add a target or average line on a time series to see if daily spend, CPM, or CTR stays above or below the benchmark.
- Conditional formatting: Highlight high or low performance in tables, e.g., flag ad sets with high CPA in red and those with low CPM in green.
- Goal tracking: Track progress toward goals such as monthly lead targets, ROAS benchmarks, or a set engagement rate.
Step 3: Make dashboards interactive
Interactive elements make Meta Ads dashboards easier to explore:
- Buttons: Add buttons to move between pages, download the report as a PDF, or reset filters.
- Date range controls: Change the time period shown in the report, for example switch between last 7 days and last 30 days of campaign performance.
Sliders: Filter charts by numeric values such as campaigns with spend between $100 and $700 or CTR above 1%. - Dropdowns: Filter by fields like campaign name, objective, or platform (Facebook, Instagram).
Input boxes: Search campaigns or ads by typing text such as “retargeting” or “video” to only see matching results. - Cross‑filtering: Click a data point (bar, pie slice, table row) to filter all other charts to that same campaign or ad.
Step 4: Design and white-label
Learn to design your Looker Studio reports and follow best practices for dashboard design.
- Theme and layout: control colours, backgrounds, borders, headers, and navigation for a consistent look.
Page navigation: structure the dashboard into sections with icons and hide internal pages. - Navigation and headers: under “Theme and layout” > “Layout,” change the navigation type from a left menu to tabs at the top, and set the header to always show or initially hidden.
- Images and text: add branding, headers, and labels.
- Shapes and lines: use visual elements for diagrams or emphasis.
- Copy-paste styling: apply the same style from one chart to others for consistency.
Aligning charts: align and space charts evenly for a clean layout. - Conditional formatting: color cells or metrics based on performance.
- Modern charts: Enable advanced styling options like gradients and rounded elements.
- Report-level elements: Keep elements (logo, title, date control) consistent across all pages.
Step 5: Share your dashboard
Learn to share your Looker Studio reports:
- Invite people via email: Add email addresses and assign access as editor or viewer, similar to Google Docs or Sheets.
- Draft mode: Edit without showing changes to viewers until published.
- Schedule email delivery: From the Share menu, choose Schedule Delivery, enter recipient emails, set subject and message, select pages, and define frequency (daily, weekly). The email includes a preview and a PDF attachment.
- Share via link: From the Share menu, select Get Report Link and copy it. You can enable or disable link access to the current report view.
- Download as PDF: From the Share menu, choose Download Report and export all pages or selected pages as a PDF.
- Embed report: From File, choose Embed Report. Use an embed code or a full-screen URL to display the report on a website or internal tool. Embed options allow hiding navigation and resizing the report display.


