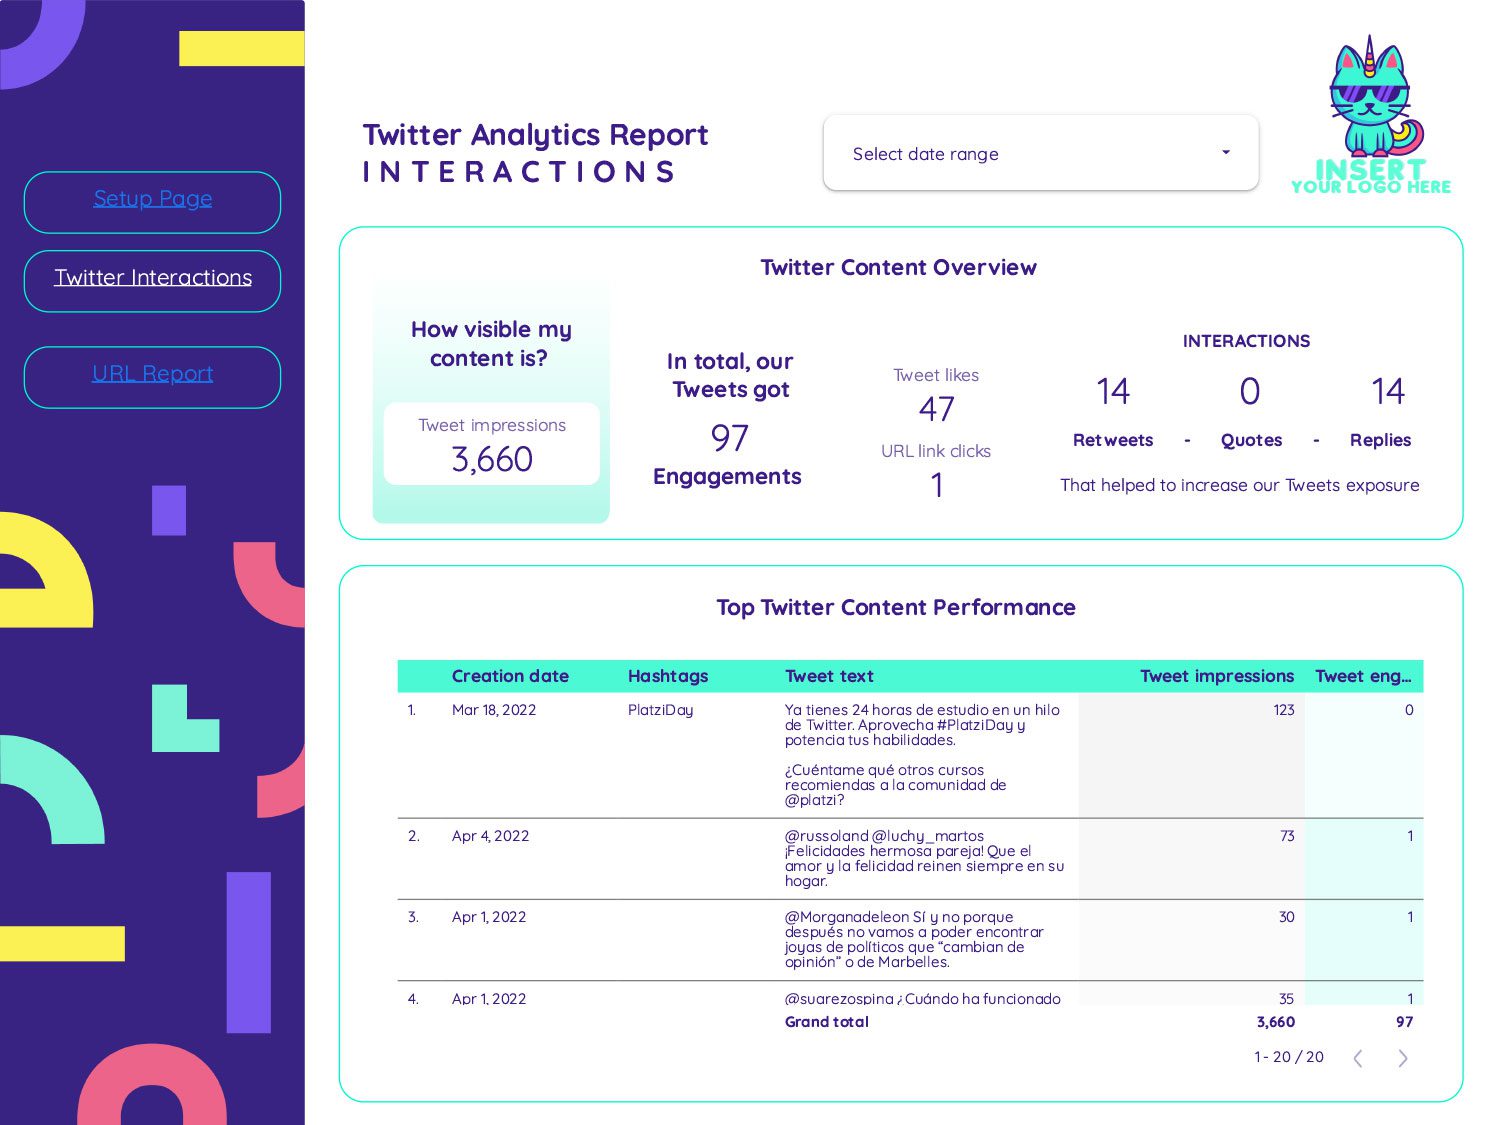
Twitter Analytics report template for Google Looker Studio
Home Twitter Analytics Twitter Analytics report template for Google Looker Studio Automate your your Twitter reports on Google Looker Studio to track followers, tweets, impressions,
Home Twitter Analytics Twitter Analytics report template for Google Looker Studio Automate your your Twitter reports on Google Looker Studio to track followers, tweets, impressions,
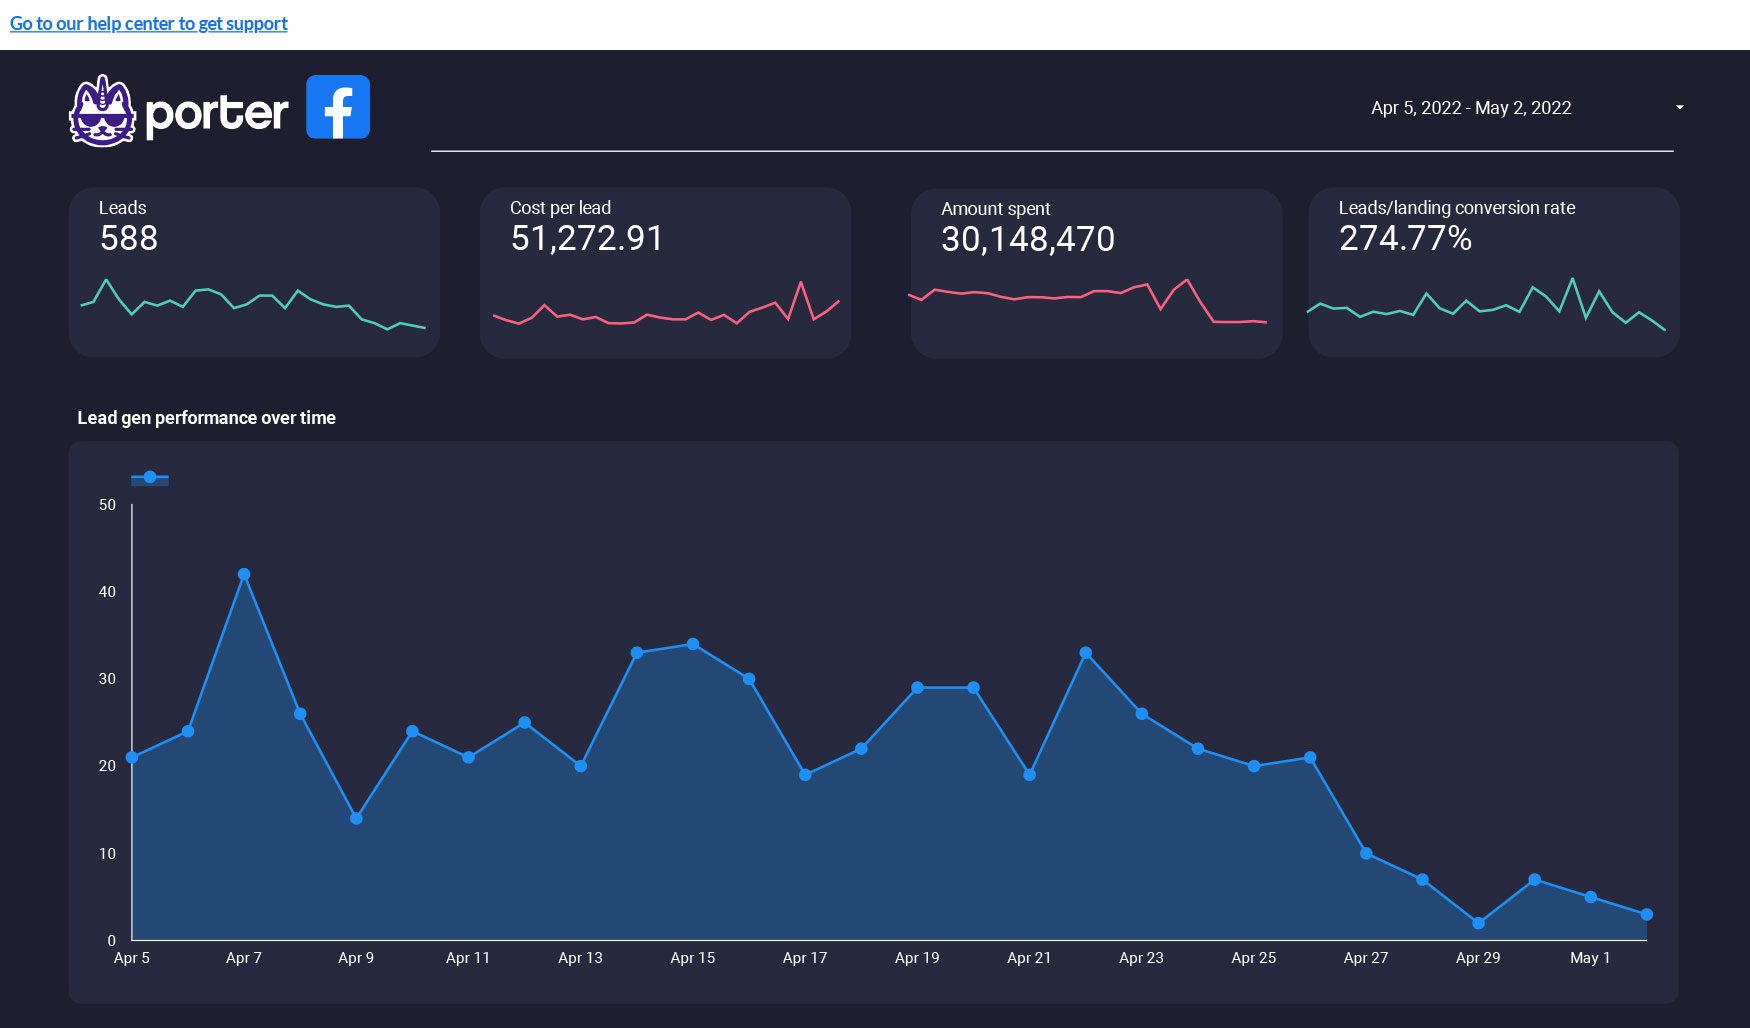
Use this Google Data Studio template to track and optimize your lead generation efforts.
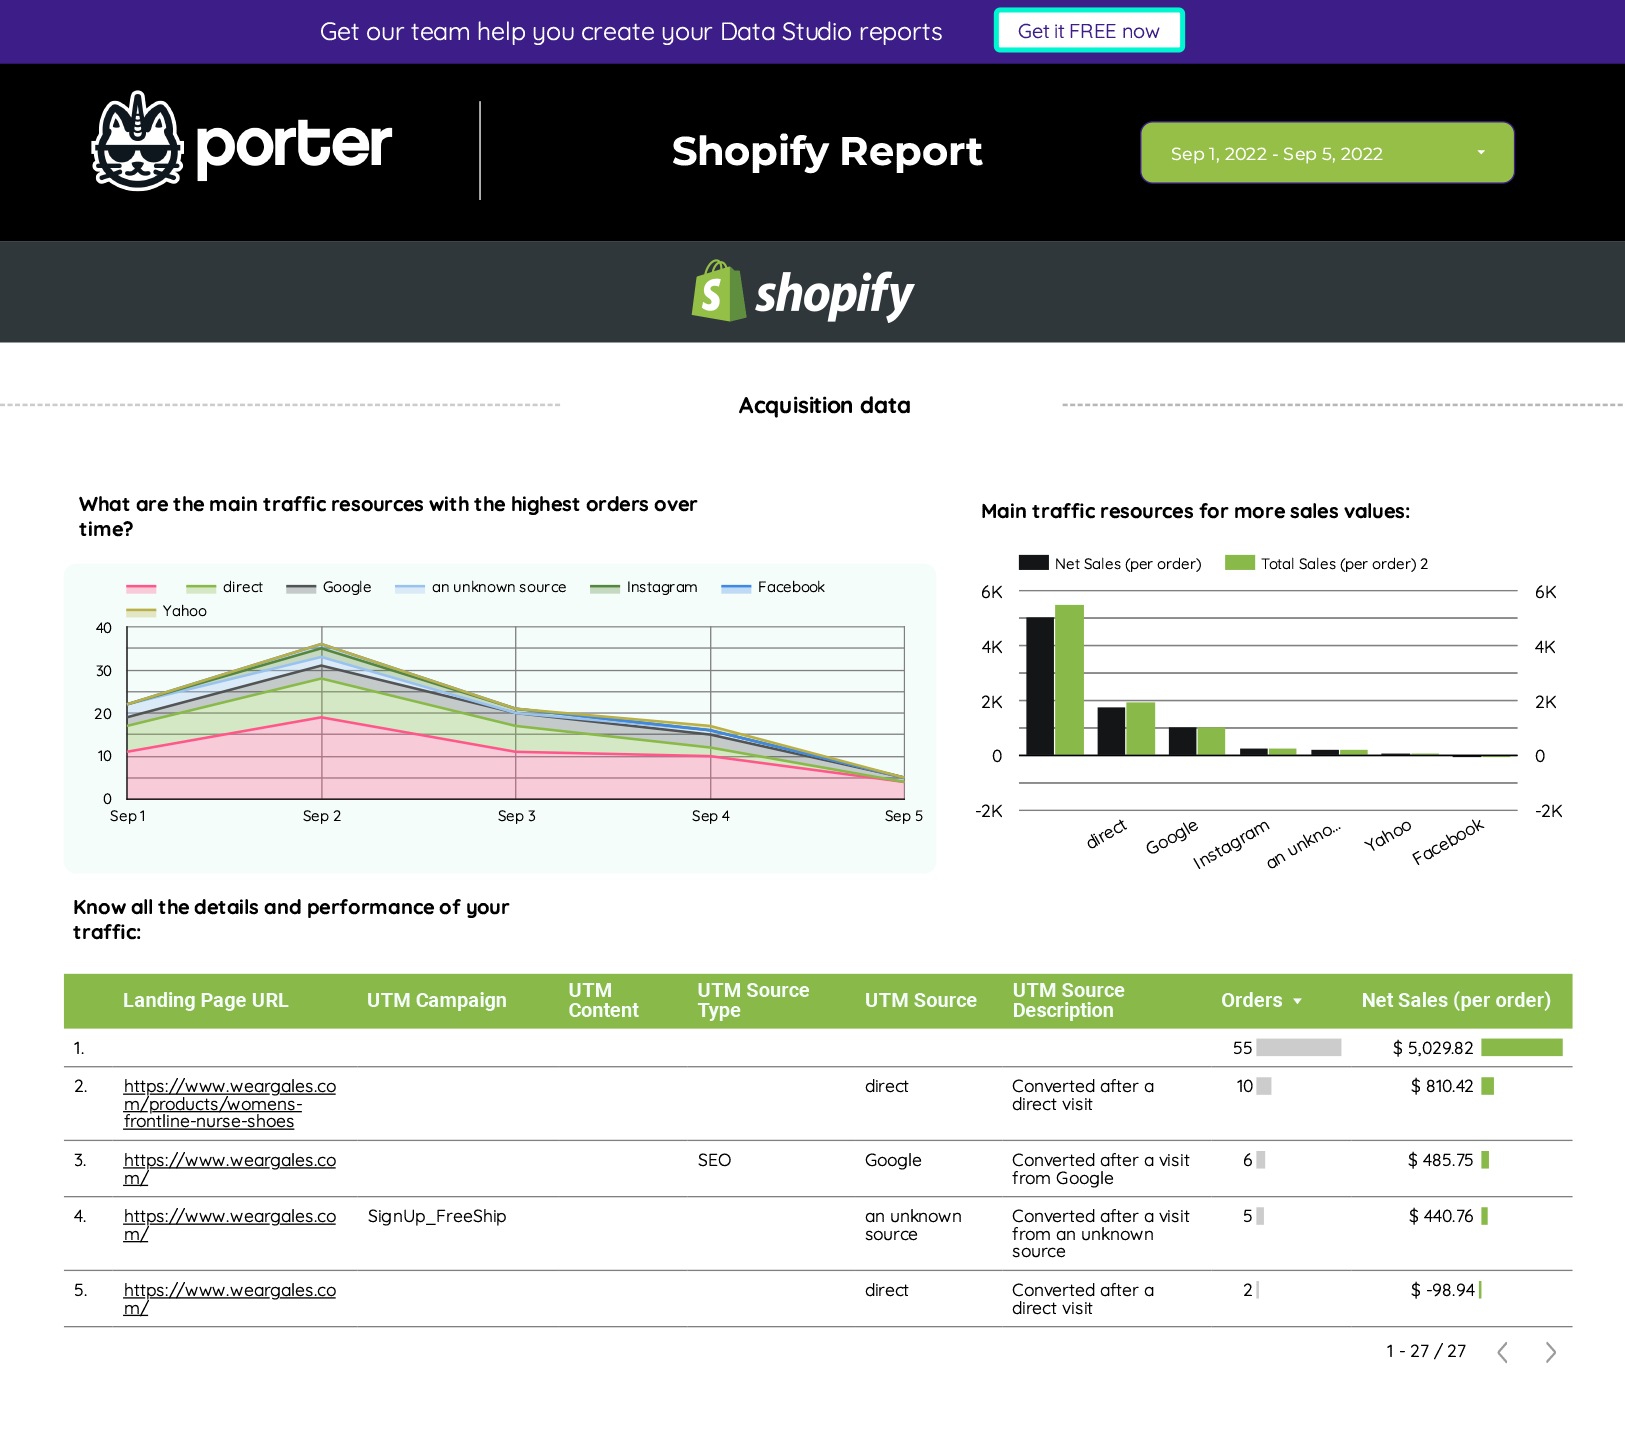
This is the initial report (the first template) of the Shopify connector, it allows for tracking the sales produced by the e-commerce, knowing which are the products with the highest number of sales, to know which are the sources of traffic to the website, and all the details of the orders.
Main metrics: sales, total orders, total orders per product, total sales, cost of sales, net sales, total completed sales, order status, etc.
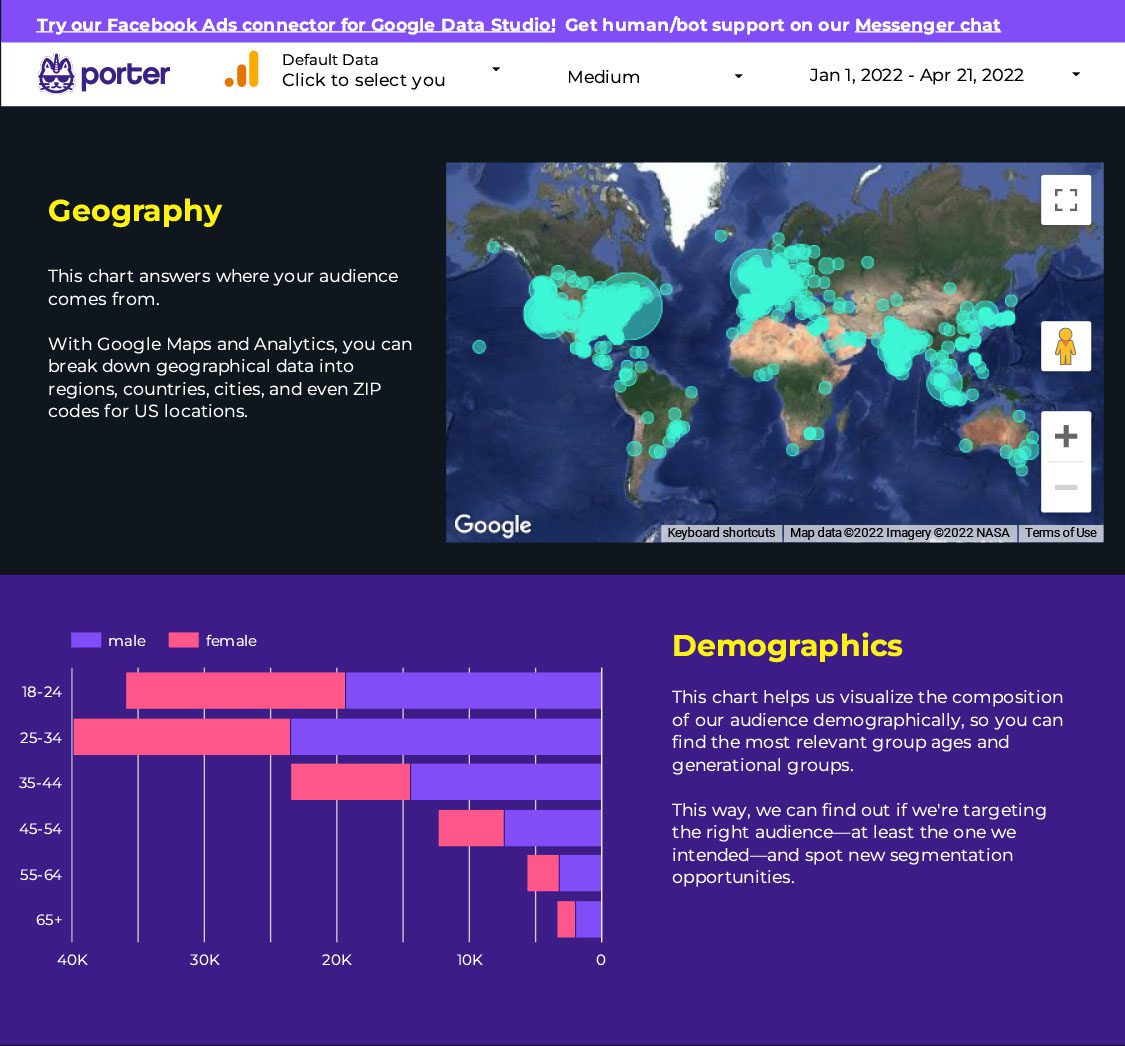
With this Google Data Studio report, you will understand the profile of the users who are visiting and buying your website to find data-based buyer personas.
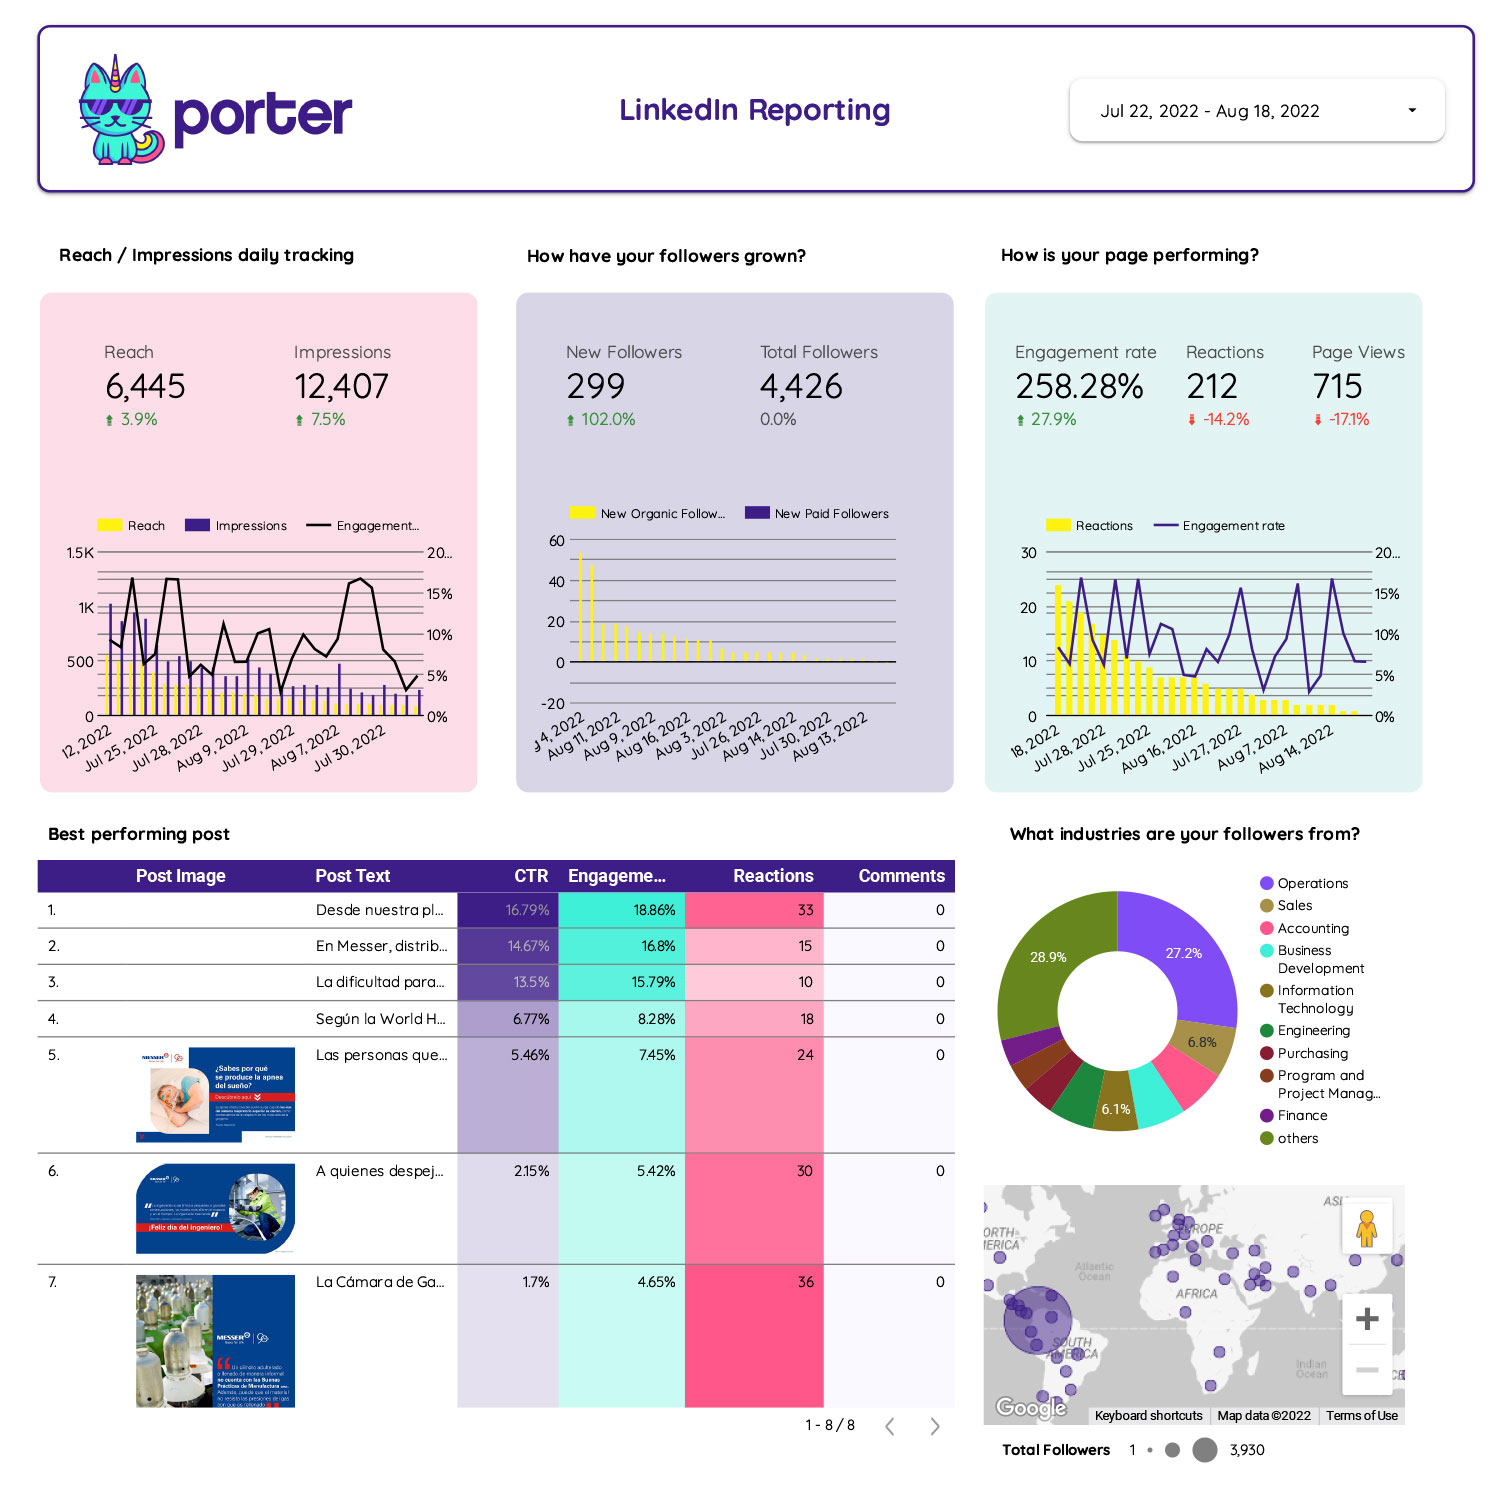
The LinkedIn reporting includes both organic data from LinkedIn Pages and Paid data from LinkedIn Ads.