4 ways to export and analyze Facebook Ads data on Google Sheets: tutorial & templates (2024)
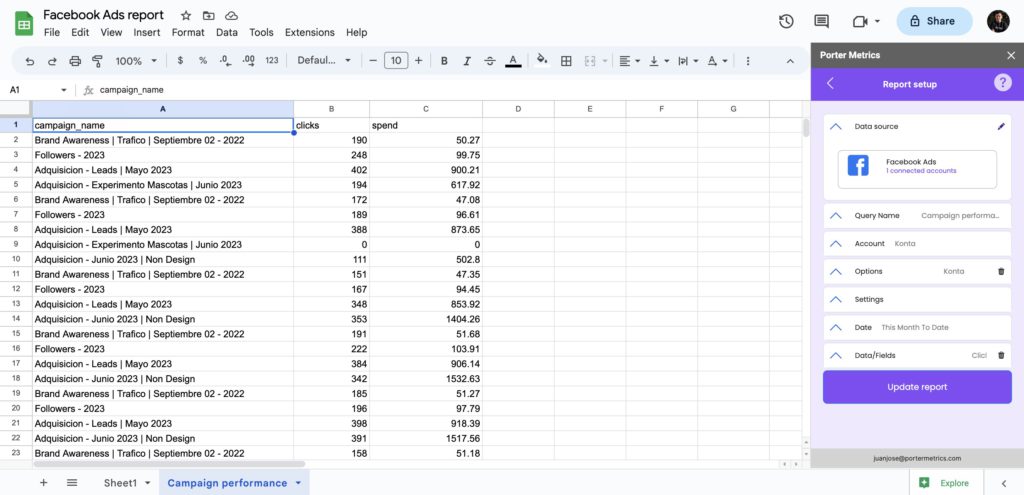
To export Facebook Ads data to Google Sheets, download the Facebook Ads to Sheets add-on, connect your Facebook profile, select ad accounts, set a conversion window and date, metrics, dimensions (or breakdowns), and date ranges, and schedule hourly, daily, or weekly data refreshes to monitor your Facebook Ads campaigns performance and automate your marketing reports. […]
How to use Google Data Studio complete tutorial (2024)
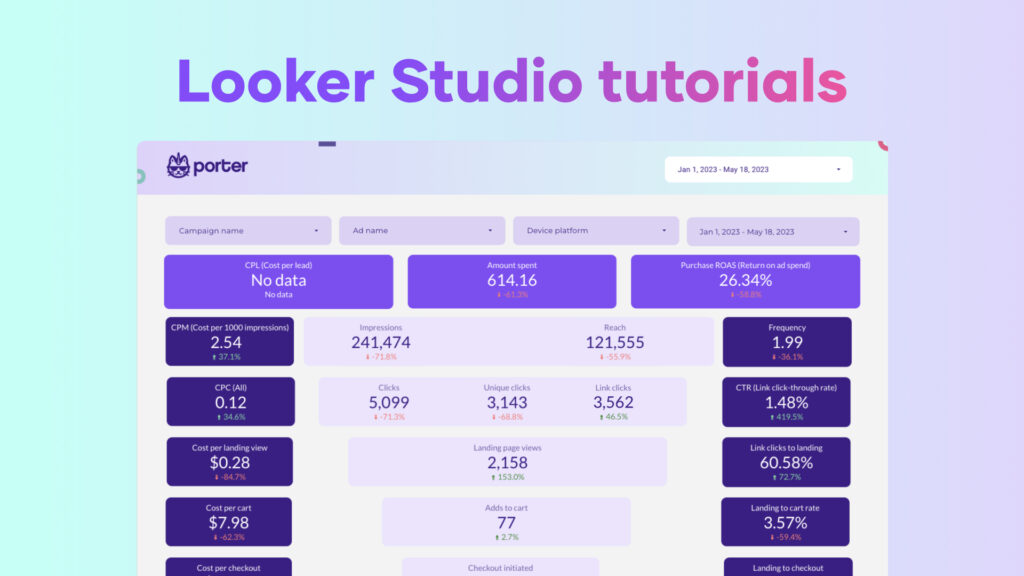
In this Google Data Studio (formerly Looker Studio) tutorial, we will go through all the steps needed to automate your reports and tell stories with actionable visualizations: I also made a complete YouTube video tutorial you can watch: Why does Google Data Studio matter? We’ve already published an article about why businesses—especially marketers—should learn Google […]
How to Create Calculated Fields on Data Studio (2024)
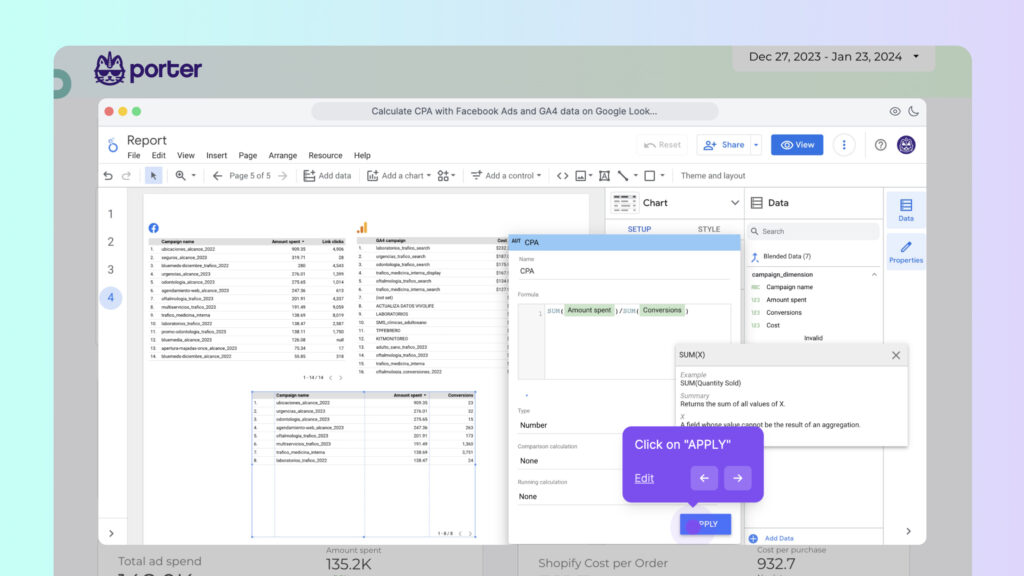
Calculated fields enable you to create new metrics and dimensions from existing data, allowing you to create insightful reports based on your use case and specific data sources. The result? More insightful analysis and better decision-making with the help of chart-level calculated fields. In this tutorial, you will learn how to create custom fields, formulas, […]
How to Use Regex on Data Studio: Regular Expressions with Examples for Marketers
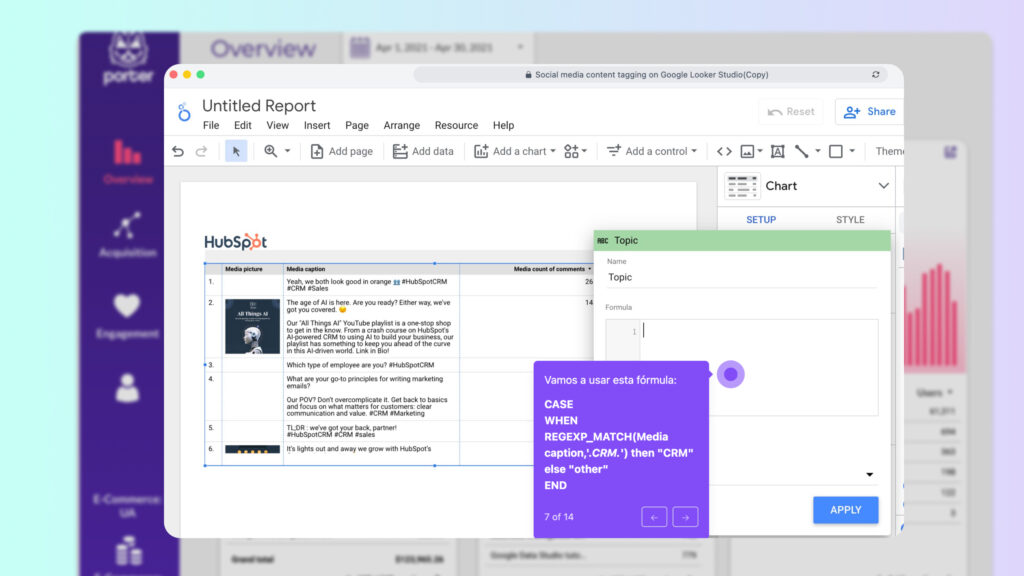
In this article, we’ll show you how to use REGEX on Data Studio (formerly Looker Studio) (previously Google Data Studio) with real step-by-step examples. From one marketer to another: I’ll try to make this easy and quick to implement for you. Personally, I think that using Regular Expressions is a must if you want to […]
How to create filters on Data Studio
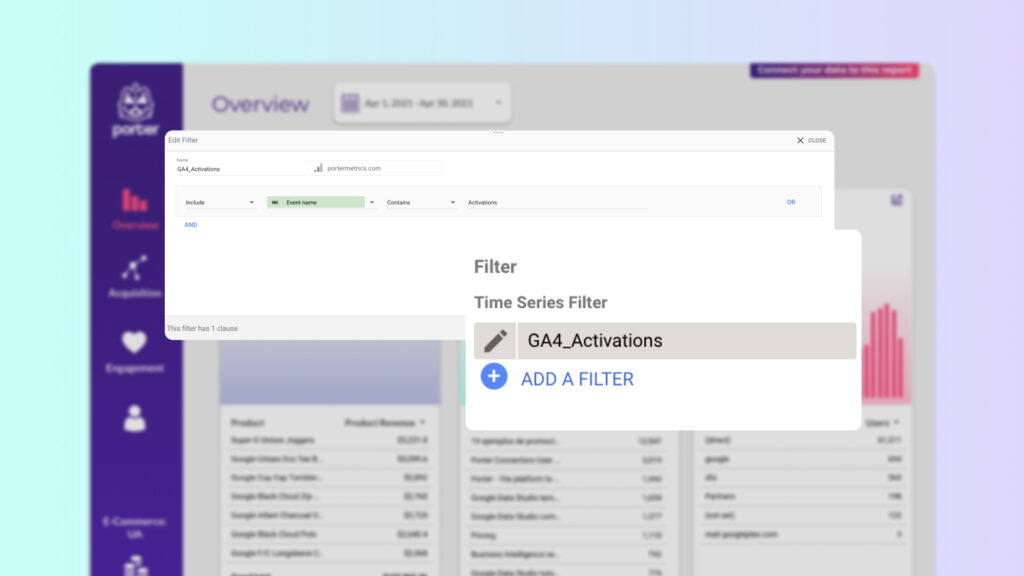
In this comprehensive guide you will learn how to create filters on Data Studio (formerly Looker Studio), based on real examples. I’ll show you how to create basic filters without knowing anything about coding or design. Here you have a step-by-step video on how to create a filter in less than 4 minutes: How do […]
How to design Data Studio reports and customize them
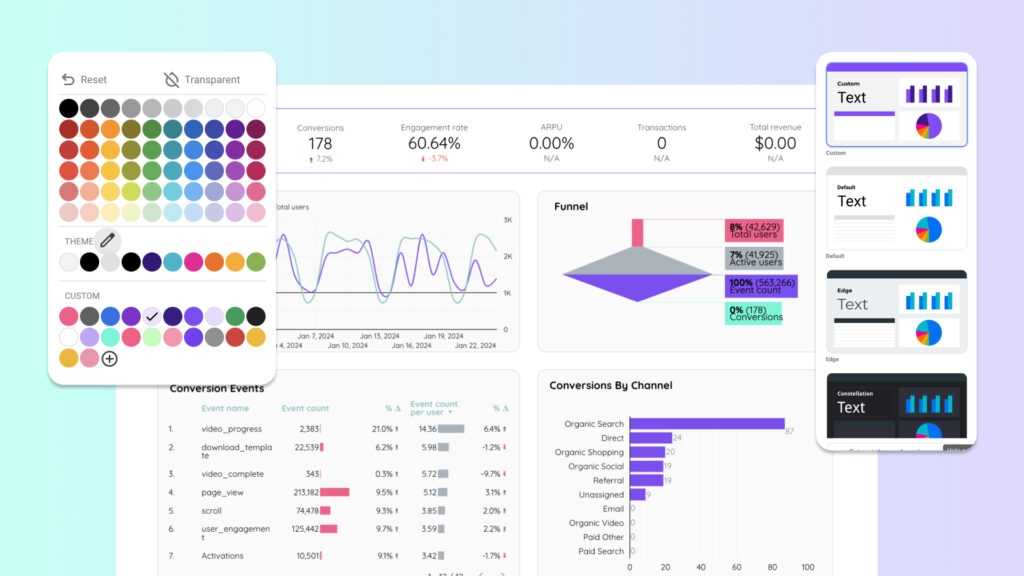
In this tutorial, you’ll learn how to design Data Studio reports, starting from the theme and layout, editing charts, and adding filters and buttons to make them interactive. No good design will save you if you don’t have the fundamentals right, such as the most important metrics and KPIs, and a good narrative to support […]
How to add charts and graphs to Data Studio
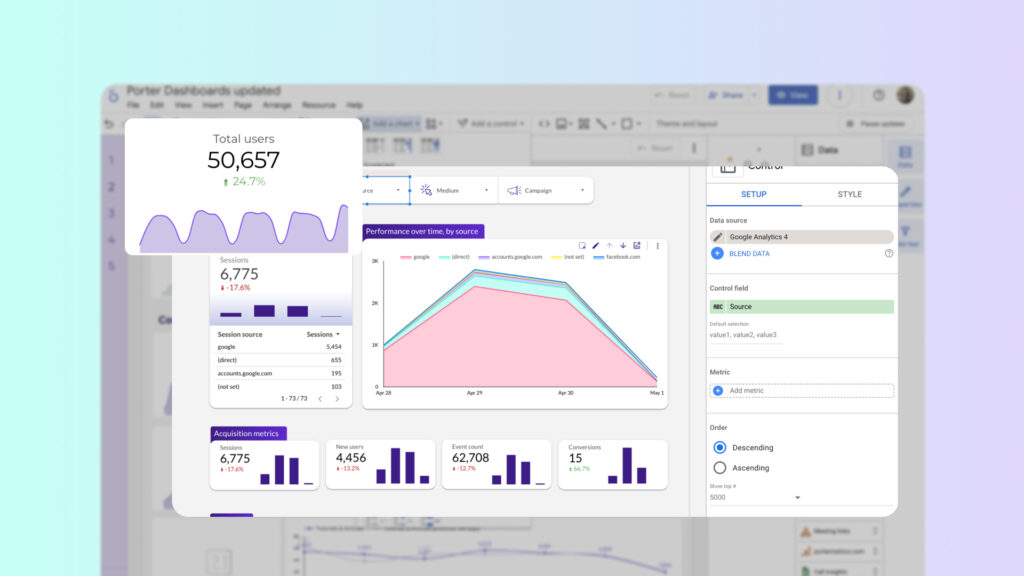
To create a good report you have to understand how to create and edit charts on Data Studio (formerly Looker Studio). If you want better reports, you have to understand: Combining these two ideas will help you create engaging, useful reports. I will cover the step-by-step process of creating charts, the different types, customization options, […]
How to connect data sources to Data Studio
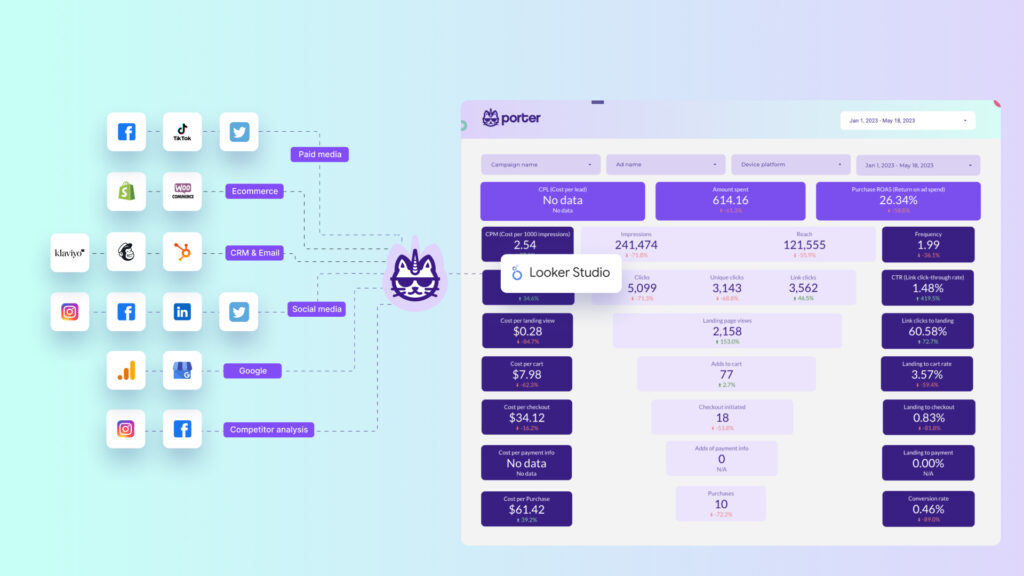
Learn how to connect data to Data Studio (formerly Looker Studio) with this complete step-by-step guide with real examples we have seen at Porter Metrics so you connect your data faster! We made a ‘how to video’ if you prefer to see how we do it! Now, here’s the step-by-step guide. How to connect any […]
How to Share Google Data Studio Reports
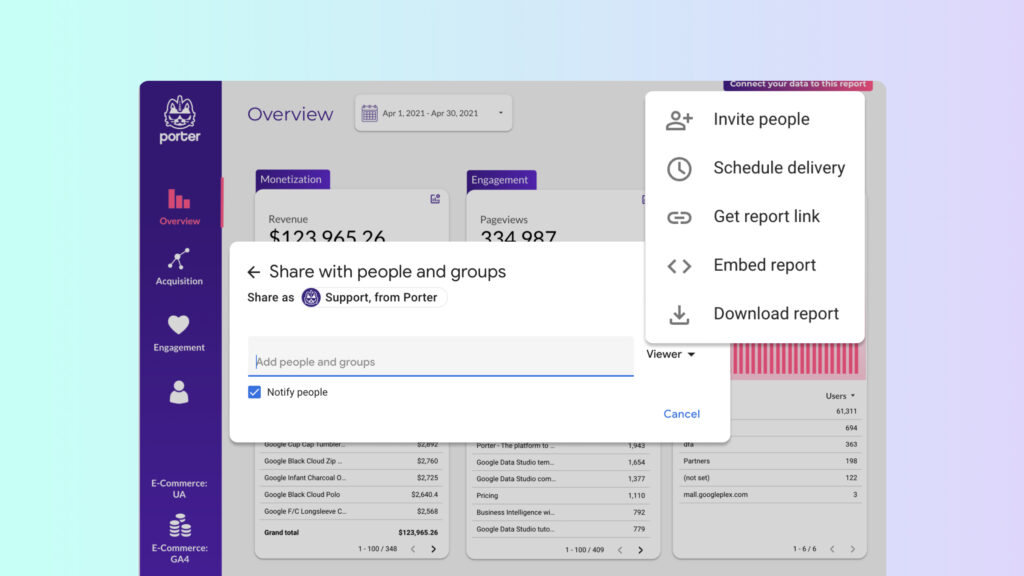
In this tutorial you’ll learn six different alternatives on how to share a Data Studio (formerly Looker Studio) report: Understanding the differences between these sharing options and what they mean for the people who will access your report is essential. I’ll take you through each sharing option in detail, including how to use them, different […]
How to analyze your marketing data: a 5-step framework
To analyze your marketing data following the SUMAS framework, begin by understanding your (S) strategy. This involves identifying key aspects of your company, customers, and competition.; define your (U) use cases between client reporting or performance management; map your (M) metrics between conversion, engagement, and visibility; (A) add context by comparing your data vs goals, […]