


To connect Google Business Profile to Looker Studio, visit portermetrics.com, start a free trial or use the free-forever plan, and sign in with the same Google account you use for Looker Studio. Select a single data source, choose the Google Business Profile connector, click Add Account, and grant permissions to the Google account managing your locations. Porter Metrics supports multiple accounts and locations—select one or several, then click Create Report. When the Looker Studio window opens, your connection is complete, and you can save and share your interactive dashboard to monitor your business’s visibility, reviews, and conversions across all locations.
Free and paid ways to Connect Google Business Profile to Looker Studio
The free plan lets you connect up to 3 Google Business Profile accounts to Looker Studio, Google Sheets, or BigQuery with unlimited use and 30 days of historical data.
Looker Studio Connector (Recommended)
Pulls data directly from the Google Business Profile API with drag-and-drop functionality and fresh data. Loading speed varies with data volume—use Sheets or BigQuery for large accounts.
Google Sheets Import
import data automatically via add-on or manually import CSV files from Google Business Profile (free but manual), then connect Sheets to Looker Studio with Google’s native connector. Advantages include instant load times for small datasets and data editing (goals, markups, commissions); downsides include reduced granularity (only use fields from Sheets queries) and freshness dependent on sync frequency. Manual CSV uploads have additional limitations: 100-upload limit, 100MB max per file, and identical file structures required.
Google BigQuery
Best performance and scalability for large data volumes, but typically requires BigQuery knowledge and maintenance. Data freshness depends on sync frequency to avoid API limits. Porter simplifies this by handling all transformations automatically—unlike other tools that import raw tables requiring manual work, Porter makes it completely no-code.
Porter Metrics offers all three methods. This tutorial focuses on the direct Google Business Profile connector for Looker Studio.
Free Google Business Profile connector for Looker Studio
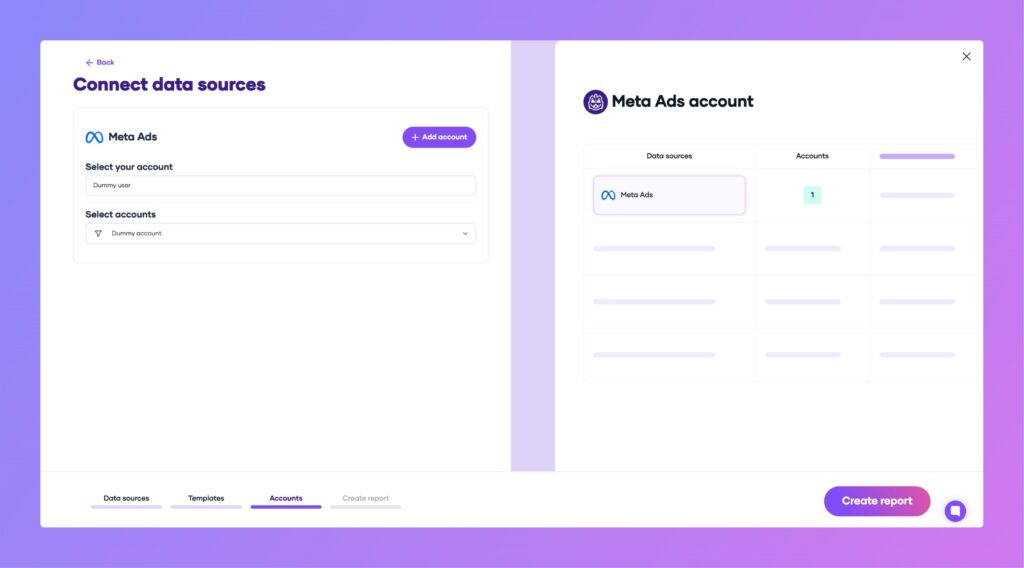
To connect your Google Business Profile data to Looker Studio with Porter Metrics, start a free trial (or use the free-forever plan) and sign in with the same Google account you use for Looker Studio. Select a single data source, choose the Google Business Profile connector, click Add Account, and grant permissions to the Google account managing your locations. Porter Metrics supports multiple accounts and locations; you can select one or several. After selecting your locations, click Create Report. When Looker Studio opens, your connection is complete. Click Save and Share to publish your report.
Step 1: Connect your Google account
Connect the Google account that manages your Business Profile locations. This should be the same account you use for Looker Studio to ensure seamless integration and access to all your locations.
Note: Porter Metrics allows you to connect and report on multiple Google Business Profile accounts and locations in a single dashboard.
Step 2: Select locations
Choose the locations you want to include in your report. You can select a single location for store-level analysis or multiple locations for a franchise or multi-location overview. Porter automatically blends data from all selected locations.
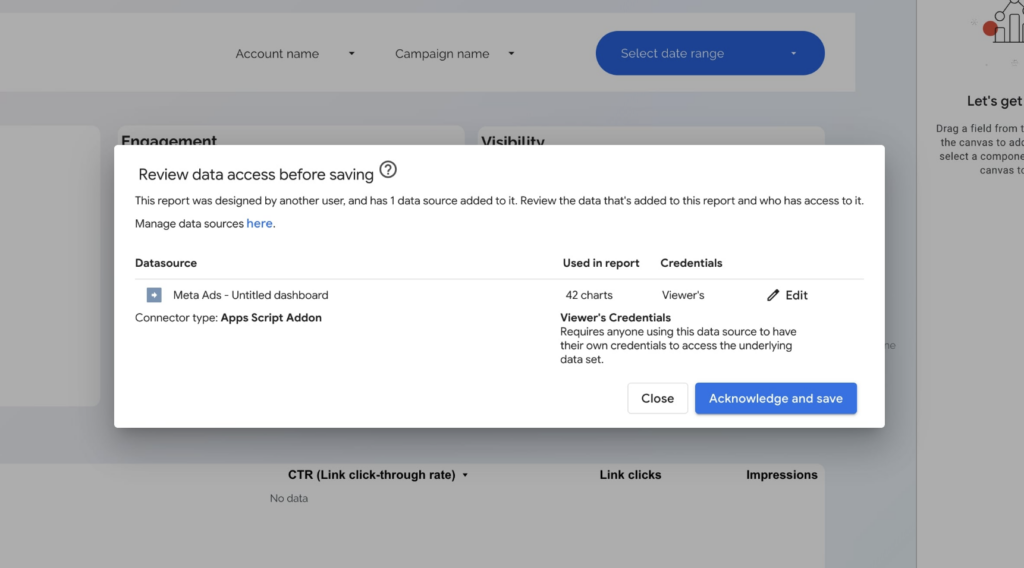
Step 3: Create and authorise your report
Click “Create Report” to be redirected to Looker Studio. Make sure you are logged in with the same Google account you used to connect your Business Profile. This ensures your data loads correctly in Looker Studio.
Important: If you are logged into multiple Google accounts, Google may return an error. To avoid this:
- Use a browser session with only one Google account logged in
- Or ensure your preferred account is listed first during Google authentication
Once your report loads in Looker Studio, click “Save and Share” in the top right corner to publish and share your dashboard.
What’s included in the Google Business Profile template?
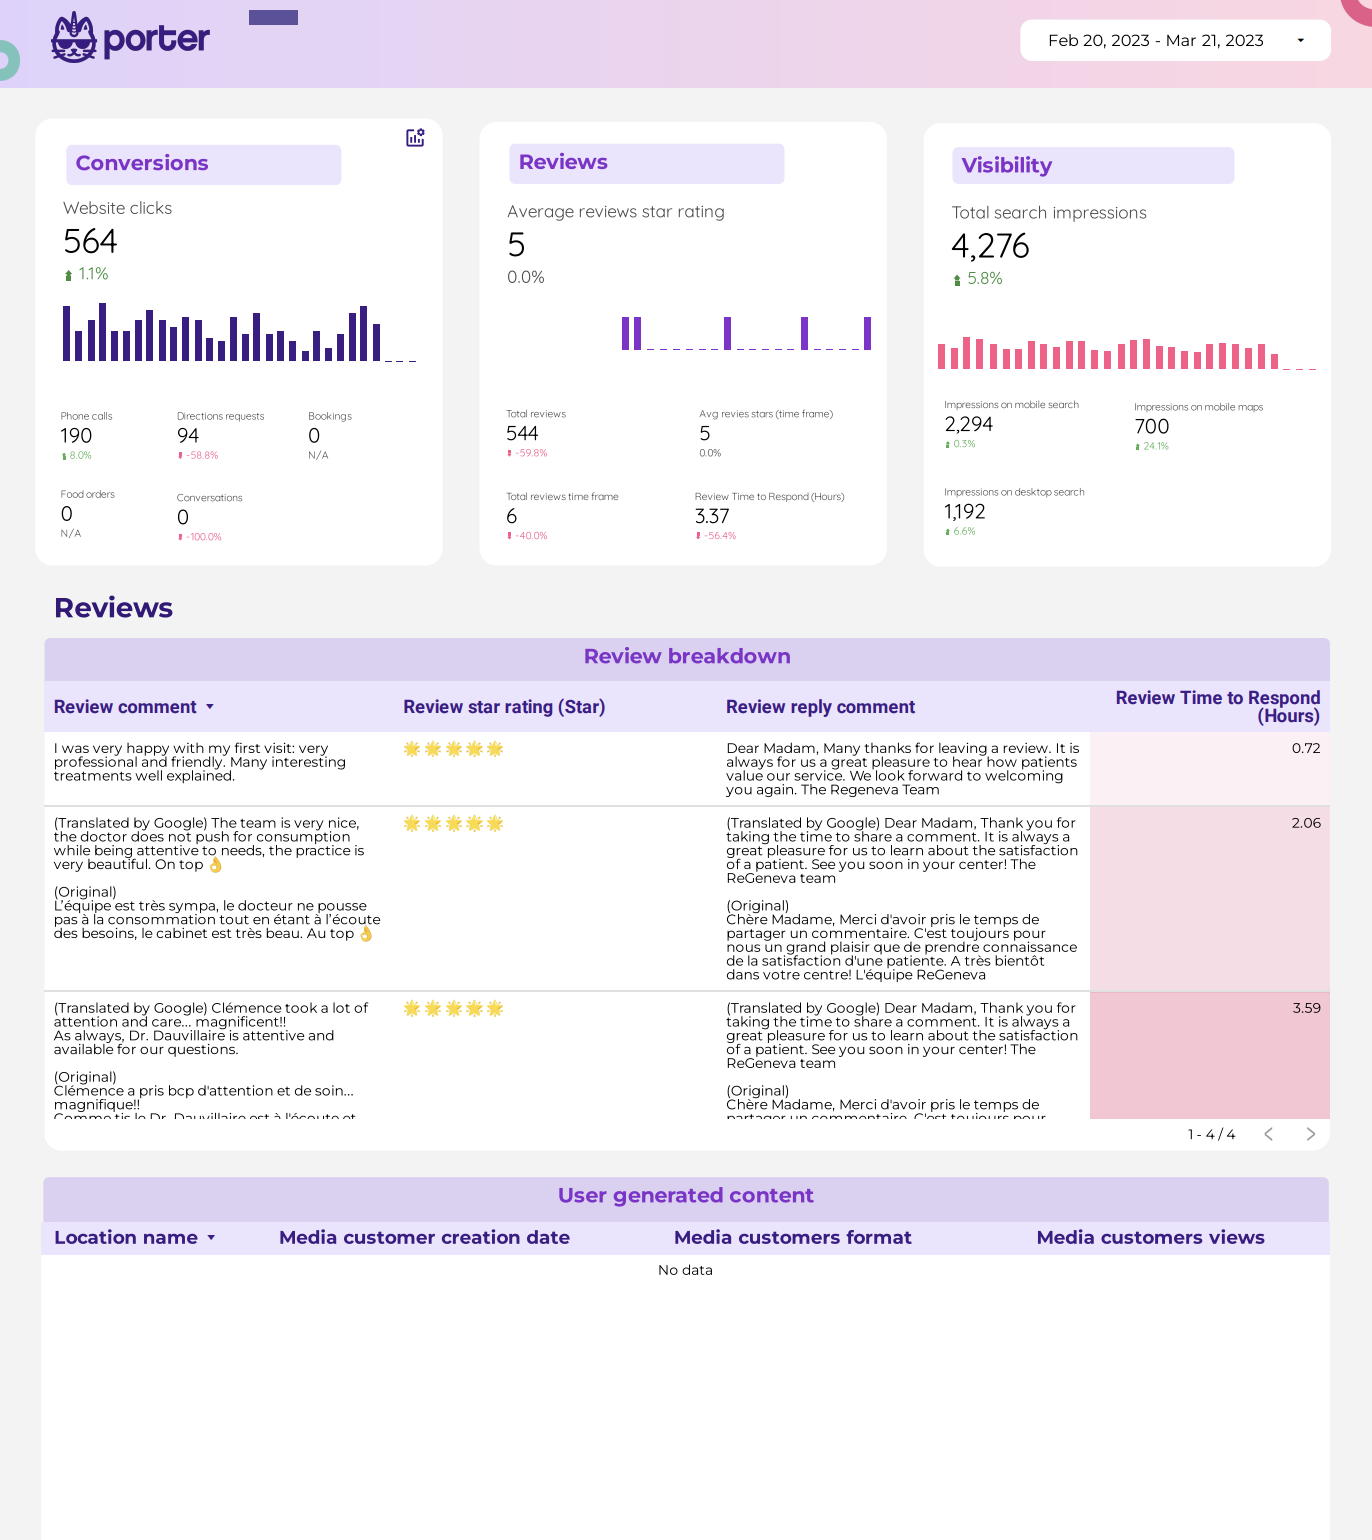
The template organizes your Business Profile metrics into three main groups:
- Conversions: Website clicks, direction requests, phone calls, and bookings—actions that generate demand.
- Reviews: Total reviews, reviews over time, average response time, ratings, and comments to monitor reputation and engagement.
- Visibility: Impressions from Google Search and Maps (mobile and desktop), plus engagement with photos or posts.
The dashboard is interactive: filter by location, adjust the date range, and share your report by email, link, or PDF export. All charts update dynamically as you change filters or date ranges.
Template views and customization
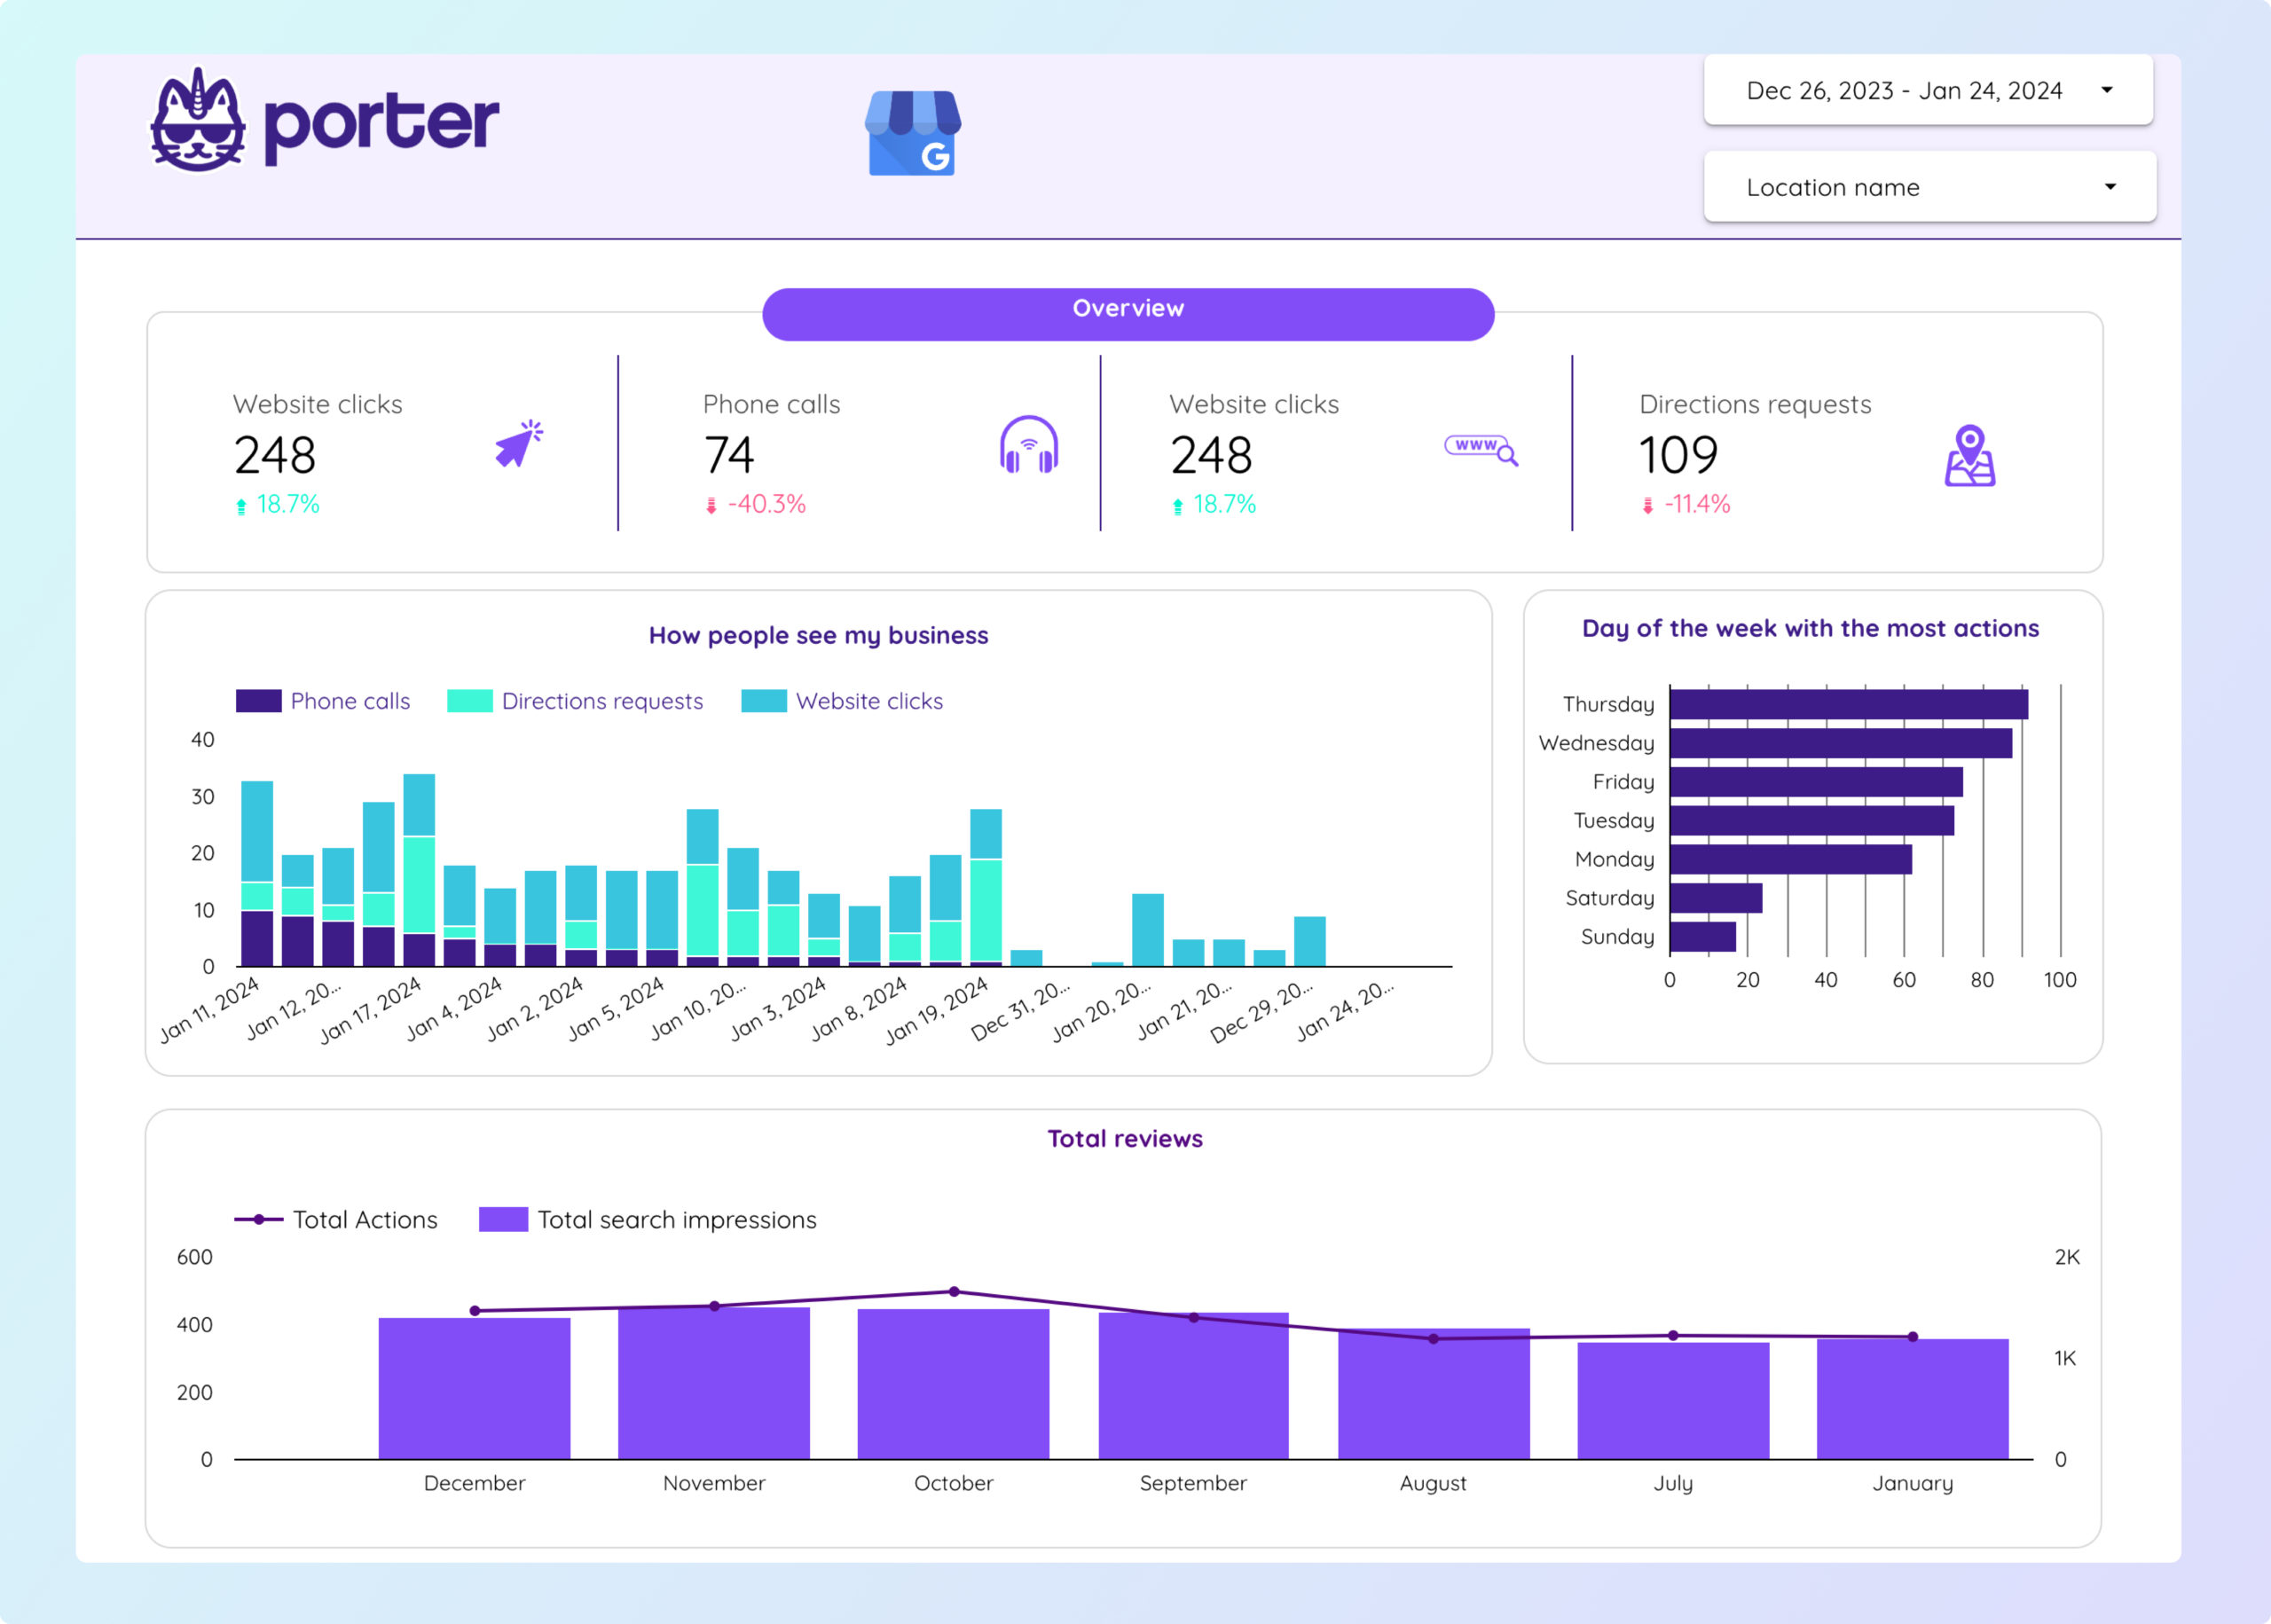
- Overview: Combined metrics for conversions, visibility, and reviews.
- Reviews: Detailed breakdown with reviewer name, rating, comment, and response time.
- Visibility: Impressions by device and platform (Maps vs Search, desktop vs mobile) with time series trends.
- Conversions: Website clicks, calls, direction requests, and bookings over time.
- Audit: Table with location details (name, URL, address, phone, hours, etc.) to verify data consistency.
Customize your dashboard directly in Looker Studio: add new pages, create scorecards for KPIs (like direction requests, website clicks, total impressions, and reviews), and style your dashboard with backgrounds, borders, and sparklines. Copy and paste scorecards to quickly build multiple KPIs and enable period-over-period comparisons.
Add tables or charts to analyze specific data. For reviews, create tables segmented by comment, rating, date, and reviewer photo. For visibility, use time series charts broken down by source (mobile/desktop, search/maps). Use bar charts or tables to explore conversions and their sources.
The template helps you identify where your traffic comes from (e.g., most impressions from Google Maps on mobile) and which metrics to optimize, such as fixing incorrect directions or focusing on platforms with higher engagement.
Use the audit table to track location-specific fields (name, URL, phone, hours, categories, and more) to ensure data accuracy for SEO and Google search performance. With Porter Metrics, you can centralize multiple locations, monitor visibility, reputation, and conversions, and customize dashboards for local SEO directly in Looker Studio.
Google Business Profile dashboard templates
Once you connect your Google Business Profile dashboard template, you’ll access these use cases:
Google Business Profile dashboard template
Monitor your business locations’ performance in one place. Track impressions, actions (calls, website visits, driving directions), bookings, and followers. Segment by location, city, or region, and analyze trends over time. Includes account and location details, operating hours, and phone numbers to help you manage multiple profiles efficiently.
Review performance dashboard
Analyze your Google reviews in detail. Track total review count, average rating, and review trends over time. Drill down by reviewer, review content, and response times. Identify top-performing locations and respond to feedback faster to improve your reputation and customer experience.
Local SEO dashboard
Measure your local SEO impact by tracking search impressions, actions, and engagement across devices and platforms. Visualize how customers find your business on Maps and Search, and monitor the effectiveness of your local posts, offers, and events. Use location and audience insights to optimize your local marketing strategy.
Visit our Google Business Profile template gallery to explore more Looker Studio dashboards.
How to build a Google Business Profile dashboard
To connect your Google Business Profile data to Looker Studio, visit portermetrics.com, start a free trial (or use the free-forever plan), and sign in with the same Google account you use for Looker Studio. Select the Google Business Profile connector, add your account, and grant permissions. Porter Metrics supports multiple accounts and locations—select one or several, then click Create Report. When Looker Studio opens, your connection is ready. Save and share to publish your report.
The template organizes your Business Profile metrics into three groups: Conversions (website clicks, direction requests, calls, bookings), Reviews (total reviews, ratings, response time, comments), and Visibility (impressions from Search and Maps, engagement with photos or posts). You can filter by location, combine multiple stores, and adjust the date range to analyze performance by week, month, or year.
Step 1: Add charts to visualize Google Business Profile KPIs
Add scorecards, time series, tables, and bar charts to visualize your Google Business Profile data in Looker Studio.
- Tables: Combine location details (name, address, phone, hours) and review data (reviewer, rating, comment, response time) to monitor consistency and reputation.
- Time series: Track trends in impressions, website clicks, direction requests, and calls over time to spot seasonality or growth.
- Scorecards: Show KPIs like total reviews, average rating, total impressions, and direction requests, with period-over-period comparison.
- Bar charts: Compare conversions or reviews by location to identify top-performing stores or areas needing attention.
- Pie charts: Show the share of impressions from Google Search vs. Maps, or mobile vs. desktop.
- Geo charts: Visualize performance by region or city to identify local SEO opportunities.
Step 2: Add context with comparisons
Add goals, reference lines, and conditional formatting to compare Google Business Profile metrics and add context.
- Comparison date range: Compare KPIs like impressions, reviews, or conversions against the previous period to spot performance shifts for your business locations.
- Reference lines: Add a target or average line on a time series to see if daily calls or direction requests meet your goals.
- Conditional formatting: Highlight locations with low ratings or high response times in red, and those with high engagement in green.
- Goal tracking: Track progress toward targets such as monthly review count, average rating, or total conversions.
Step 3: Make dashboards interactive
Interactive elements make Google Business Profile dashboards easier to explore:
- Buttons: Add buttons to switch between overview, reviews, visibility, and audit pages, or to reset filters.
- Date range controls: Change the time period shown in the report, e.g., last 7 days, last 30 days, or custom ranges for business performance.
- Dropdowns: Filter by location, business category, or review rating to analyze specific segments.
- Cross‑filtering: Click a location or review to filter all charts and tables to that selection for deeper analysis.
Step 4: Design and customize your dashboard
Learn to design your Looker Studio reports and follow best practices for dashboard design for Google Business Profile data.
- Theme and layout: Control colors, backgrounds, borders, and headers for a consistent look across your business locations.
- Page navigation: Structure the dashboard into sections like Overview, Reviews, Visibility, Conversions, and Audit.
- Shapes and lines: Use visual elements to highlight key metrics or trends, such as spikes in reviews or drops in visibility.
- Copy-paste styling: Apply the same style from one chart to others for consistency across all locations and metrics.
- Conditional formatting: Color cells or metrics based on performance, e.g., highlight locations with missing hours or inconsistent data.
- Modern charts: Enable advanced styling options like gradients and rounded elements for a polished look.
- Report-level elements: Keep elements like your business logo, title, and date control consistent across all pages.
Step 5: Share your dashboard
Learn to share your Looker Studio reports with your team or clients:
- Invite people via email: Add team members or stakeholders as editors or viewers, just like Google Docs.
- Draft mode: Edit your dashboard without showing changes to viewers until you’re ready to publish.
- Schedule email delivery: Automatically send PDF reports to your team or clients on a set schedule (daily, weekly, monthly).
- Share via link: Copy a report link to share with anyone, with optional access controls.
- Download as PDF: Export your dashboard as a PDF for offline sharing or presentations.
- Embed report: Use an embed code or full-screen URL to display your dashboard on your website or internal portal.
Google Business Profile KPIs
The Google Business Profile connector brings all metrics and dimensions from your business listings, including:
Audience Insights
- Impressions: Total search impressions, with breakdowns by device and platform (Desktop Maps, Desktop Search, Mobile Maps, Mobile Search).
- Actions: Driving directions requests, phone calls, website clicks.
- Bookings & Orders: Business bookings, conversations, and food orders made through your profile.
- Followers: Number of users following your business profile.
Engagement
- Reviews: Total review count, average rating, and review content (comments, timestamps, reviewer details).
- Review Replies: Responses to customer reviews and response times.
- Local Posts: Post types, summaries, media, and engagement with posts (events, offers, and updates).
Visibility
- Profile Metrics: Impressions, reach, and frequency of your business listing in Google Search and Maps.
- Media: Views on photos and videos, total media item count, and media ownership details.
Dimensions
Segment data by:
- Time: Hour, Date, Week, Month, Quarter, Year
- Account: Account ID, Account Name, Account State
- Location: Location ID, Name, Store Code, Website URL, Address, Coordinates, Phone
- Status & Capabilities: Pending edits, duplicates, Google updates, business call capability, food menu capability, local post capability
- Audience: Device, platform, and follower demographics (where available)
Custom fields
- Custom Metrics: Build new KPIs such as review response rate, average time to respond to reviews, post engagement rate, or impressions per follower.
- Custom Dimensions: Use REGEX and naming conventions to group by location, region, or business type. Filters: Apply filters at the chart, page, or report level (e.g., Location Name contains “Downtown”).
- Data blending: Blend Google Business Profile data with social media metrics (e.g., Facebook, Instagram) for unified reporting on local engagement and brand presence.


