


Looker Studio Connector (Recommended)
Google Sheets Import
import data automaticallyconnect Sheets to Looker Studio with Google’s native connector. Advantages include instant load times for small datasets and data editing (goals, markups, commissions); downsides include reduced granularity (only use fields from Sheets queries) and freshness dependent on sync frequency. Manual CSV uploads have additional limitations: 100-upload limit, 100MB max per file, and identical file structures required.Google BigQuery
Best performance and scalability for large data volumes, but typically requires BigQuery knowledge and maintenance. Data freshness depends on sync frequency to avoid API limits. Porter simplifies this by handling all transformations automatically—unlike other tools that import raw tables requiring manual work, Porter makes it completely no-code.
single data source as your integration.Step 1: Sign in with your Google account
Step 2: Select your GA4 account and property
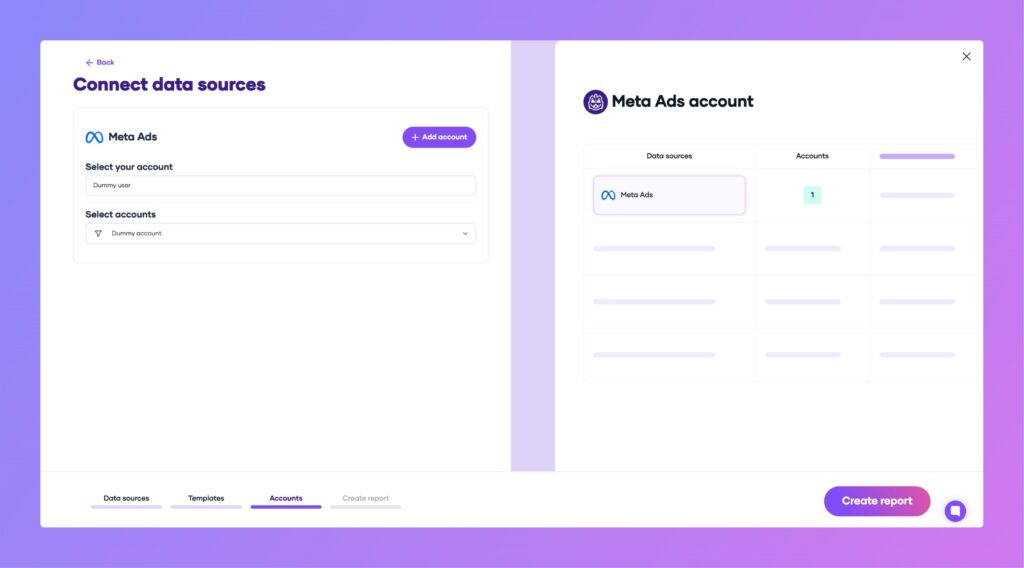
Step 3: Authorize and load your report in Looker Studio
After clicking “Create report,” Looker Studio will open and load your GA4 data. If prompted, ensure you authorize Porter Metrics with the same Google account used for Looker Studio.
Tip: For a smooth connection, use a browser session with only one Google account logged in, or make sure your preferred account is listed first during authentication.
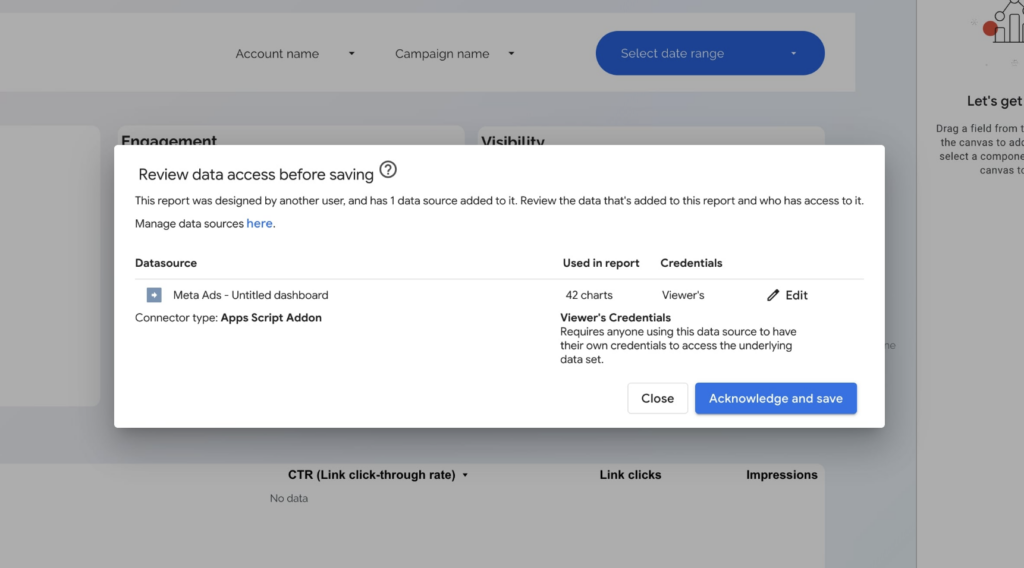
Once the report loads, click “Save and Share” in the top right corner, then “Acknowledge and Save” to complete the connection.
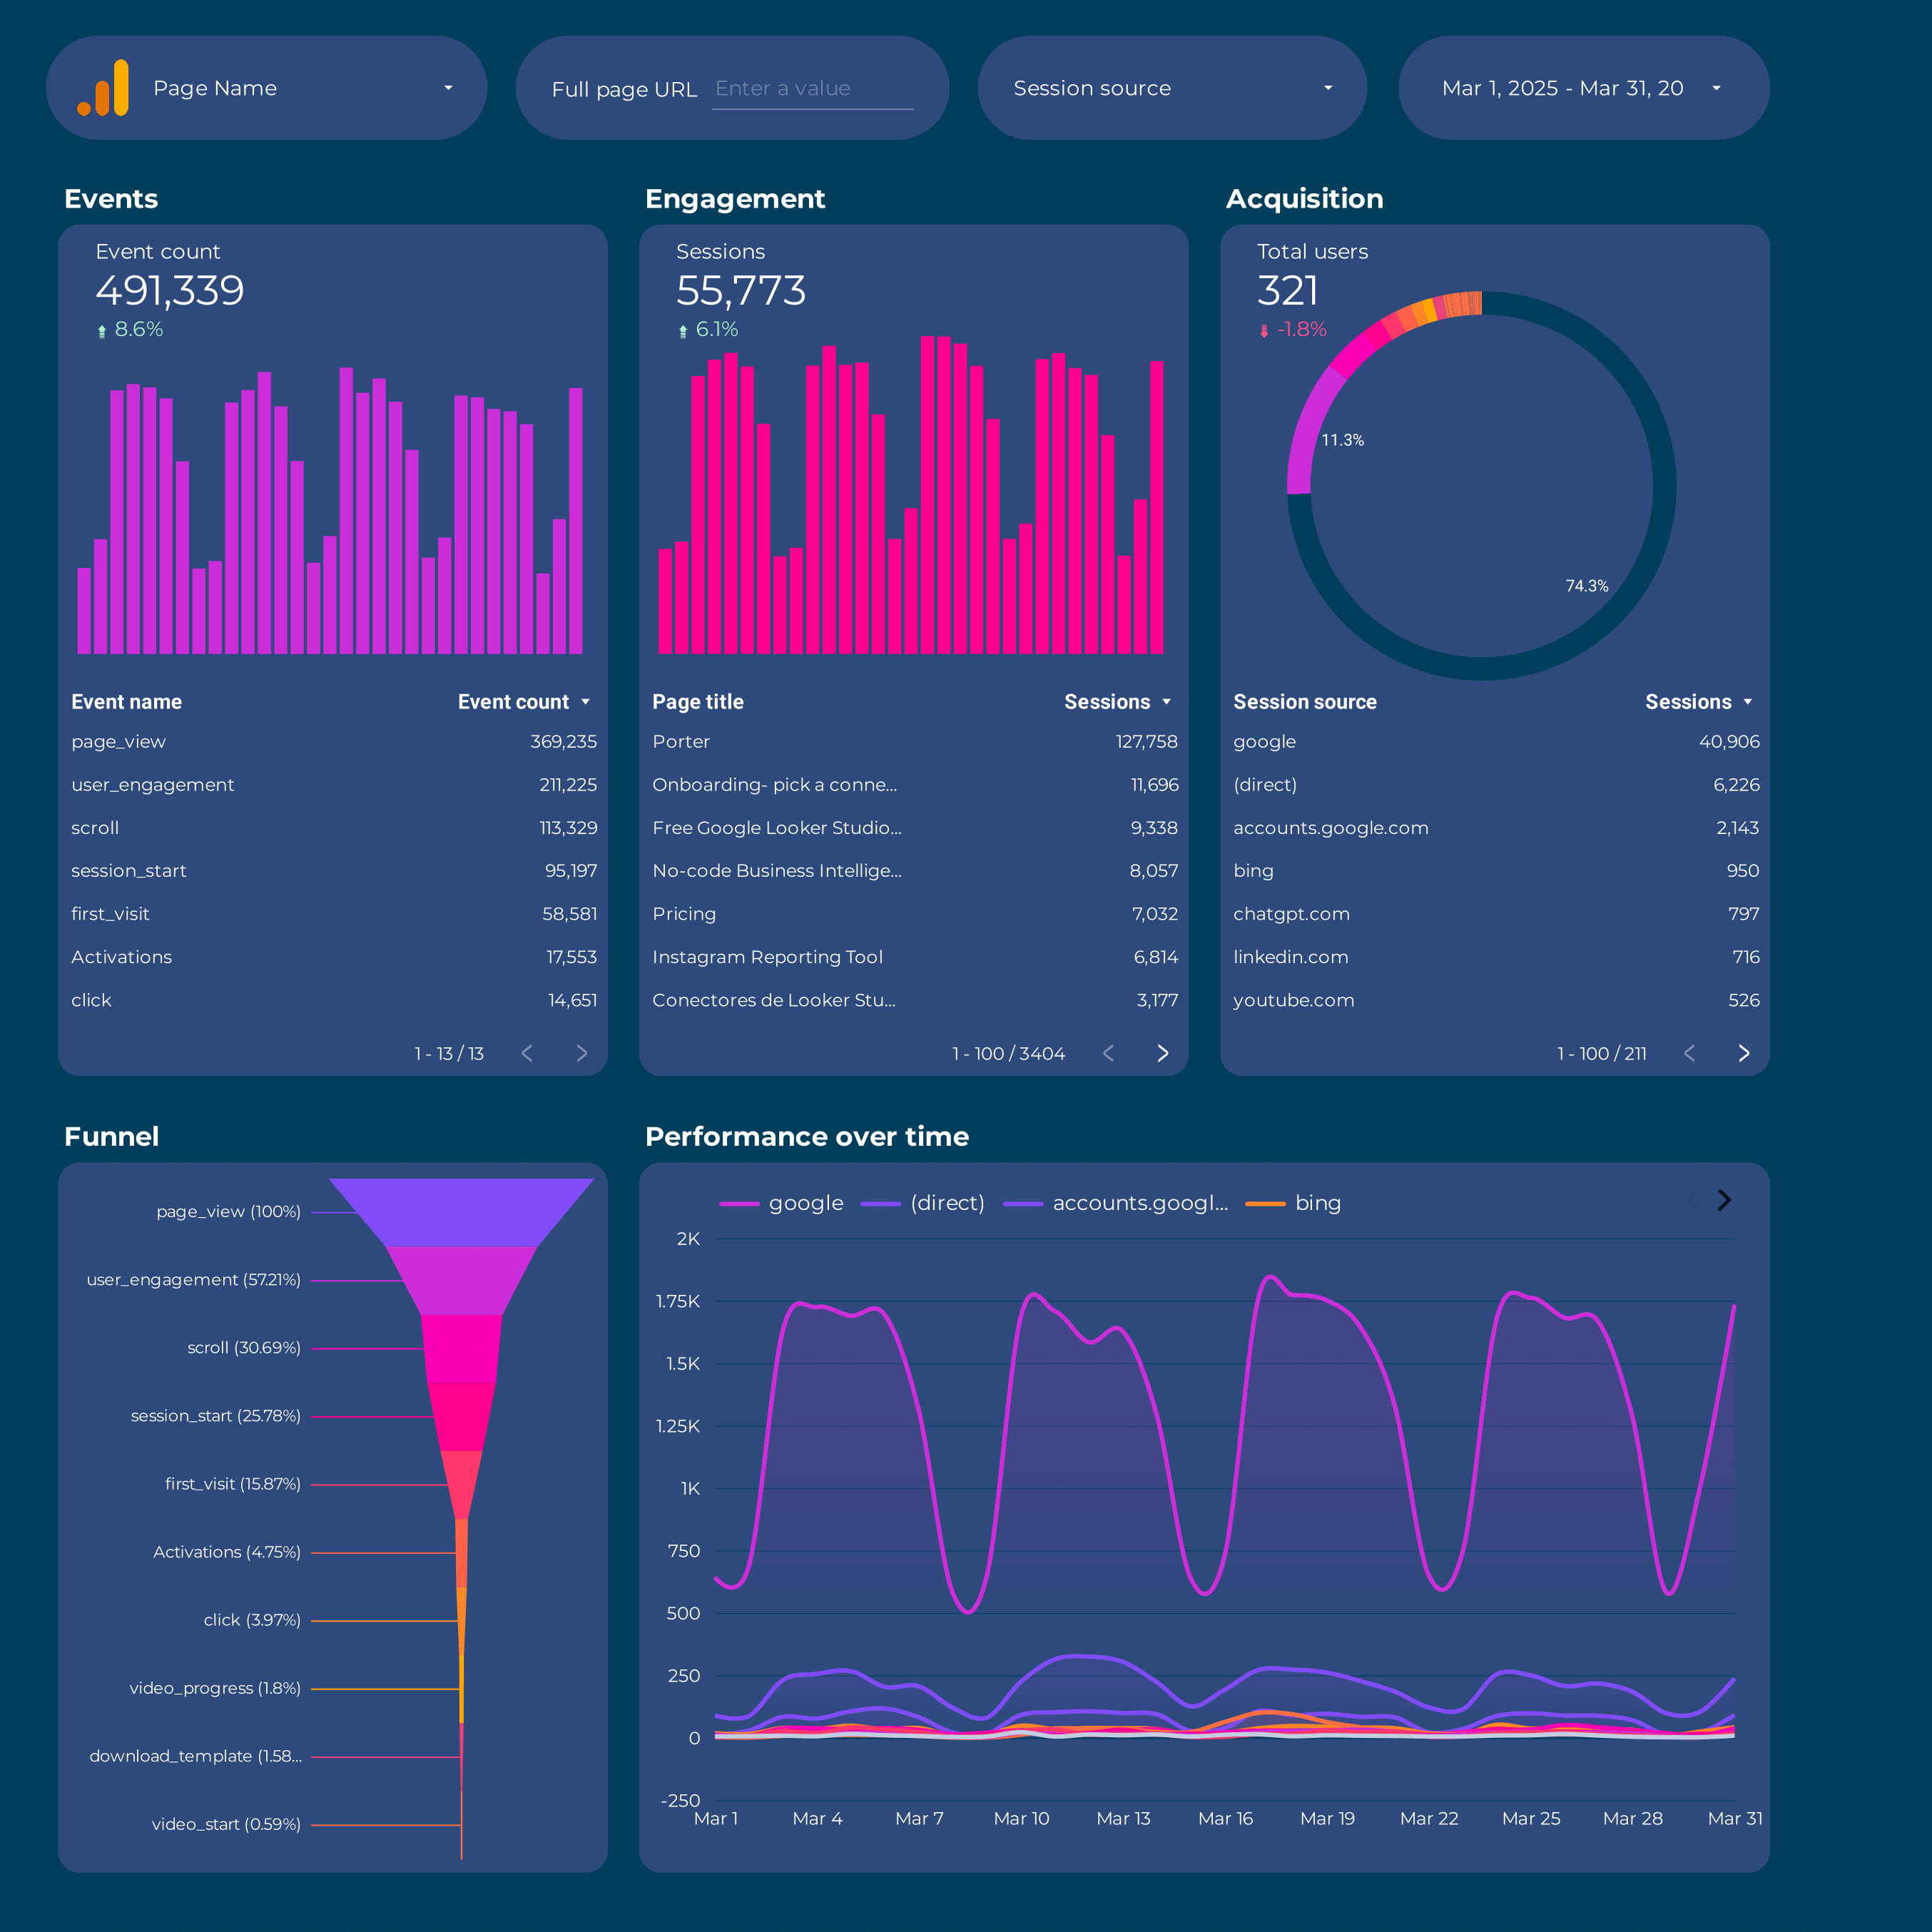
What’s included in the GA4 Looker Studio template?
- Conversions & Events: Visualize total and key events over time, broken down by event name.
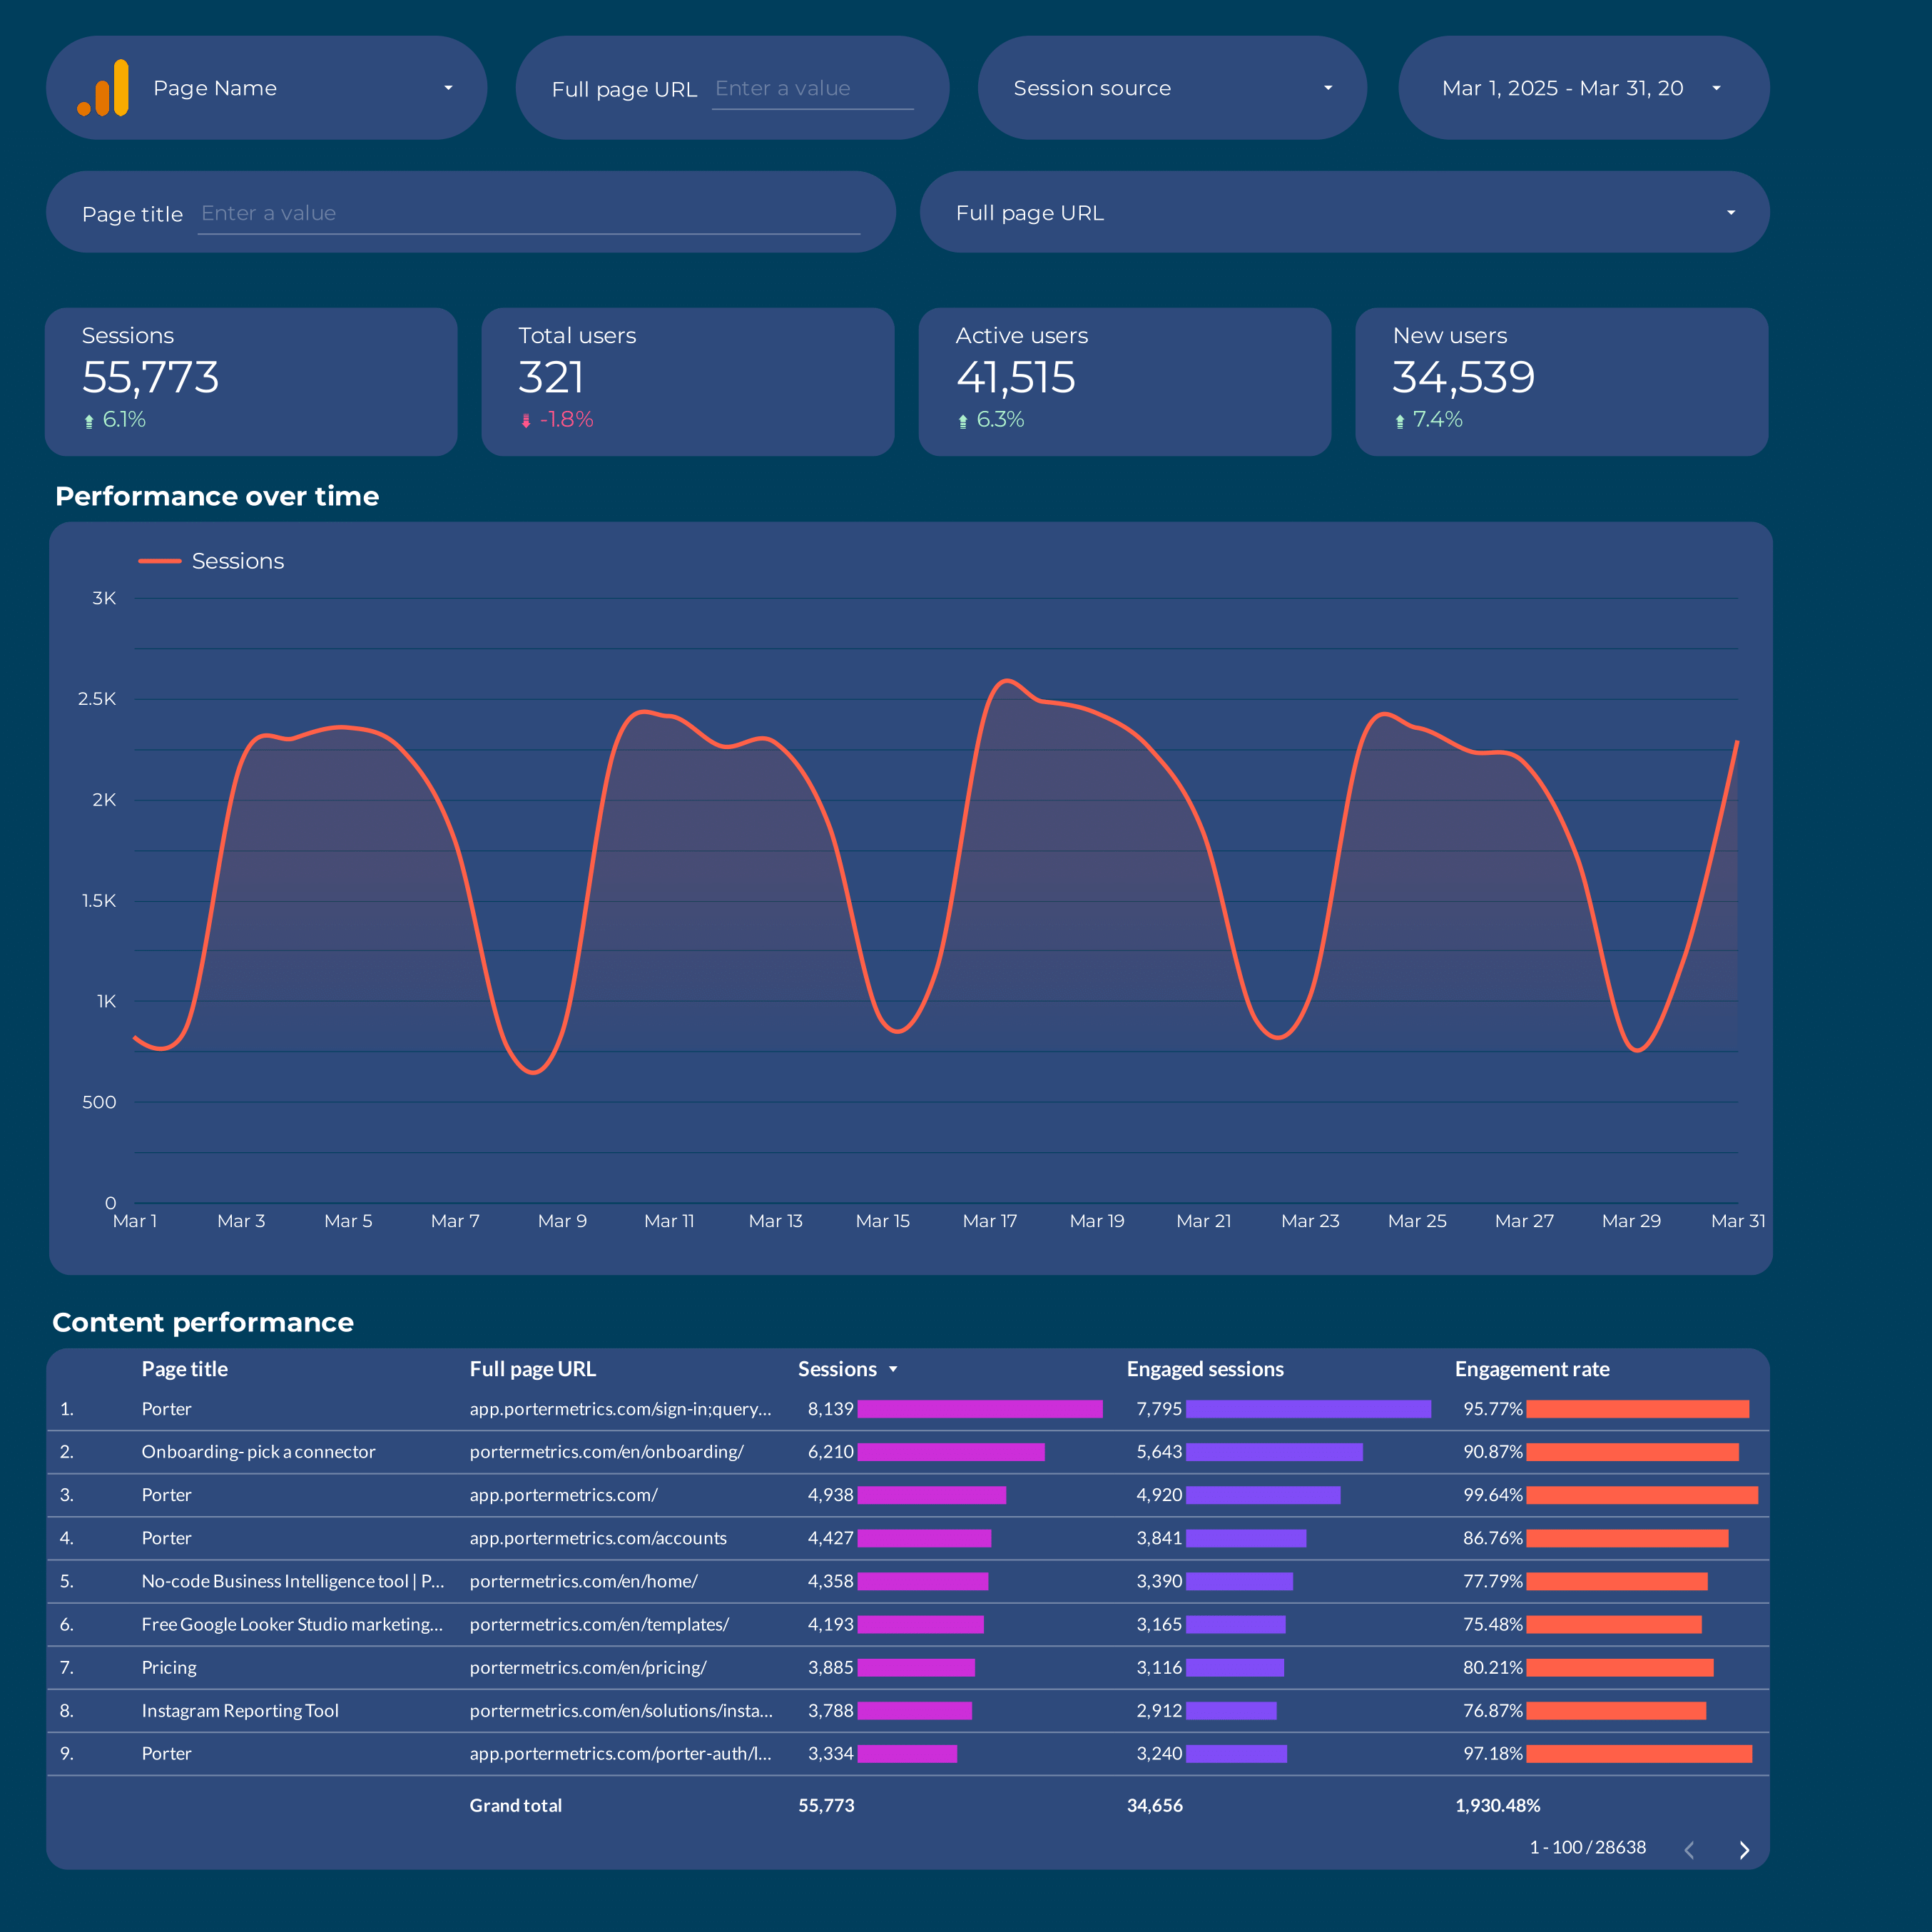
- Engagement: See sessions and views by time and page title, highlighting top-performing content.
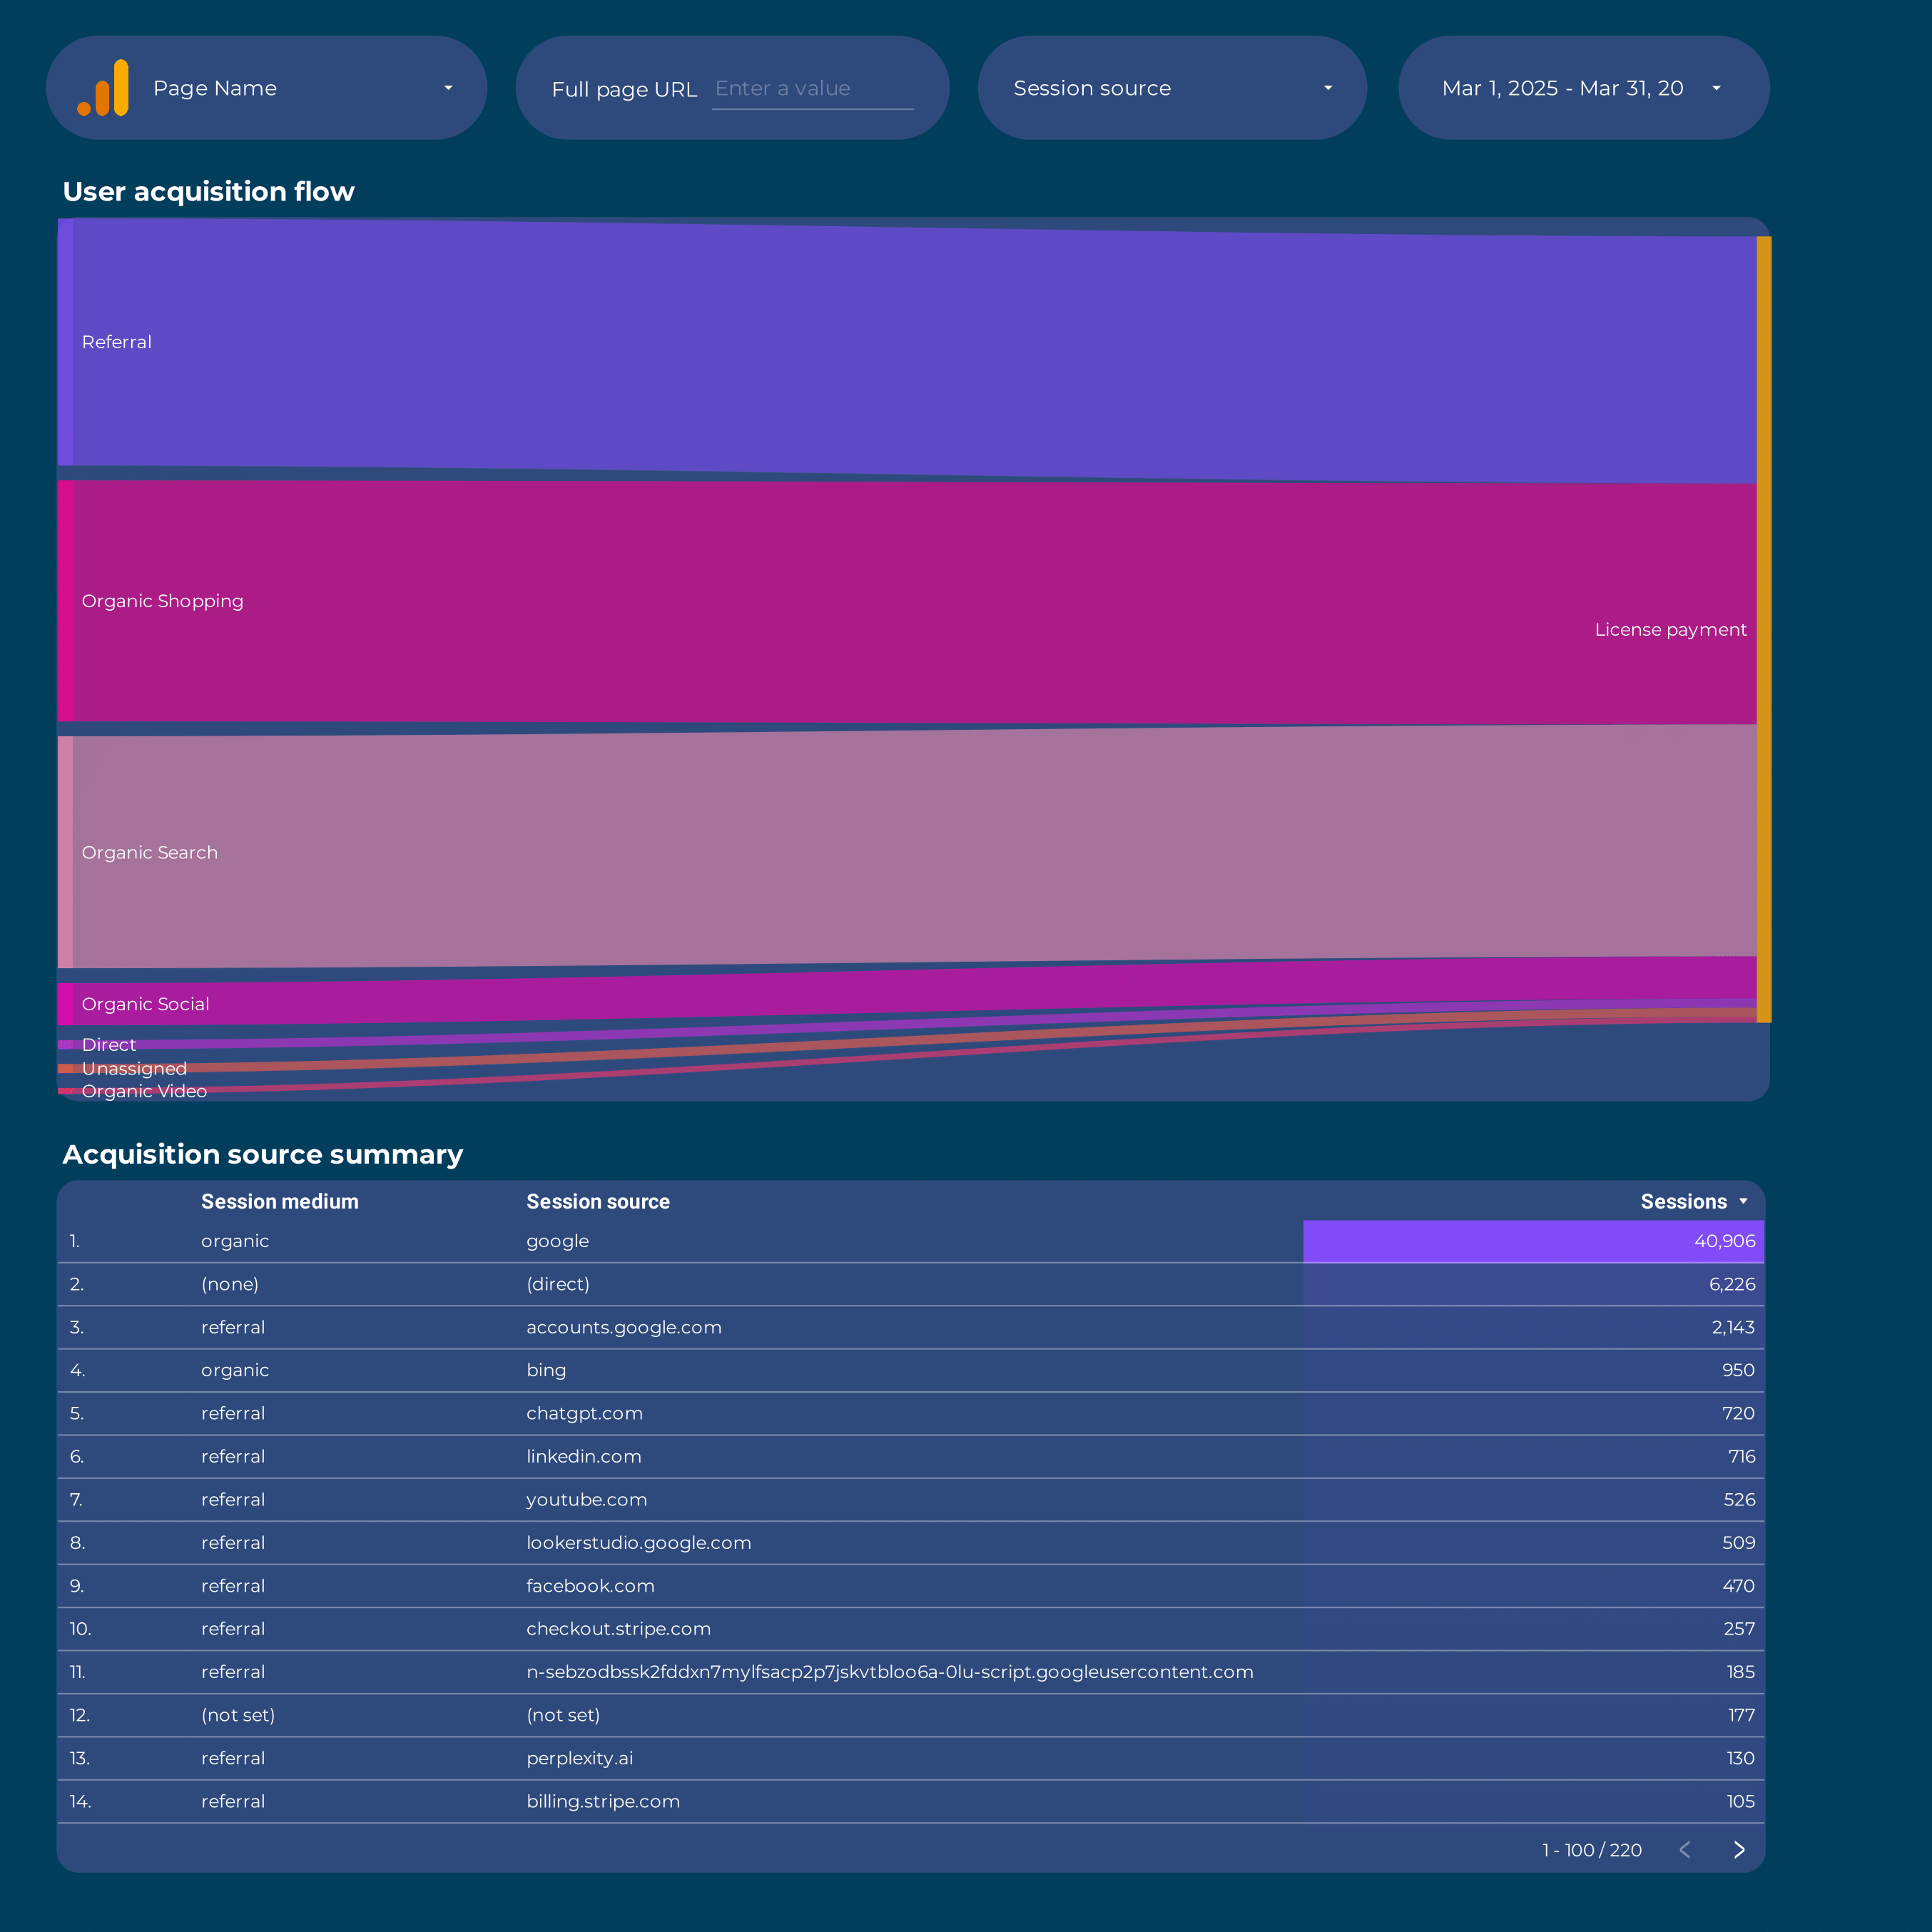
- Acquisition: Analyze users and sessions by source/medium, including organic, paid, referral, and AI search engines like ChatGPT.
- Funnels & Flows: Track event sequences and acquisition flows to understand user journeys and which sources drive conversions.
- AI Traffic: Dedicated page to monitor sessions from AI-based search engines (ChatGPT, Perplexity, Gemini, Copilot), with time series and landing page breakdowns.
- Content Performance: Table of page URLs/titles with sessions and engagement rates.
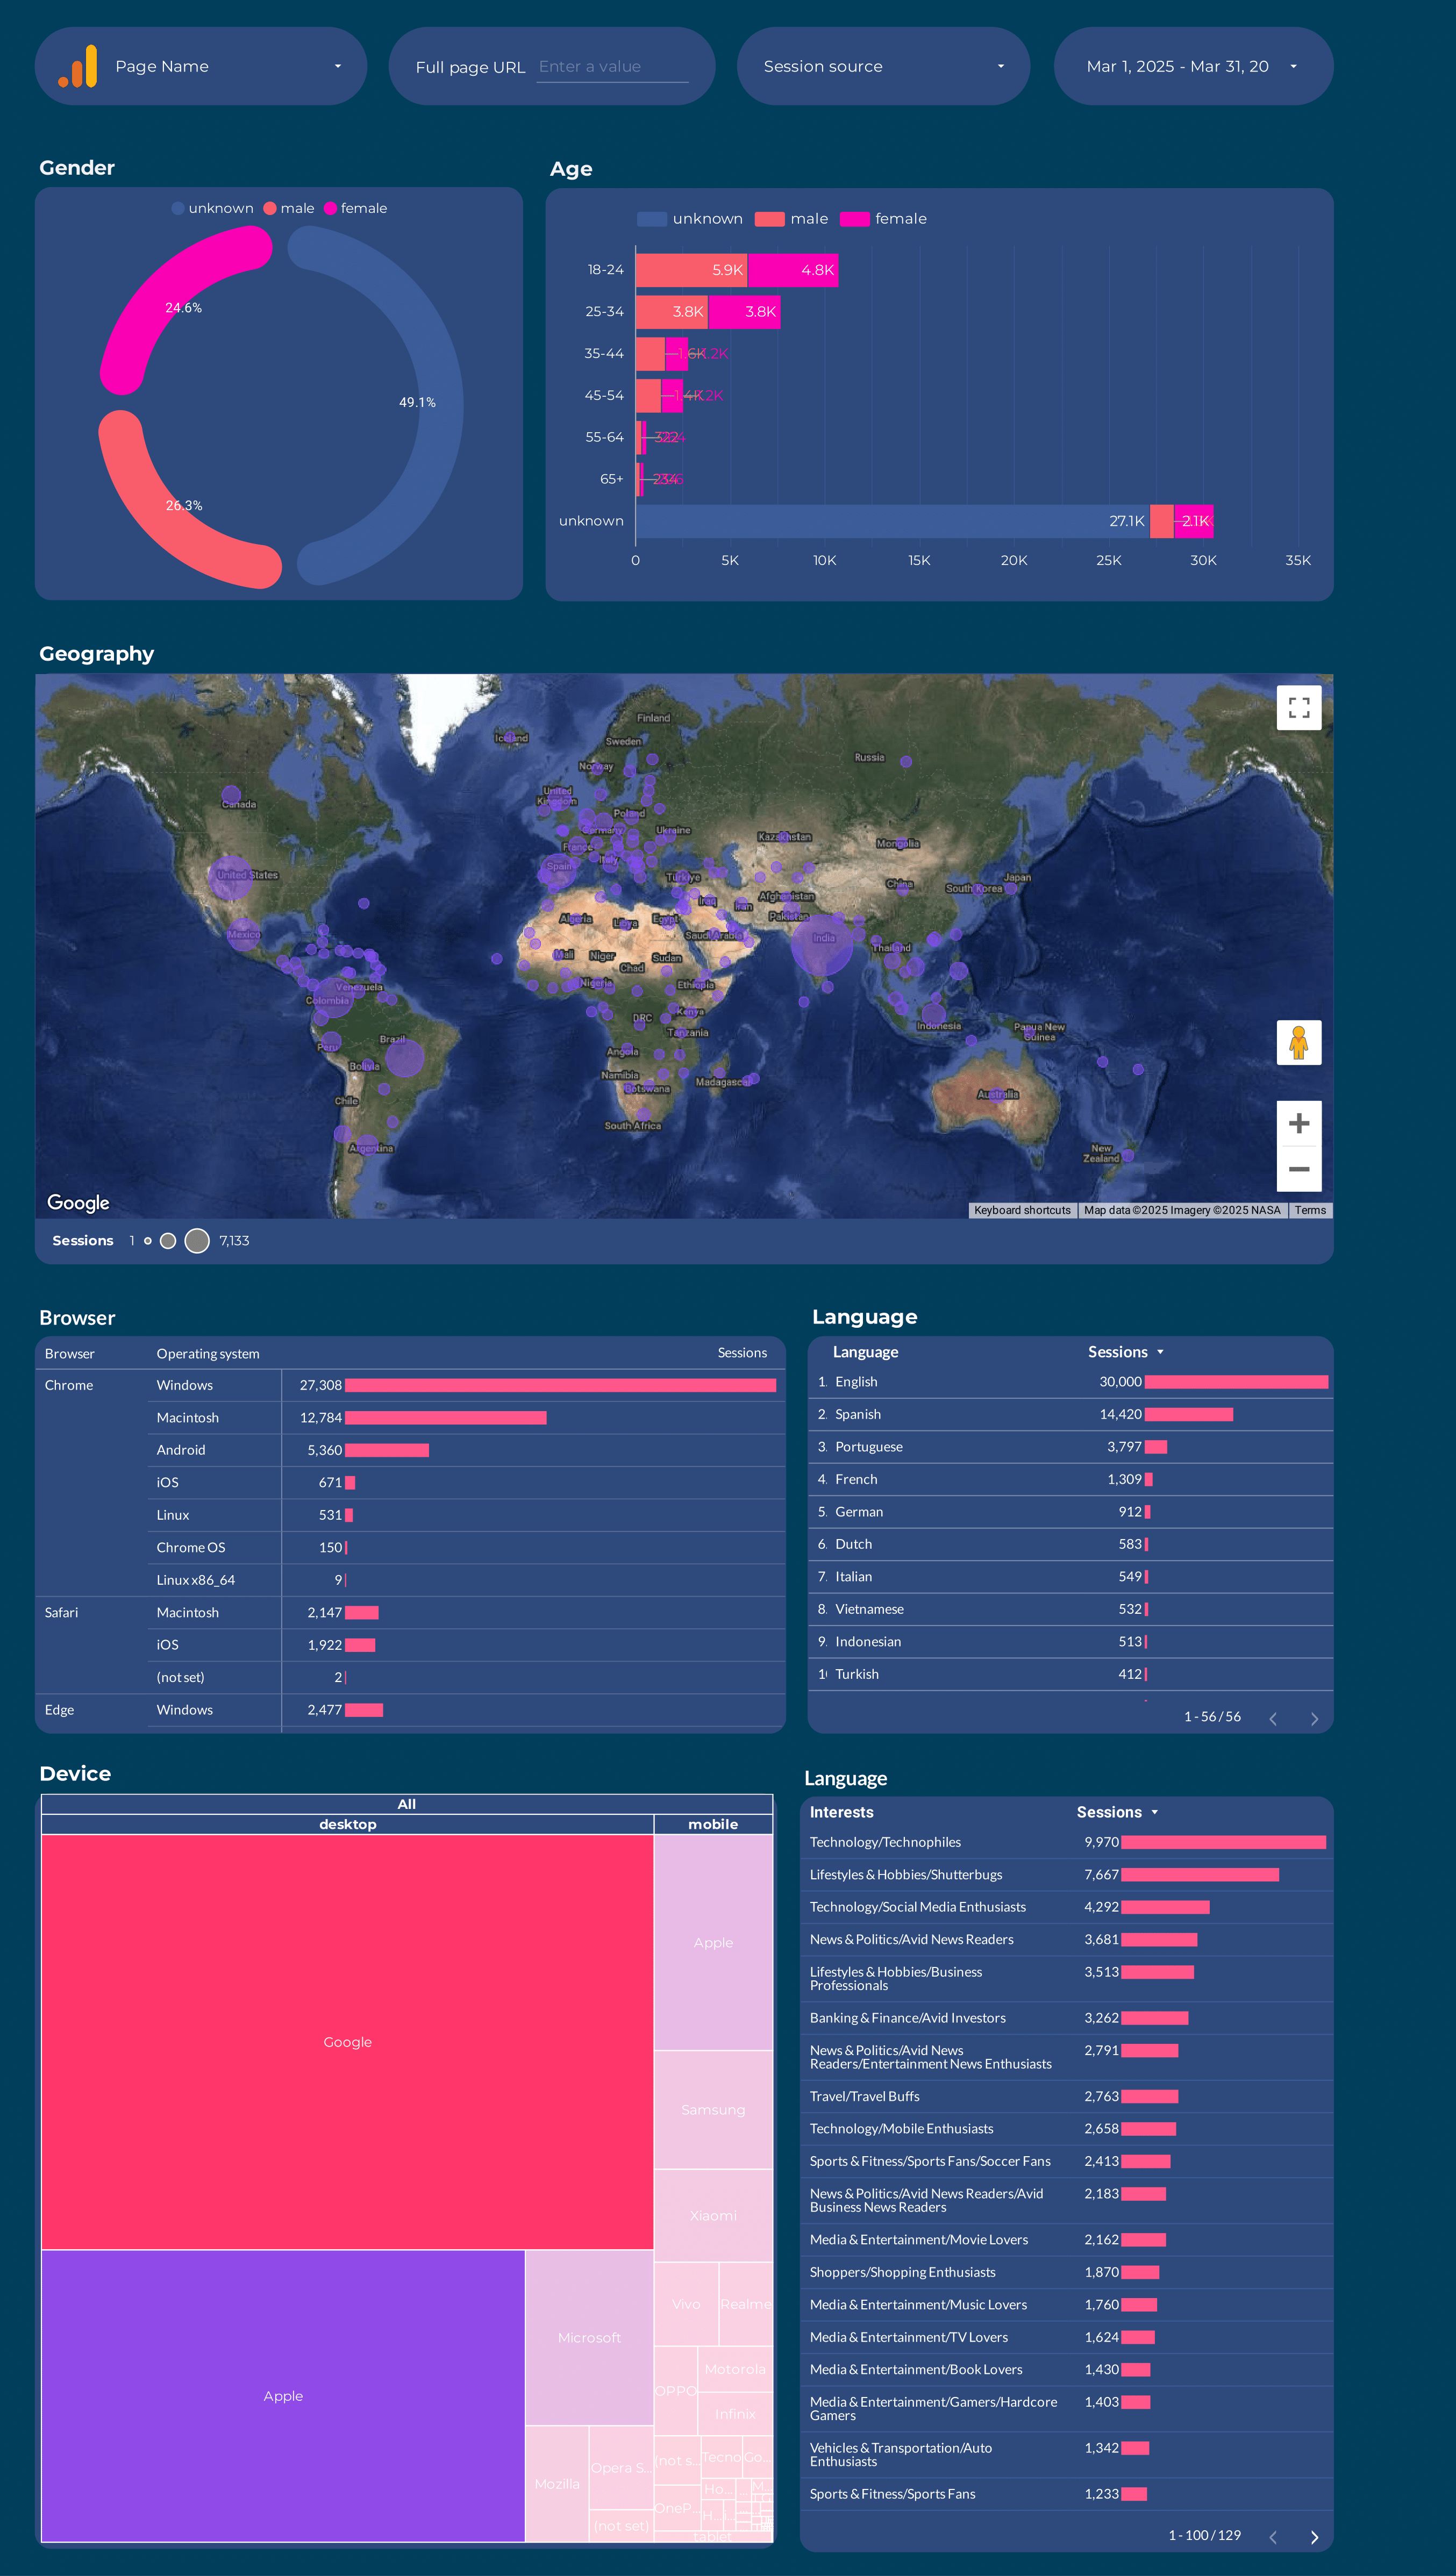
- Audience Reports: Breakdowns by gender, age, geography, city, device, browser, and language.
- Ecommerce (if set up): Funnels for add to cart, checkout, purchase, conversion rates, and revenue metrics, compatible with Shopify and WooCommerce.
Customizing your GA4 dashboard
Add new pages, rename them, assign icons, and insert scorecards for key metrics like sessions, events, or conversions. Use sparklines, period comparisons, time series, tables, pie charts, and maps to visualize trends and segment data by source, content, demographics, technology, or geography. Style your dashboard with custom titles, fonts, and colors, and enable detailed numbers for precise reporting.
With this setup, you’ll have a comprehensive GA4 dashboard in Looker Studio to track traffic, conversions, engagement, acquisition channels, content performance, audience demographics, and even AI-driven traffic.
GA4 dashboard templates
GA4 dashboard template, you’ll access these use cases: GA4 Overview dashboardGet a comprehensive overview of your website or app performance. Track active users, new vs. returning users, sessions, engagement rate, bounce rate, conversions, and revenue. Segment by device, location, and traffic source to understand your audience and their behavior at a glance.
Analyze how different channels and campaigns contribute to conversions. Compare attribution models, review UTM parameters, and evaluate the impact of Google Ads and other sources. Understand the customer journey and optimize your marketing mix for better ROI.
Discover which sources, mediums, and campaigns drive the most users and sessions. Segment by first user and session source, analyze Google Ads and SA360 performance, and identify top-performing channels to focus your acquisition efforts.
Segment your users by demographics (age, gender, interests), geography (country, city, region), and technology (device, OS, browser). Track user engagement, conversion rates, and cohort analysis to better understand and target your audience.
Content performance dashboard
Measure the effectiveness of your content by tracking page views, engagement, landing page performance, and conversion rates. Identify top-performing pages, content groups, and user journeys to optimize your content strategy.
How to build a GA4 dashboard in Looker Studio
To customize your GA4 dashboard, start by adding a new page to the downloaded template or create a new report from scratch, then switch to Edit mode.
Step 1: Add charts to visualise GA4 KPIs
Add scorecards, time series, tables, pie charts, and other chart types to visualize your GA4 data.
- Bar charts: Compare event counts by event name, or see which page titles generate the most sessions.
- Scorecards: Show a single KPI like total users, sessions, or conversions, with trend or comparison to previous period.
- Tables: Combine dimensions and metrics, e.g., page URL, sessions, engagement rate, and conversions to analyze content performance.
- Time series: Track trends in users, sessions, or key events over time, such as daily or weekly engagement.
- Geo charts: Show sessions or users by country, region, or city to analyze geographic performance.
Area charts: Visualize how different traffic sources contribute to total sessions or conversions over time. - Pie charts: Show device category split (mobile, desktop, tablet) or traffic source share (organic, paid, referral, AI search engines).
- Scatter plots: Explore relationships, e.g., engagement rate vs. session duration by page or traffic source.
- Treemaps: Visualize hierarchical data, such as source/medium → event name to see which sources drive key events.
Bullet / Gauge charts: Show progress toward goals like conversion rate or revenue targets.
Step 2: Add context with comparisons
Add goals, reference lines, and conditional formatting to compare GA4 data and add context.
- Comparison date range: Compare users, sessions, or conversions against the previous period to spot changes in website performance.
- Reference lines: Add target or average lines to time series, e.g., see if daily conversions meet your goal.
- Conditional formatting: Highlight high or low performing pages, sources, or events in tables, e.g., flag pages with low engagement rate in red.
- Goal tracking: Track progress toward GA4 goals like monthly conversions, revenue, or engagement benchmarks.
Step 3: Make dashboards interactive
Interactive elements make GA4 dashboards easier to explore:
- Buttons: Add navigation buttons to move between report pages, download as PDF, or reset filters.
- Date range controls: Change the time period shown, e.g., last 7 days vs. last 30 days of GA4 data.
Sliders: Filter by numeric values such as sessions above 100 or engagement rate above 60%. - Dropdowns: Filter by event name, page title, or traffic source.
Input boxes: Search for specific pages or events, e.g., type “checkout” to see only checkout-related data. - Cross‑filtering: Click a data point (bar, pie slice, table row) to filter all other charts to that same event, page, or source.
Step 4: Design and white-label
Learn to design your Looker Studio reports and follow best practices for dashboard design.
- Theme and layout: Control colors, backgrounds, borders, headers, and navigation for a consistent GA4 dashboard look.
Page navigation: Structure the dashboard into sections (e.g., Conversions, Engagement, Acquisition, AI Traffic, Ecommerce). - Navigation and headers: Under “Theme and layout” > “Layout,” change navigation type and set header visibility.
- Images and text: Add branding, headers, and section labels for clarity.
- Shapes and lines: Use for visual emphasis or to separate dashboard sections.
- Copy-paste styling: Apply consistent styles across charts.
Aligning charts: Align and space charts for a clean layout. - Conditional formatting: Color cells or metrics based on performance, e.g., highlight high-converting sources.
- Modern charts: Enable advanced styling like gradients and rounded elements.
- Report-level elements: Keep elements (logo, title, date control) consistent across all pages.
Step 5: Share your GA4 dashboard
Learn to share your Looker Studio reports:
- Invite people via email: Add email addresses and assign access as editor or viewer, just like Google Docs or Sheets.
- Draft mode: Edit without showing changes to viewers until published.
- Schedule email delivery: From the Share menu, choose Schedule Delivery, enter recipient emails, set subject and message, select pages, and define frequency (daily, weekly). The email includes a preview and a PDF attachment.
- Share via link: From the Share menu, select Get Report Link and copy it. You can enable or disable link access to the current report view.
- Download as PDF: From the Share menu, choose Download Report and export all pages or selected pages as a PDF.
- Embed report: From File, choose Embed Report. Use an embed code or a full-screen URL to display the report on a website or internal tool. Embed options allow hiding navigation and resizing the report display.
GA4 Website KPIs
User & Engagement
- Active Users: 1-day, 7-day, 28-day, and total active user counts.
- New/Total Users: Track new users, total users, and new vs. returning status.
- User Engagement: User engagement time, user conversion rate, and users signed in with user ID.
- User Ratios: DAU/MAU, DAU/WAU, WAU/MAU, and sessions per user.
- Purchasers: Total purchasers and first-time purchasers.
Session & Traffic
- Session Counts: Sessions and engaged sessions.
- Session Metrics: Average session duration, bounce rate, engagement rate, and session conversion rate.
- Traffic Source: First user source/medium/campaign, session source/medium/campaign, and Google Ads/SA360 details.
Ecommerce & Revenue
- Purchase Funnel Events: Item-list views, item-list clicks, add to carts, checkouts.
- Revenue: Purchase revenue, gross purchase revenue, gross item revenue, refund amount, and item refund amount.
- Transactions: Ecommerce purchases, transactions, and transaction IDs.
- Rates: Cart-to-view rate, purchase-to-view rate, and item list click-through rate.
Page & Content
- Page/Screen Views: Views, views per session, and views per user.
- Page Details: Page location, page path, page title, and hostname.
- Landing Page: Landing page + query string.
Dimensions
Segment data by:
- Time: Date, hour, week, month, year
- User: Country, city, region, gender, age, interests
- Device & Platform: Device category, model, brand, operating system, browser, platform
- Traffic Source: Source, medium, campaign, channel group
- Content: Content group, content ID, content type
Custom fields
- Custom Metrics: Build new KPIs such as custom conversion rates, scroll depth engagement, or custom event values.
- Custom Dimensions: Use REGEX and naming conventions to group by content type, user segment, or traffic source. Filters: Apply filters at the chart, page, or report level (e.g., Page path contains “/blog”).
- Data blending: Blend GA4 website data with Google Ads or CRM data for cross-channel attribution and holistic website performance reporting.


