Shopify Dashboard
Comprehensive Shopify dashboard for tracking sales, orders, and store performance in Looker Studio using the free Shopify connector.
View Template Shopify
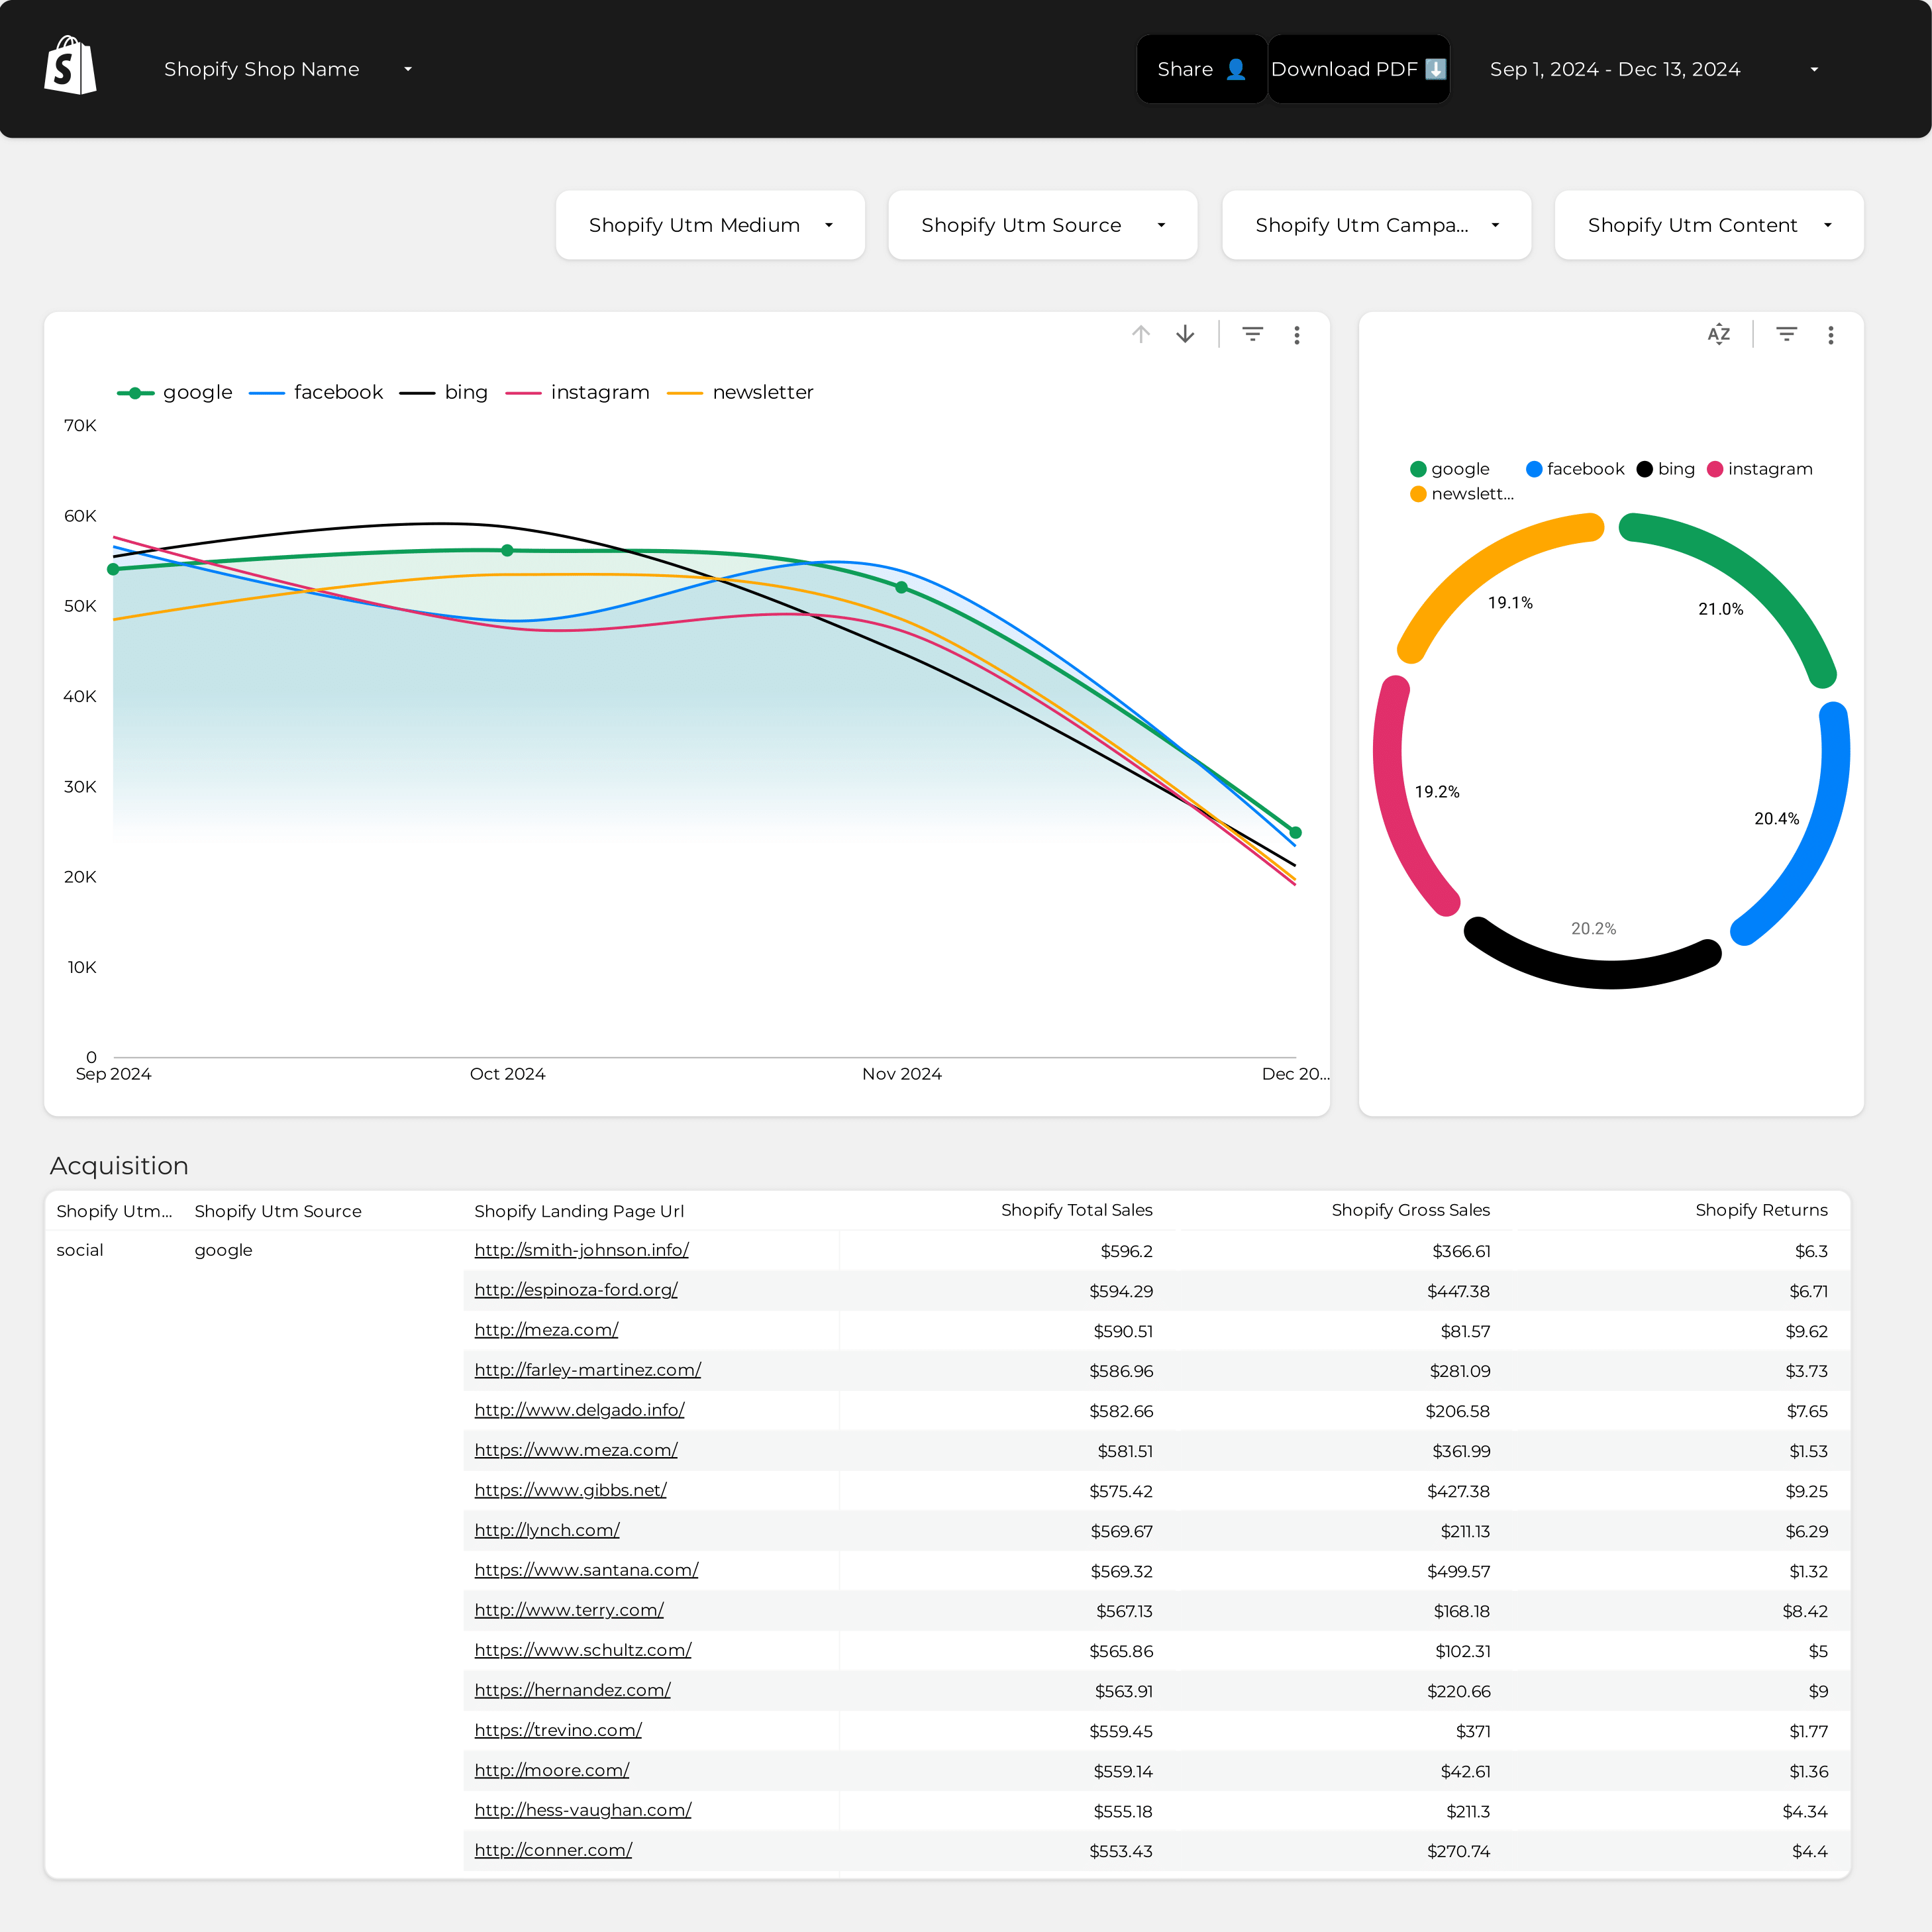
Comprehensive Shopify dashboard for tracking sales, orders, and store performance in Looker Studio using the free Shopify connector.
View Template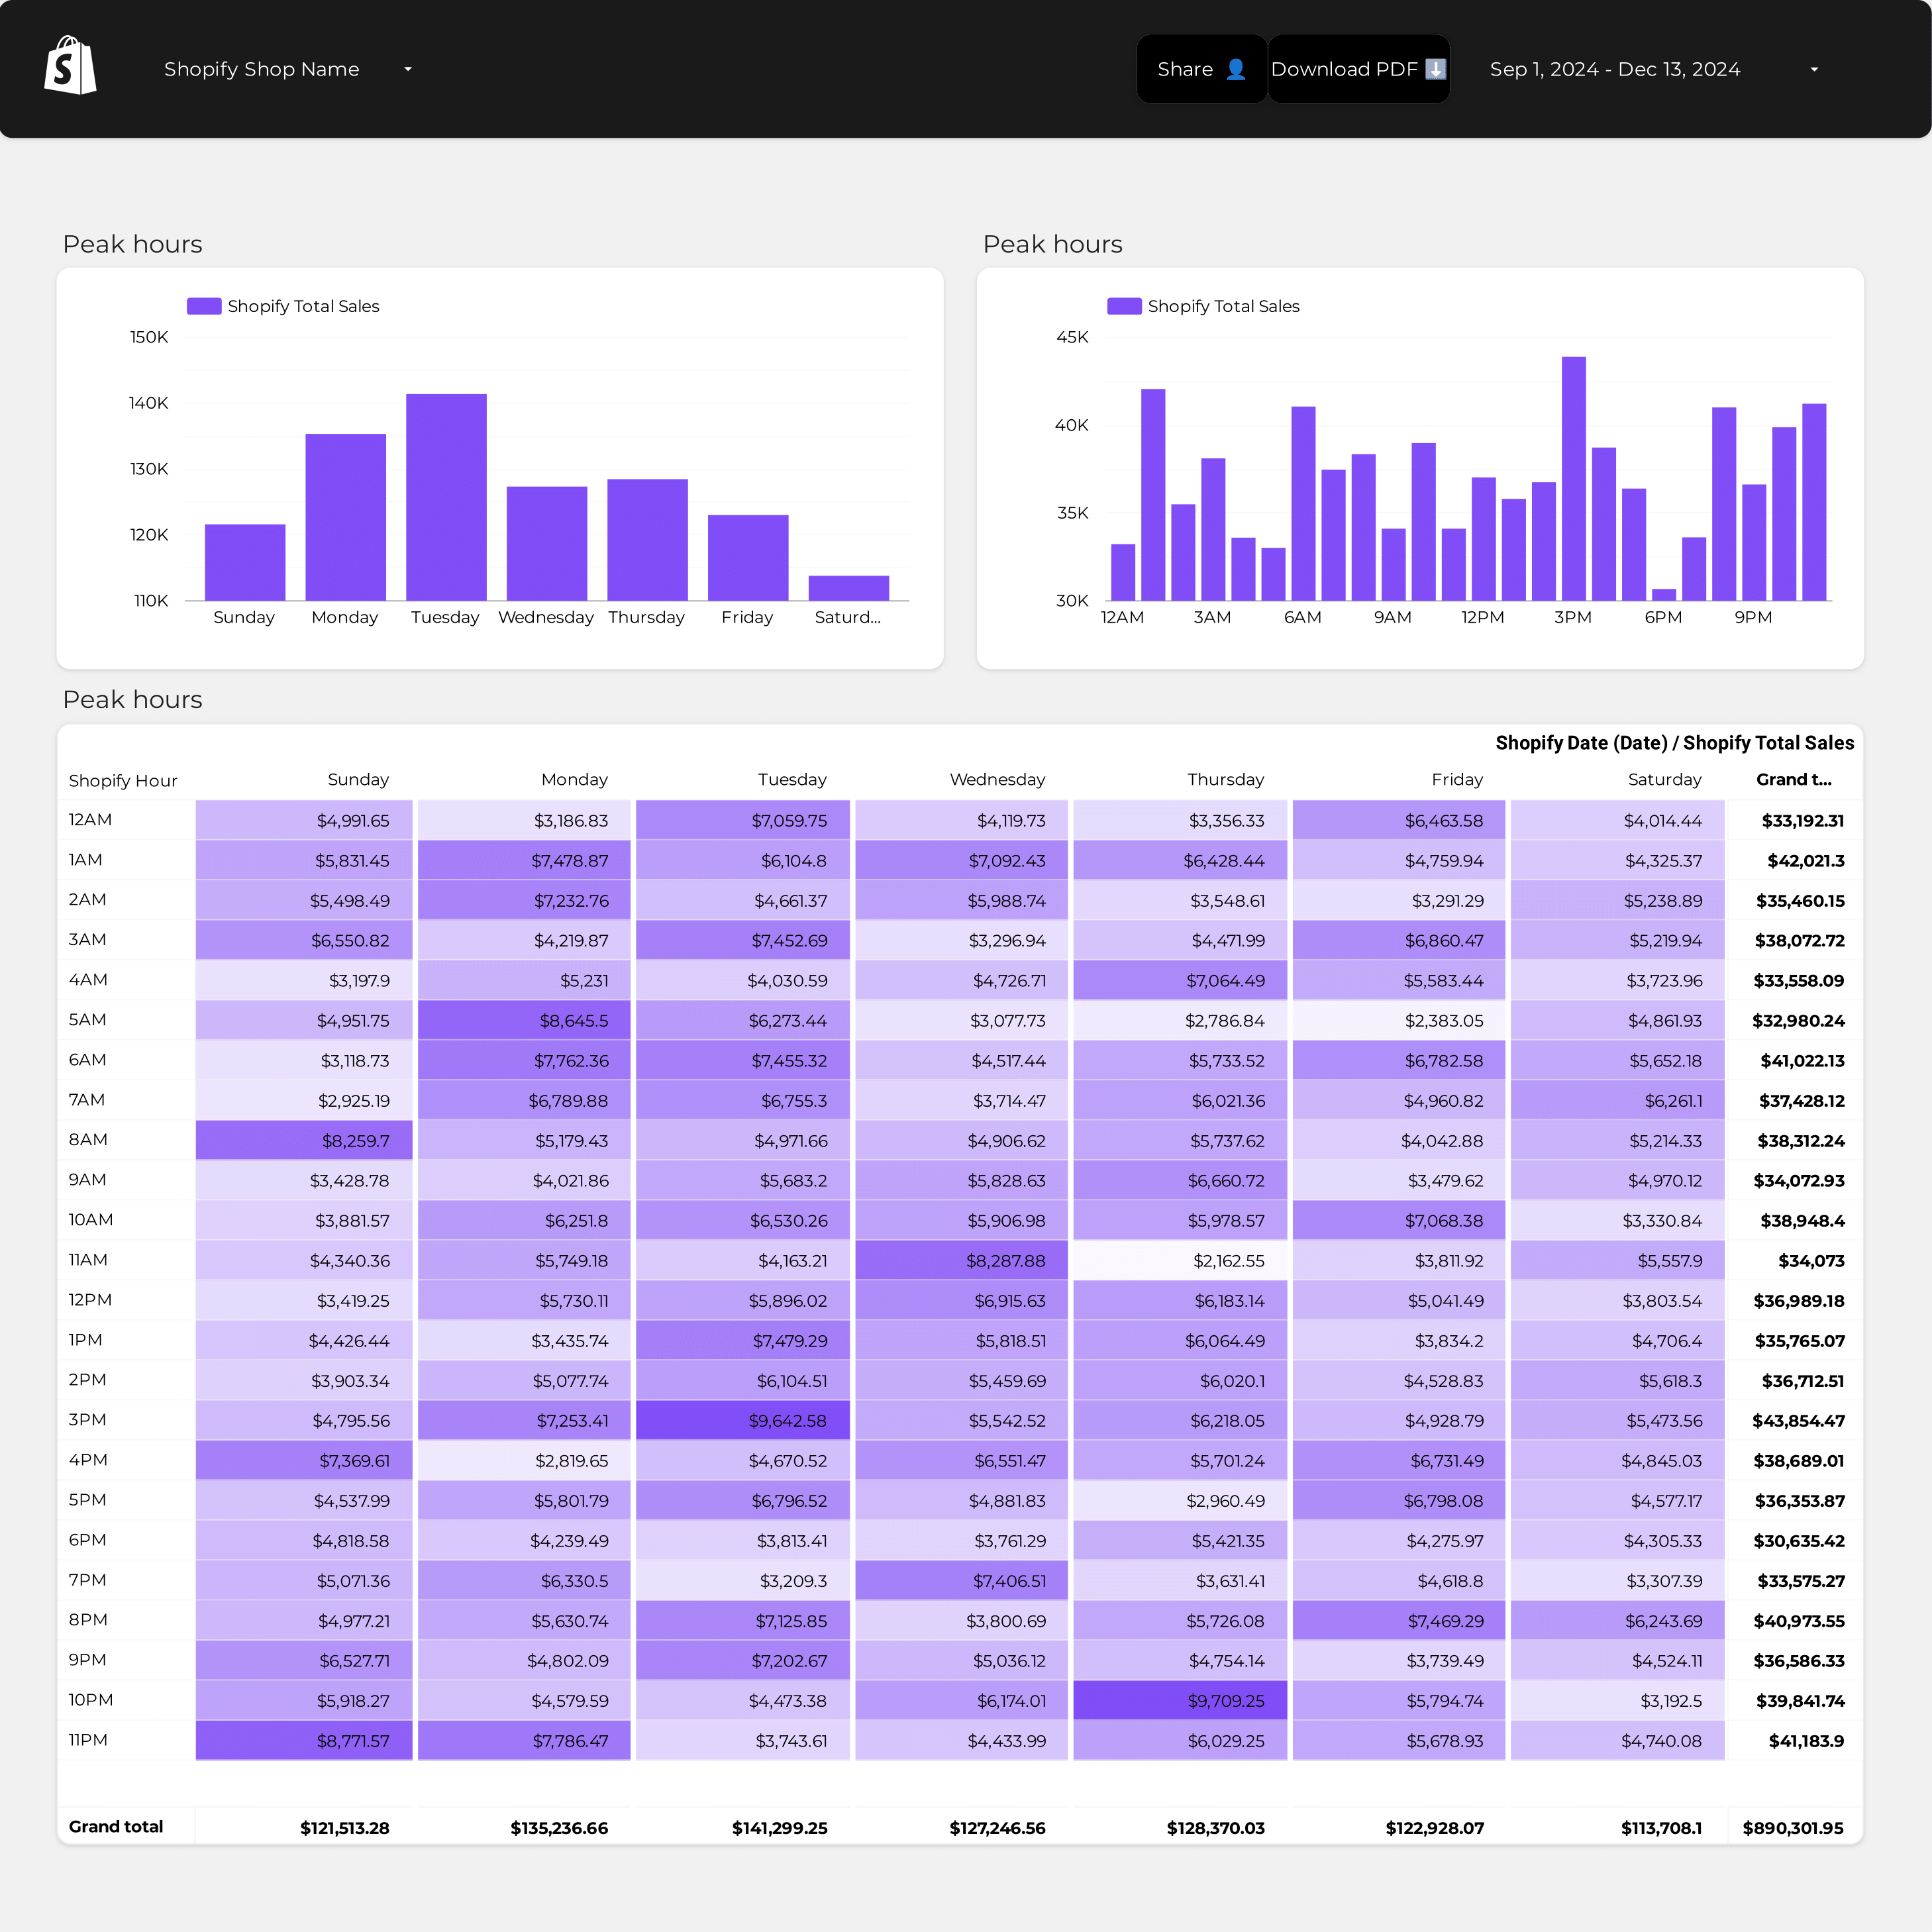
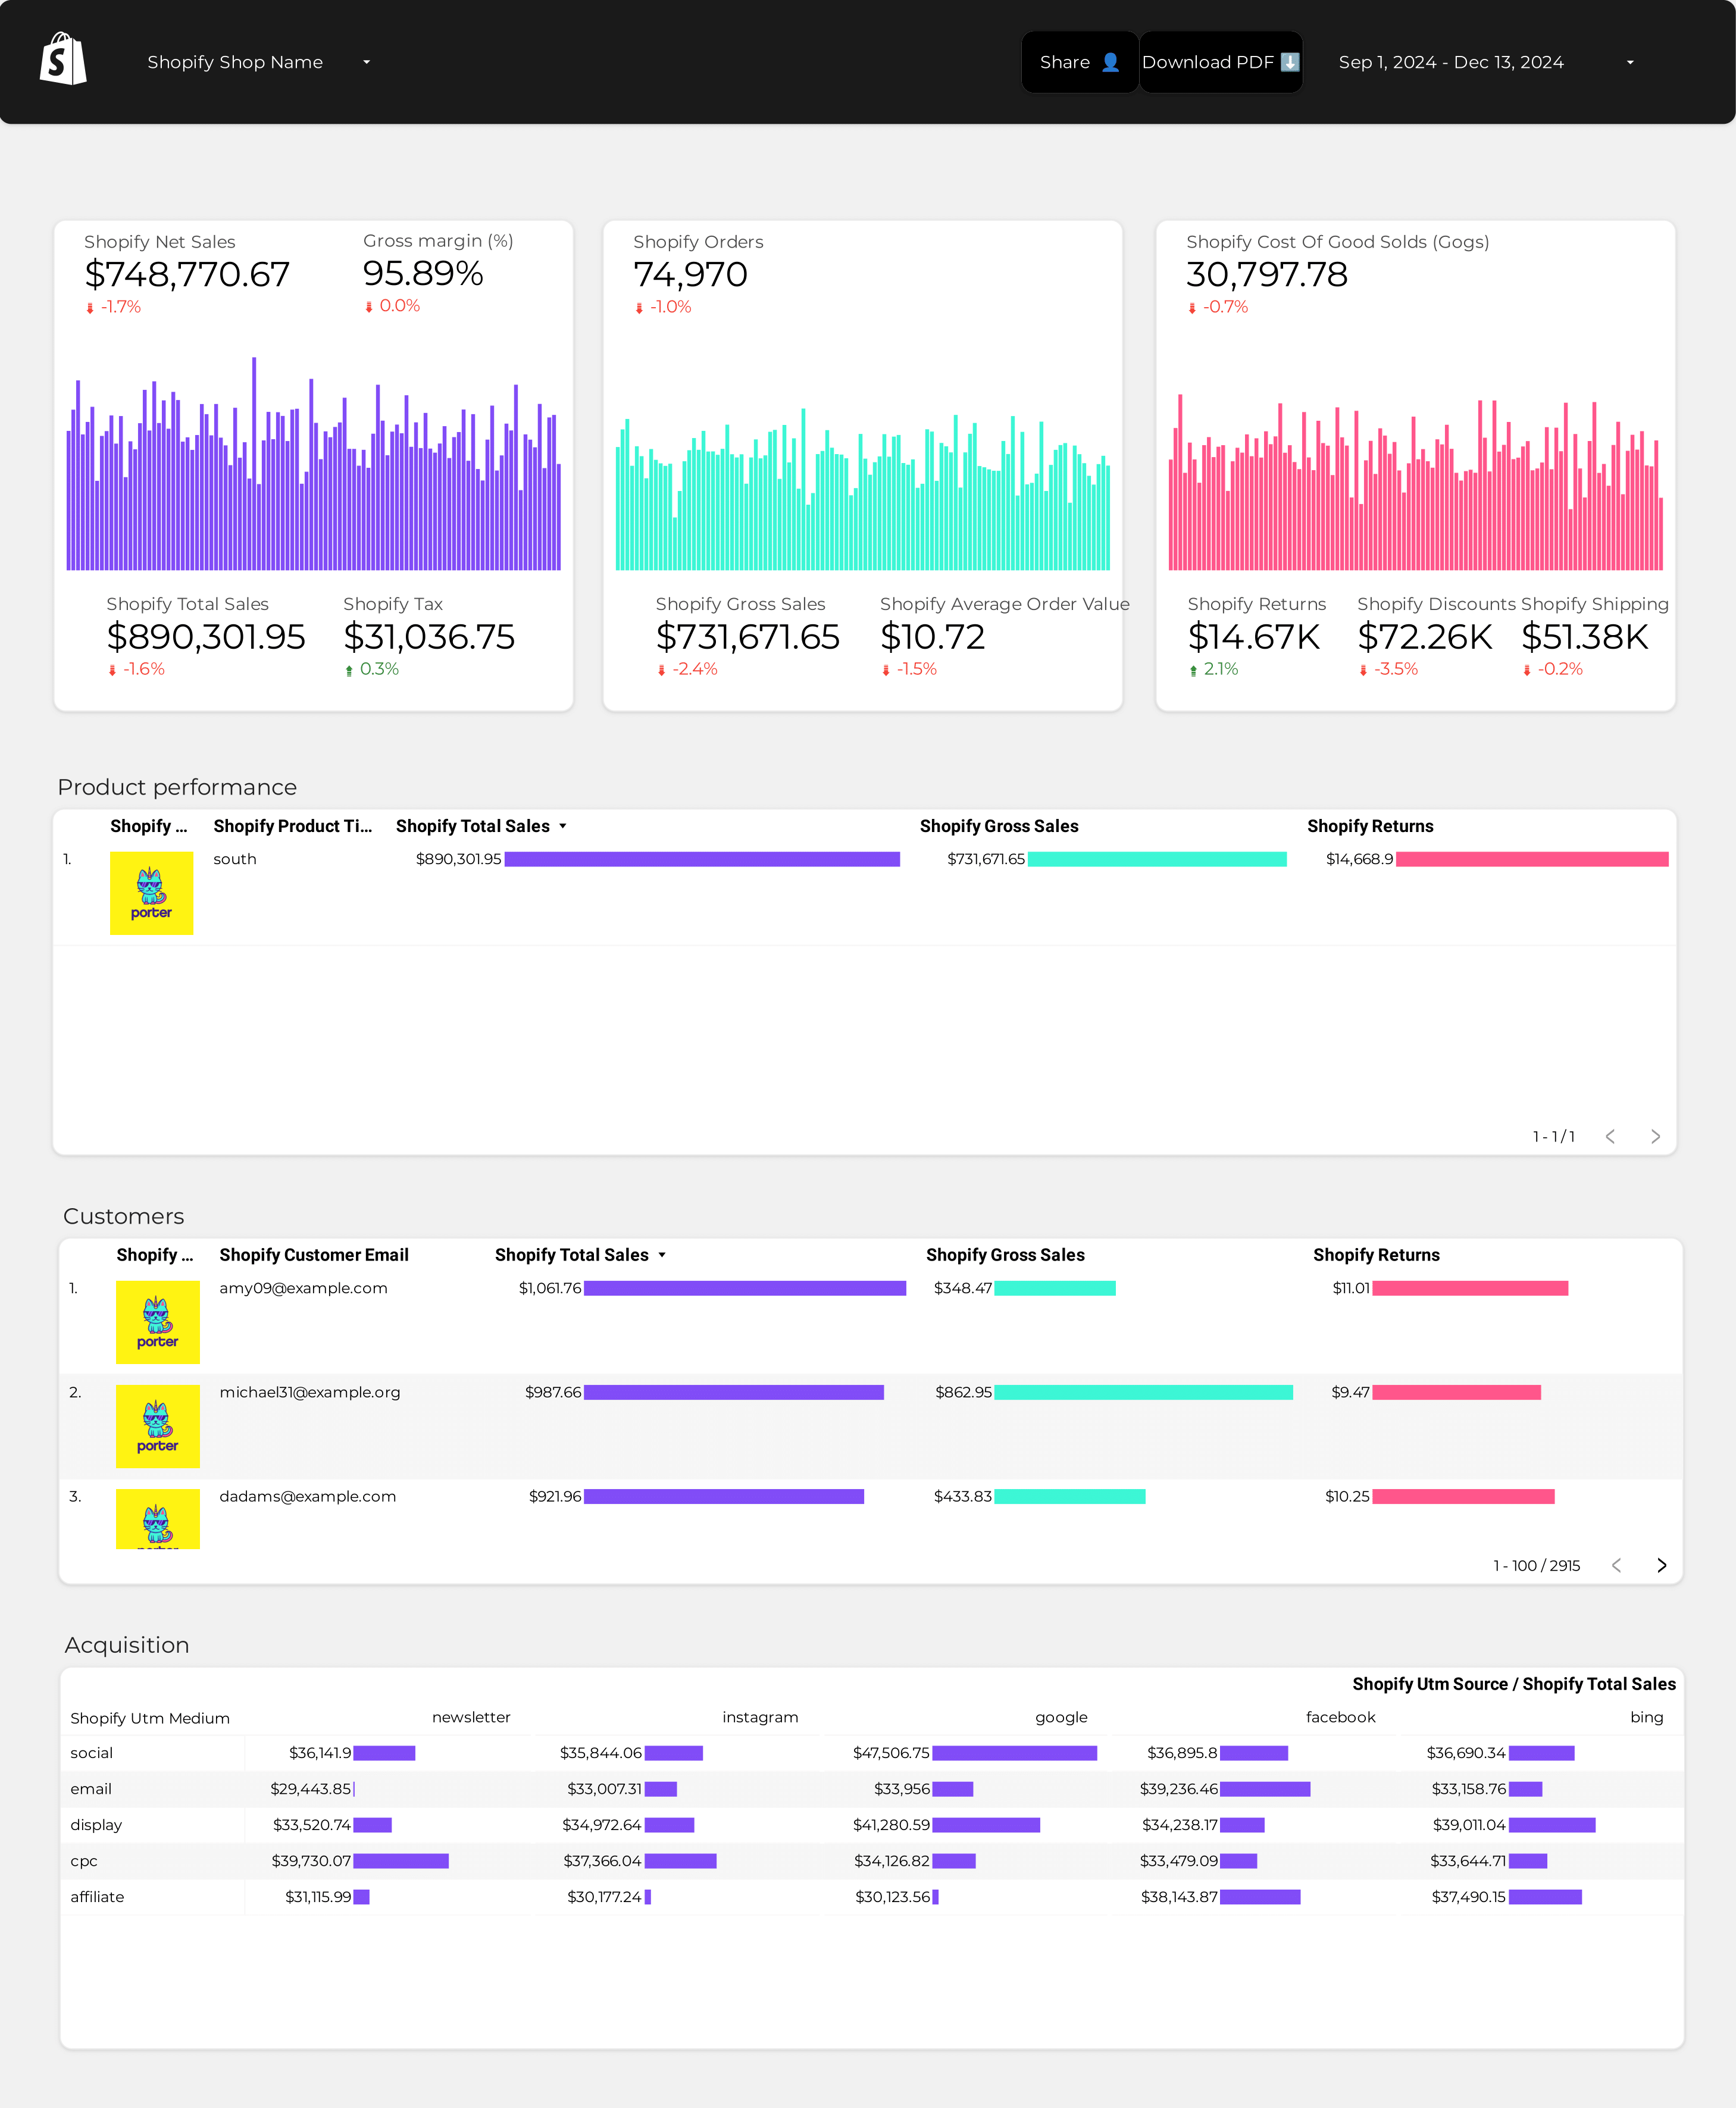
Monitor your Shopify store’s revenue, conversion rate, and product performance with this e-commerce dashboard template for Looker Studio.
View Template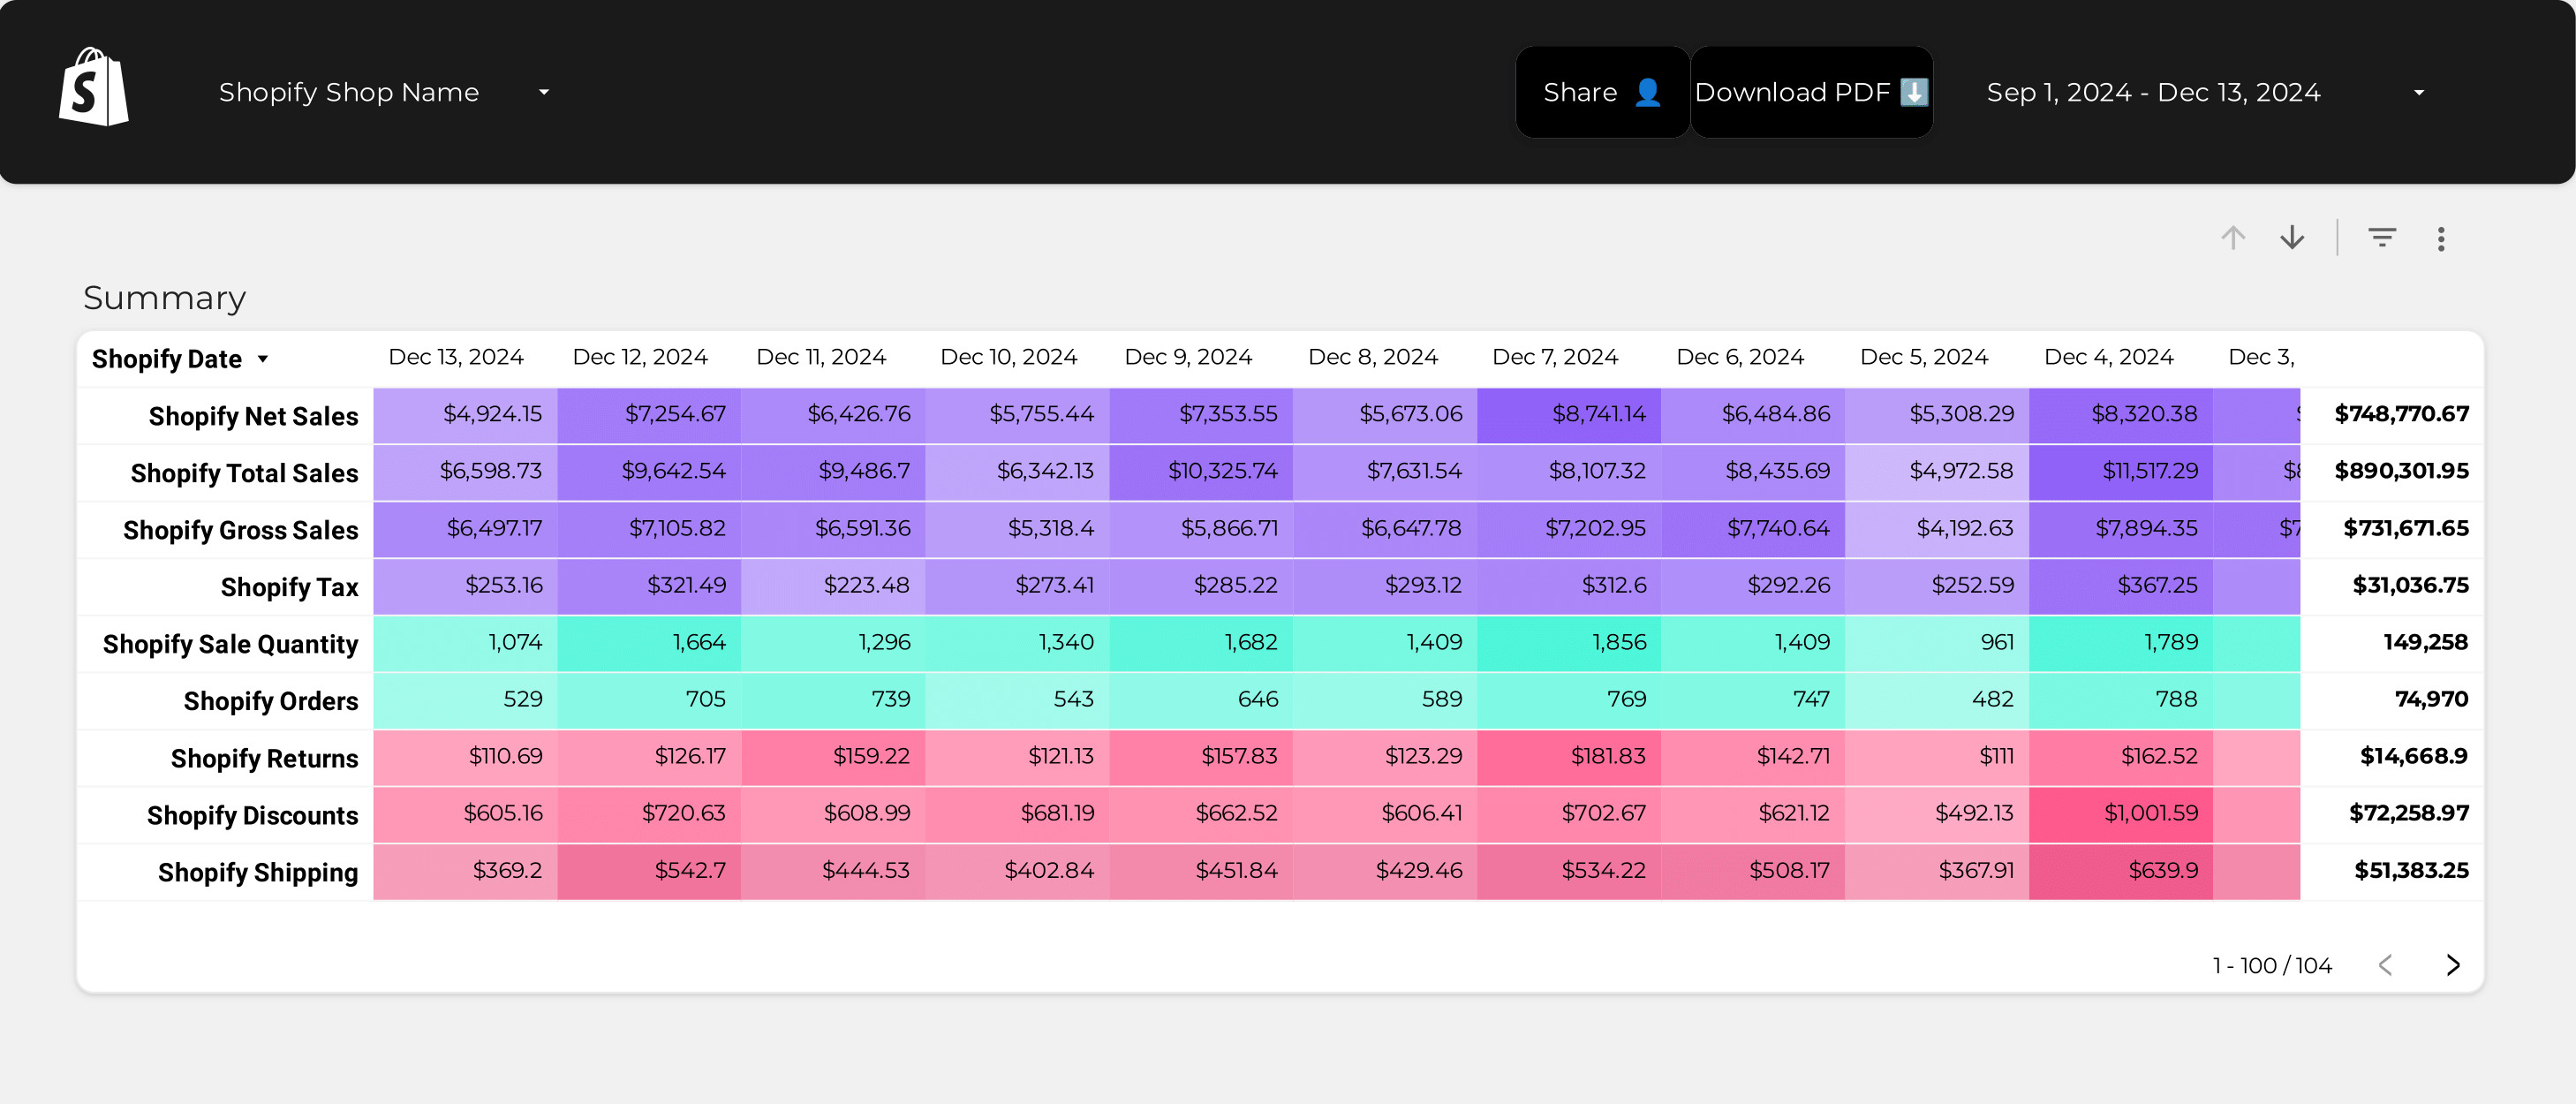
Track essential Shopify KPIs like AOV, customer retention, and sales trends in Looker Studio with this free dashboard template.
View Template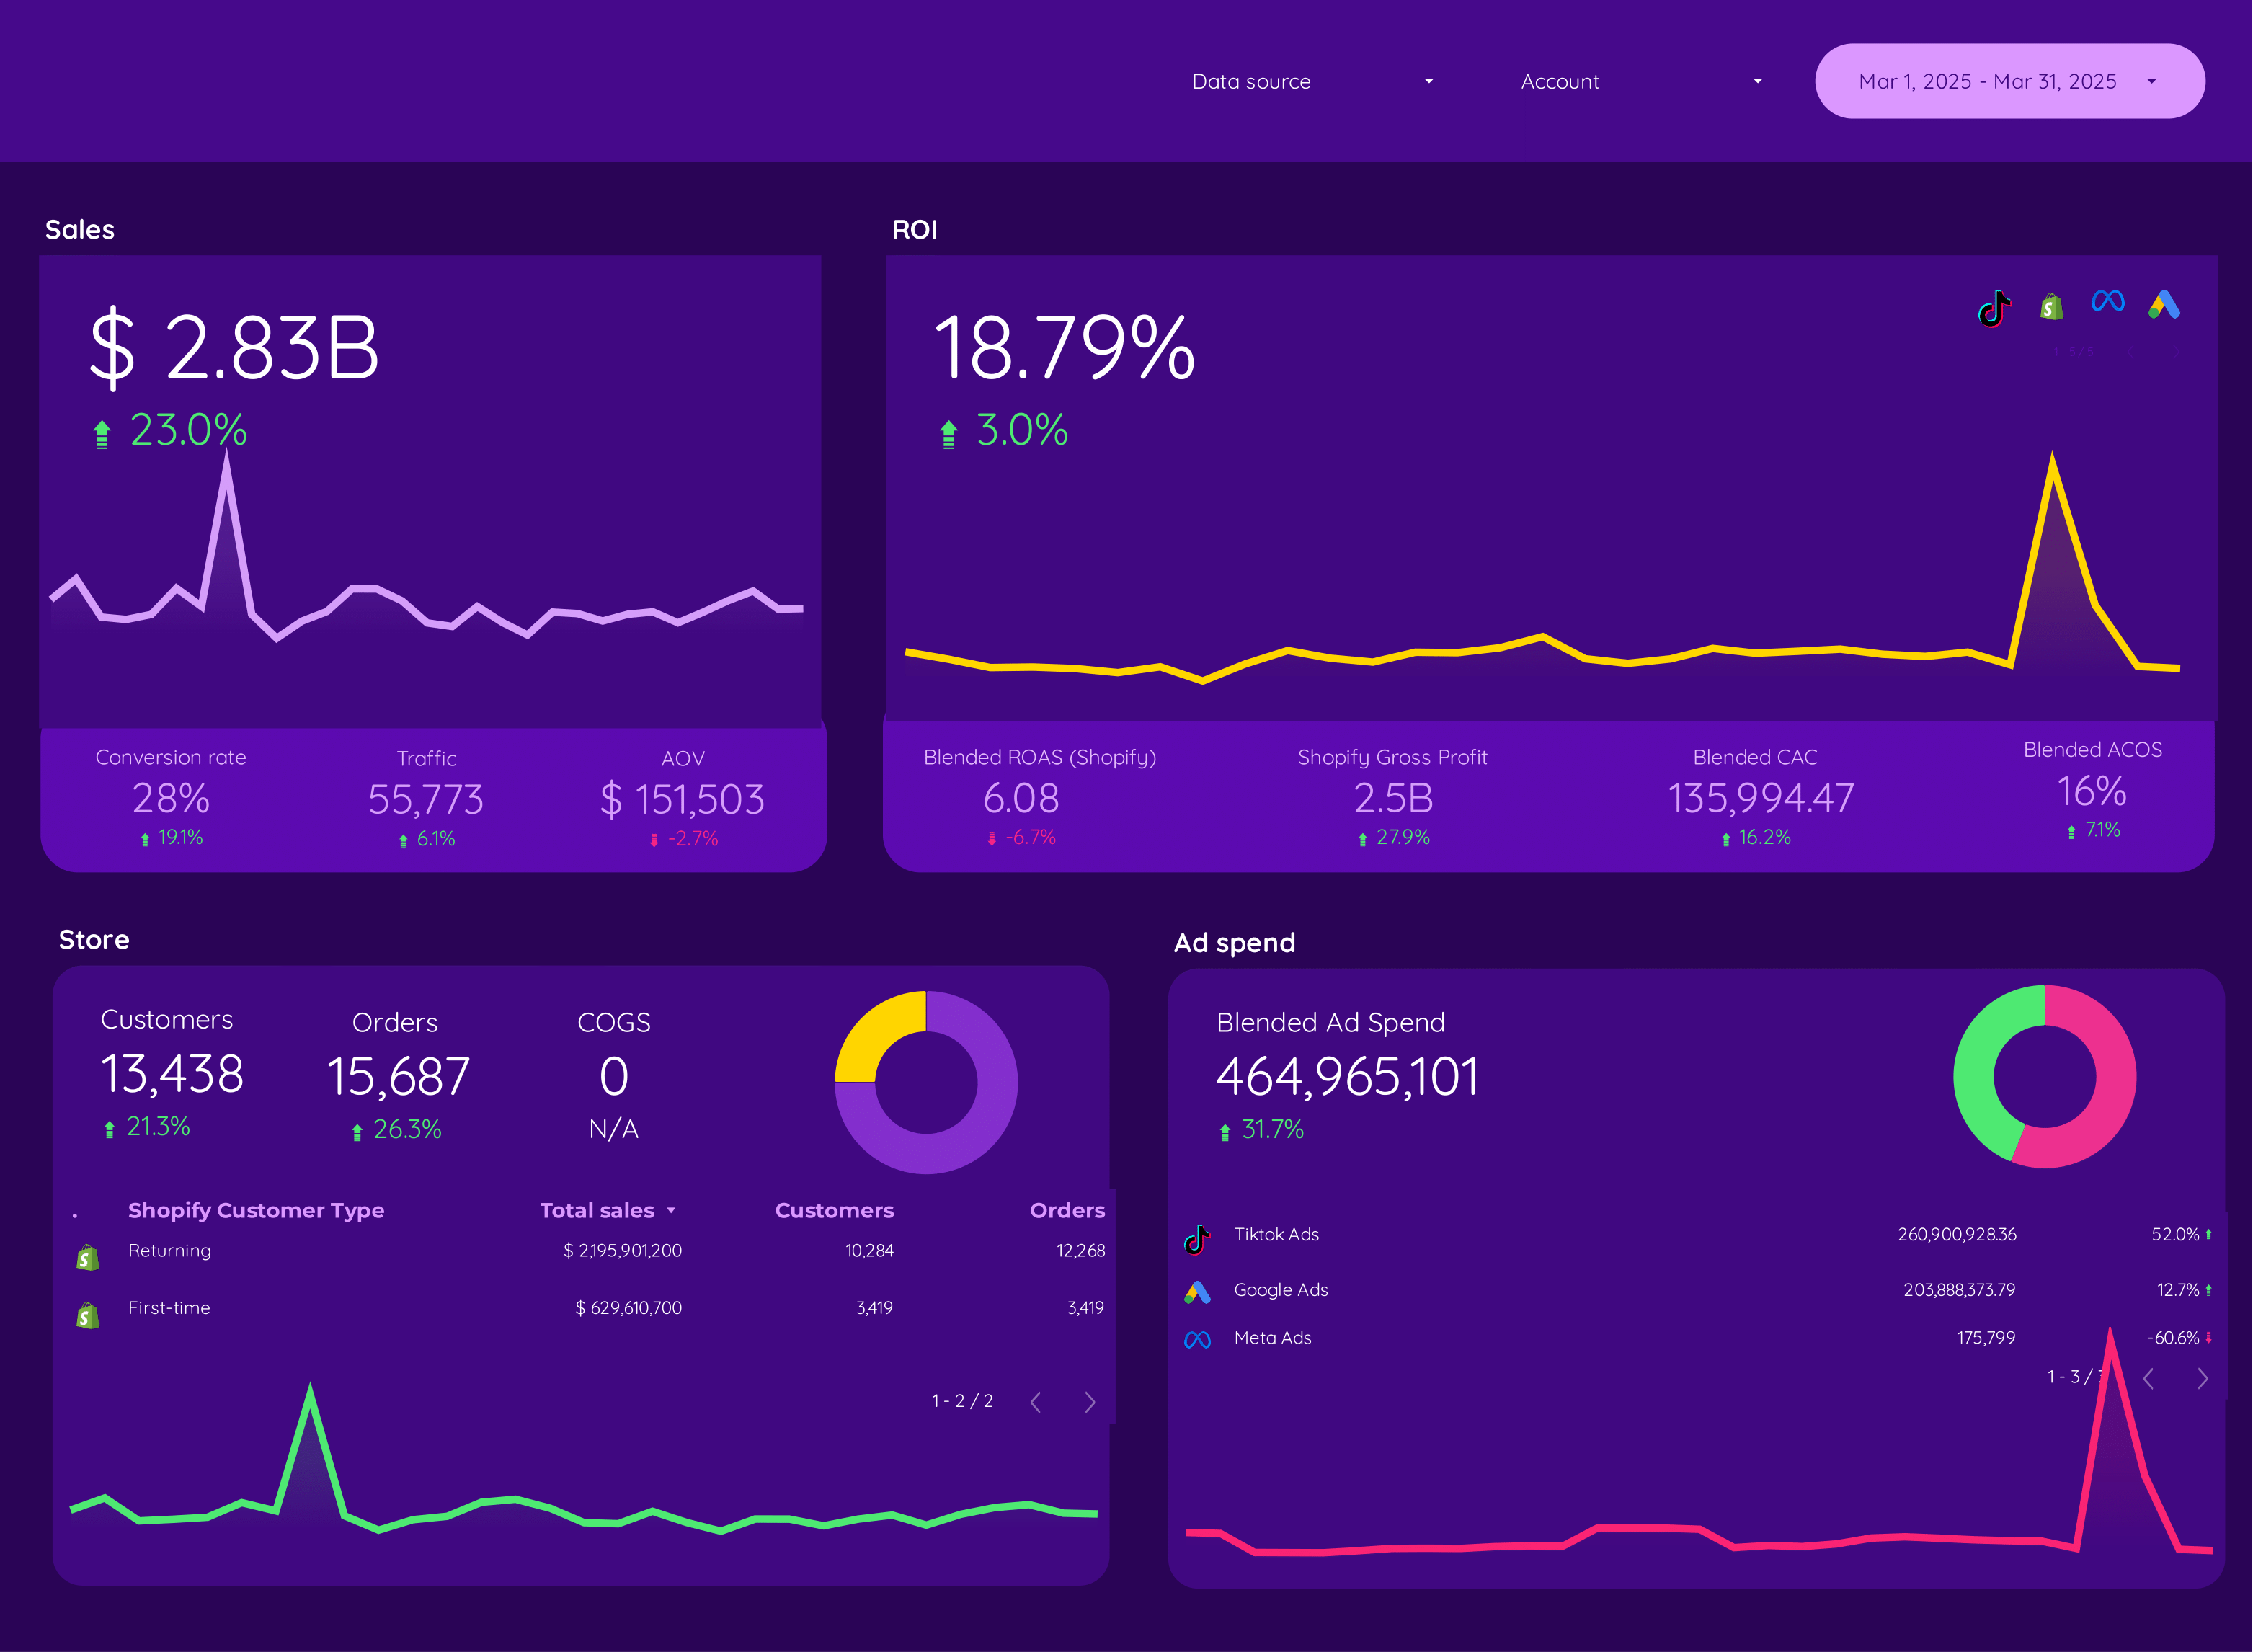
Analyze your Shopify store’s e-commerce metrics, including traffic, sales, and product analytics, with this Looker Studio dashboard.
View Template
Porter✓ No-code marketing data warehouse |
Others✓ Connectors & ETL |
|
|---|---|---|
| Storage | Built-in, self-managed BigQuery with automated transformations, transfers, queries, and costs included. | Requires setting up your own BigQuery project, managing tables, transfers, and costs. |
| Data syncing | Switch between stored BigQuery and real-time API data in the same connection. | Either stored (manual BigQuery setup) or real-time, not both. |
| Data blending | Blend multiple Shopify stores’ sales by product, customer, UTM, or date—no manual joins. | Manual table selection, field mapping, and join setup. |
| Destinations | Looker Studio + Google Sheets in one subscription. | Separate price per destination. |
Step 1: Choose the Shopify integration on Porter Metrics to get started
Step 2: Log in with the Google account you use on Looker Studio for your reports
Step 3: Authorize and install the Porter Metrics app in your Shopify store to connect data
Step 4: Select your Shopify store and click Create report to generate your Looker Studio dashboard
Step 5: Save, share, and customize your Shopify report to monitor sales, orders, customers, and marketing attribution
Full tutorial: How to connect Shopify to Google Looker Studio
Access every field available in Shopify—orders, products, customers, inventory, costs, and more—plus calculated metrics like average order value, gross profit, and customer lifetime value not found natively.
Break down sales, orders, and customers by product, SKU, acquisition source, geography, device, channel, and time—enabling deep analysis across every Shopify dimension.
Analyze sales attribution by UTM parameters—source, medium, campaign, content, landing page—across any date range, so you can compare marketing performance side by side.
See product images, titles, SKUs, unit costs, and sales directly in your reports—linking performance metrics with product visuals for better merchandising analysis.
Fields are named just like in Shopify—orders, products, customers—so marketers can easily find and blend data with Google Analytics, PPC, and CRM sources.
Segment data by product, customer, order, channel, region, device, date, hour, and every other breakdown supported by Shopify for granular performance insights.
 Order ID
 Order Name
 Discount Code
 Financial Status
 Fulfillment Status
 Customer Name
 Email
Email
 Customer Type
 Orders Count
 Gross Sales
 Net Sales
 Gross Profit
 Average Order Value
 Product Title
 SKU
SKU
 Inventory
 Shipping City
 Shipping Country
 Shipping Title
 UTM Campaign
 Referrer URL
 Landing Page
 Date
Date
 Month
Month
 Week
Week
 Shop Name
 Location
 Risk Level
 Order Note
Billed annually
Avg. price per account: $12.5/mo ↓
Start 14-day free trial