A dropshipping report should include metrics that are broken down by visibility, engagement, and conversion. The data should be segmented by campaign, channel, audience, content, objective, and date. For example, including metrics such as impressions, clicks, likes, shares, conversion rate, and average order value can provide insights into the effectiveness of different campaigns, channels, and content in driving engagement and ultimately conversions.
To analyze dropshipping data, start by choosing visibility, engagement, and conversion metrics. For visibility, consider traffic sources and impressions. Engagement metrics could include click-through rates and bounce rates. Conversion metrics may involve conversion rates and average order value. Add context by comparing data against costs, date ranges, goals, and industry benchmarks. For example, compare CPC (cost per click) against the industry average. Segment data by campaign, channel, audience, content, objective, and date. For instance, analyze conversion rates per channel to identify the most effective marketing channels.
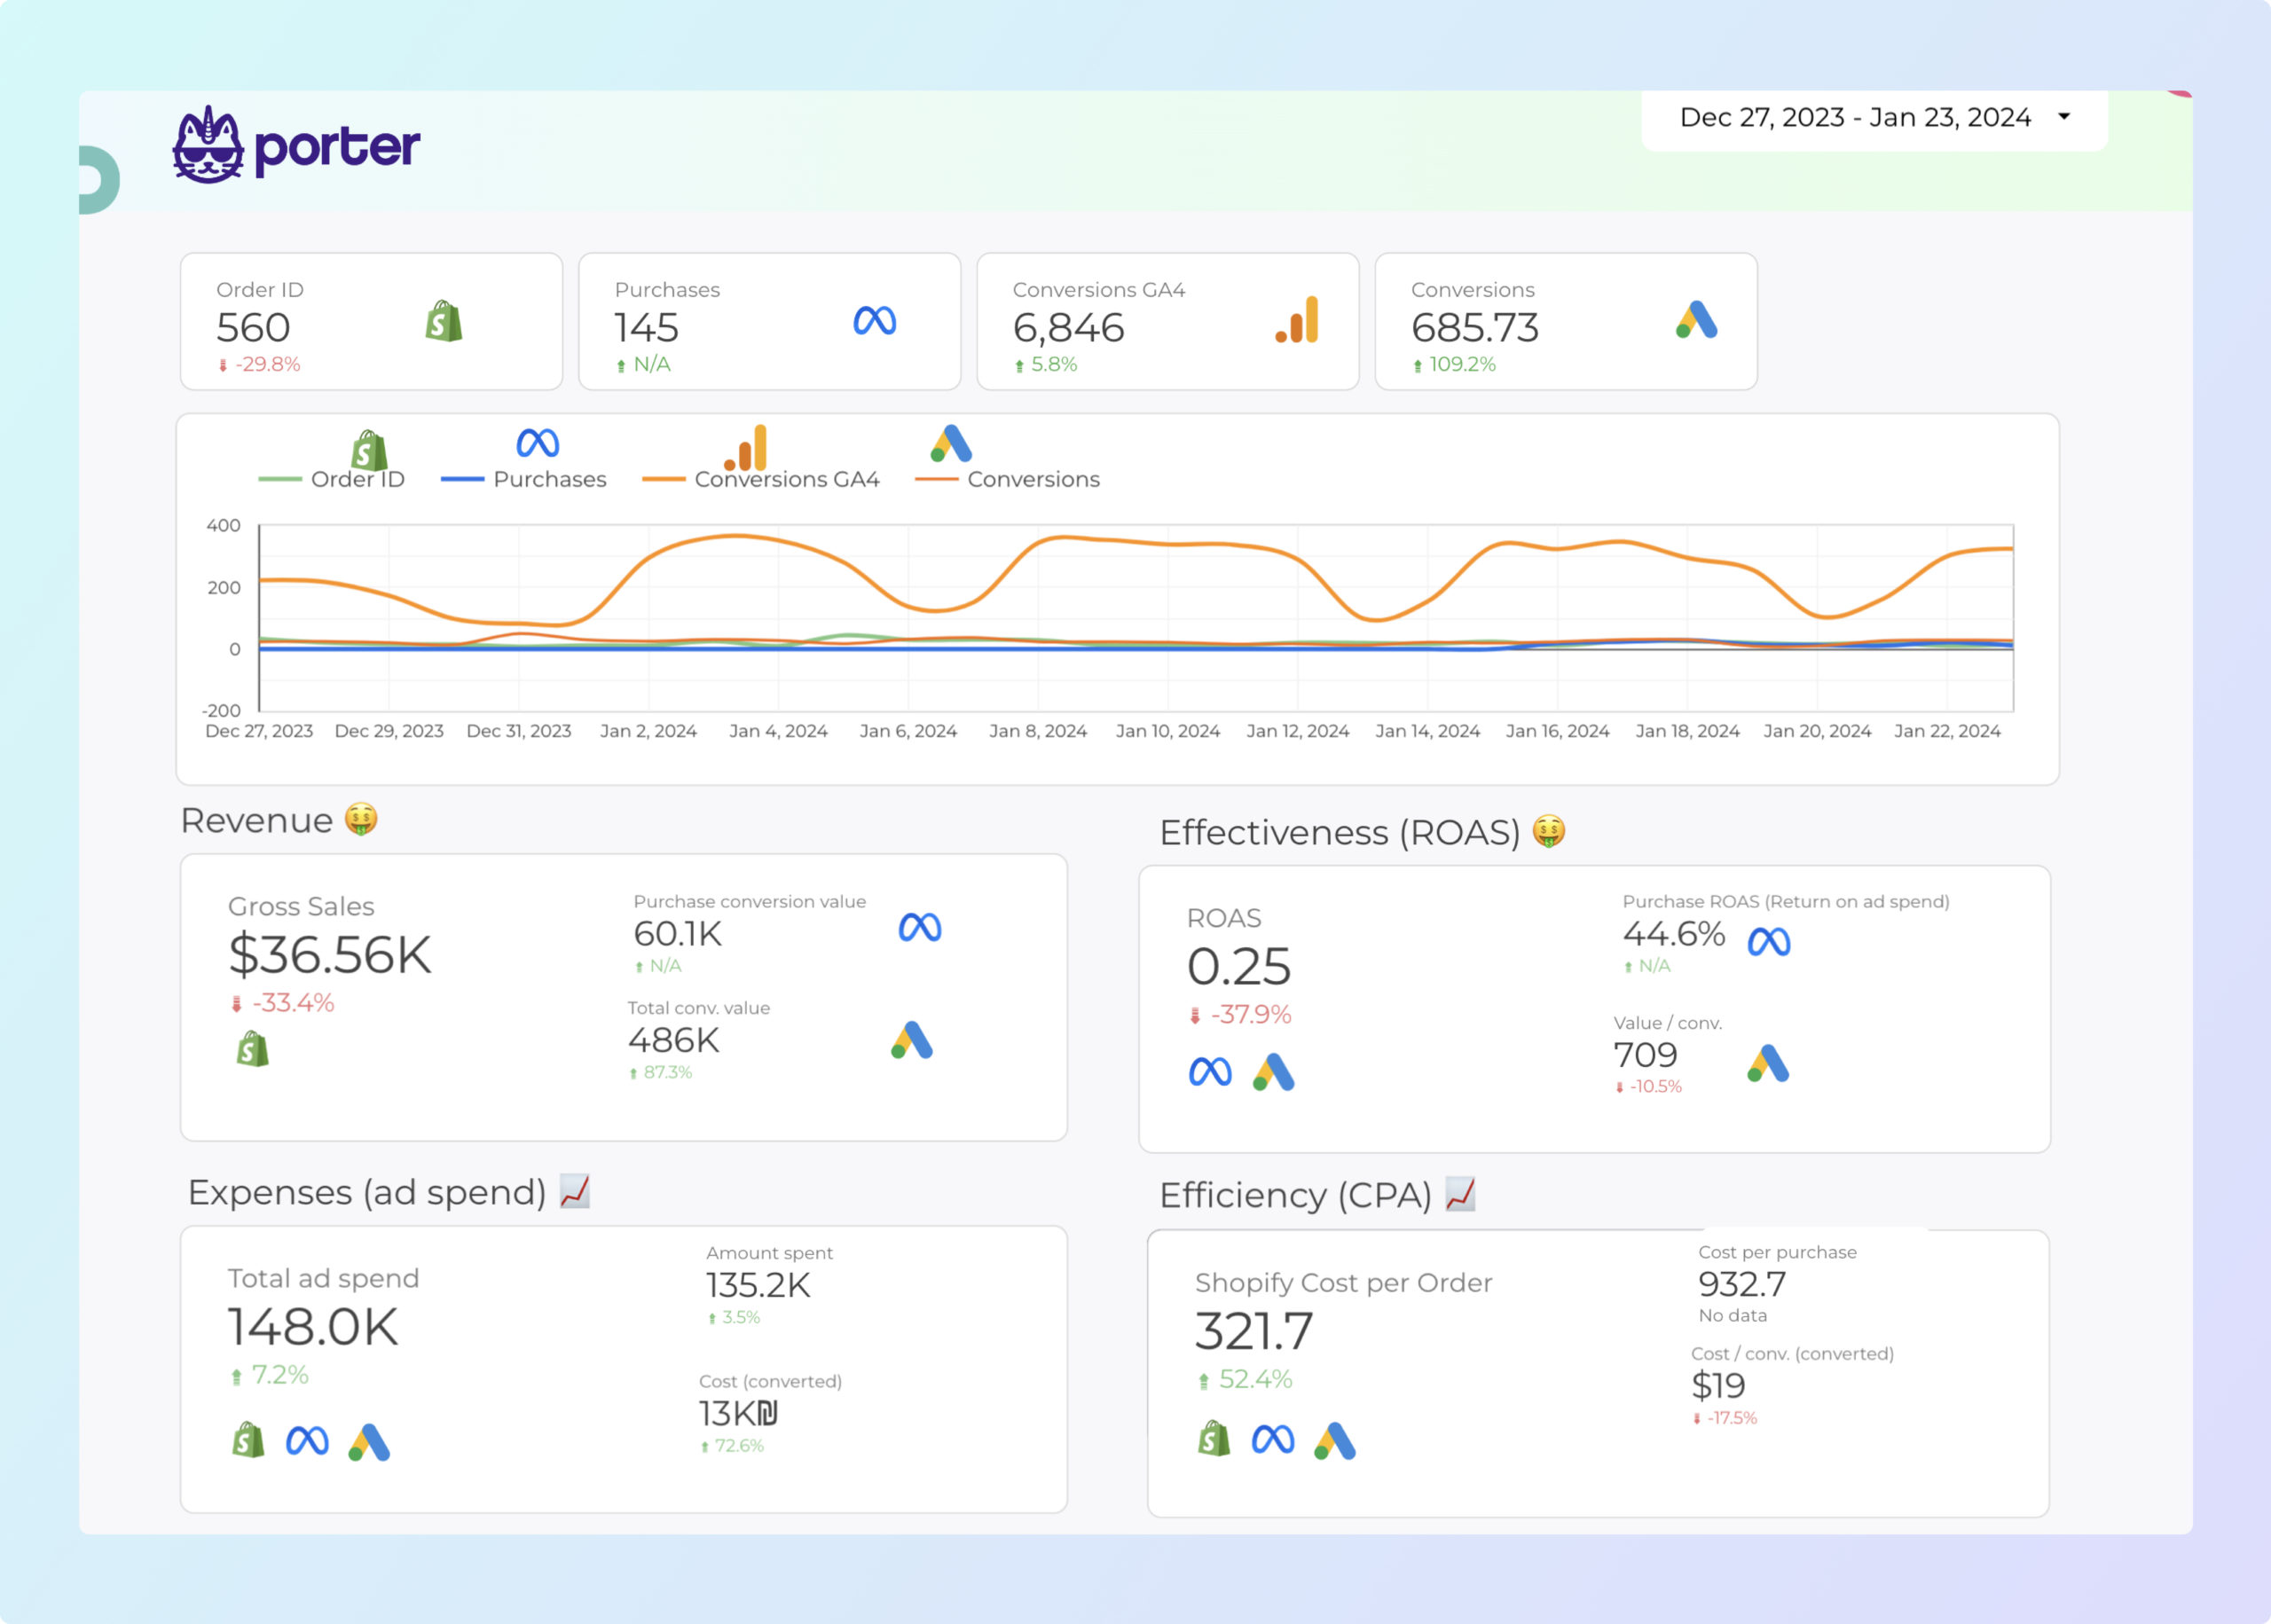
To build a Dropshipping dashboard, 1) connect your data and accounts from platforms like Shopify, Amazon, or eBay. 2) Select metrics such as sales, orders, revenue, and conversion rate to monitor performance. 3) Segment data by campaign, channel, audience, product, customer content, objective, and date to understand specific performance areas. 4) Add filters or buttons for interactivity, such as filtering by product category or date range. 5) Share your dashboard via PDF, scheduled emails, or links to relevant stakeholders.
A dropshipping dashboard is a tool used in e-commerce to monitor and analyze key performance metrics related to dropshipping operations. It integrates data from various platforms like Shopify, Amazon Seller Central, Google Analytics 4, and advertising channels such as Google Ads and Facebook Ads. The dashboard typically displays metrics such as impressions, clicks, ad spend, conversion rate, transactions, revenue, product views, orders, CTR, CPC, ROAS, sessions, and bounce rate. This helps businesses track their marketing efforts, sales performance, and overall operational efficiency in real-time.


 Shopify
 Facebook Ads
 Google Ads
 Impressions
 Conversion Rate
 Product Views