Like most of you, I’m an SEO guy. Chances are you’re kind of obsessed with tracking keyword rankings.
You also know about the opportunity of long-tail and short-tail keywords and why they matter, but do you know how much traffic you get from long-tail keywords, for instance?
And also, you may have a huge list of keywords on a Google Sheet, but how do you prioritize which one you should optimize for?
And finally, you know Keyword cannibalization matters, but how to know if you’re being affected by it?
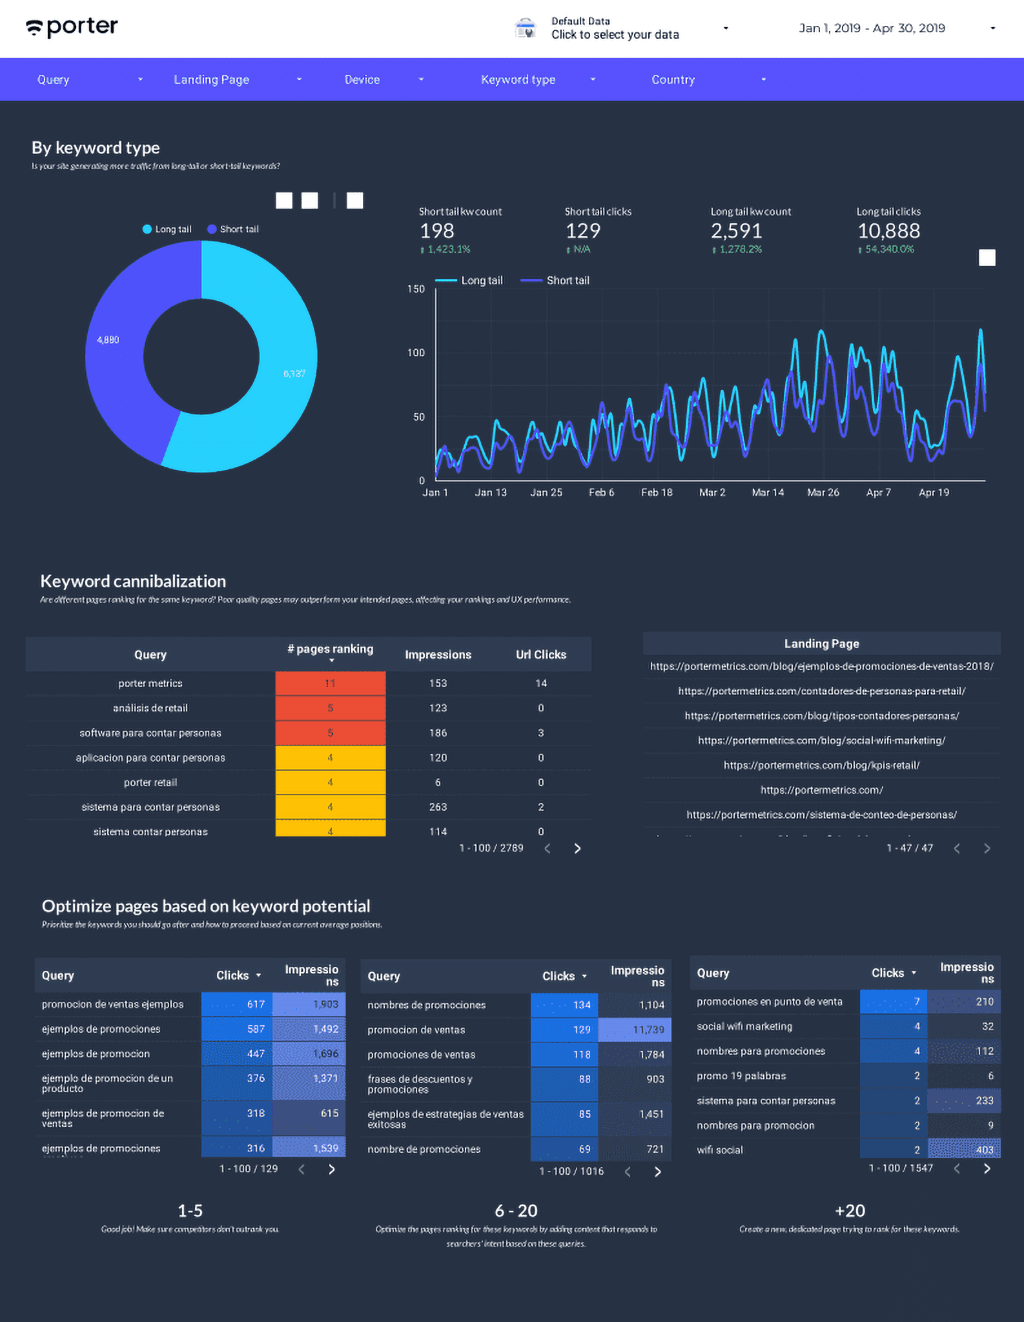
Now you will, with this week’s template. Get the template here.
If you want to install it, follow this setup guide—most Google Data Studio templates work the same.
But this time you don’t need to create a copy to visualize your website’s data.
How this template works
This time, you don’t need to create a copy. Instead, go to the Google Search Console widget in the dropdown menu and choose your website.
You should be using the Gmail or G Suite account that matches such sites.

Long-tail vs Short tail keywords
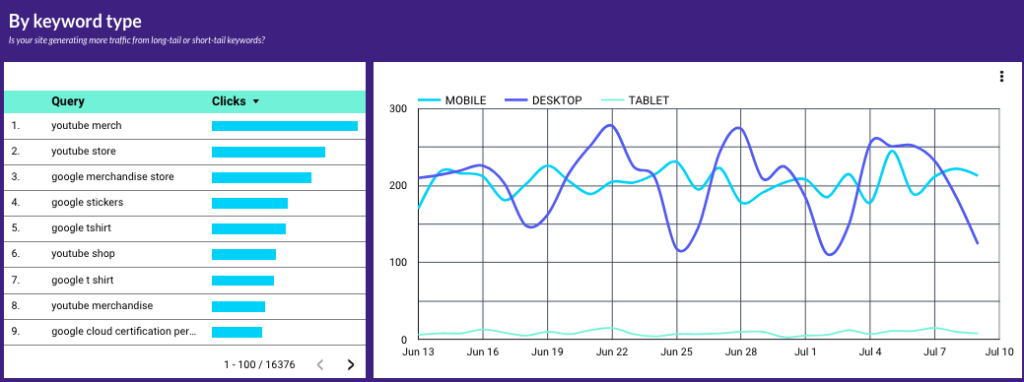
Visualize how much organic traffic and the number of keywords your site is ranking for broken down in short-tail and long-tail keywords.
Find keyword cannibalization
Keyword Cannibalization is when several pages on your site are competing for a keyword.
The threat happens when the lowest-quality pages outrank the one that you were actually intended to rank.
We use color format conditionals to expose critical keywords where you have more than 5 pages ranking for them. It is usual for your brand name — many pages of your site will rank for them.
Pro tip: click each keyword to visualize the pages that are ranking for it. That’s the beauty of interactive filters within visualizations.

Spot keywords and choose between updating and creating content
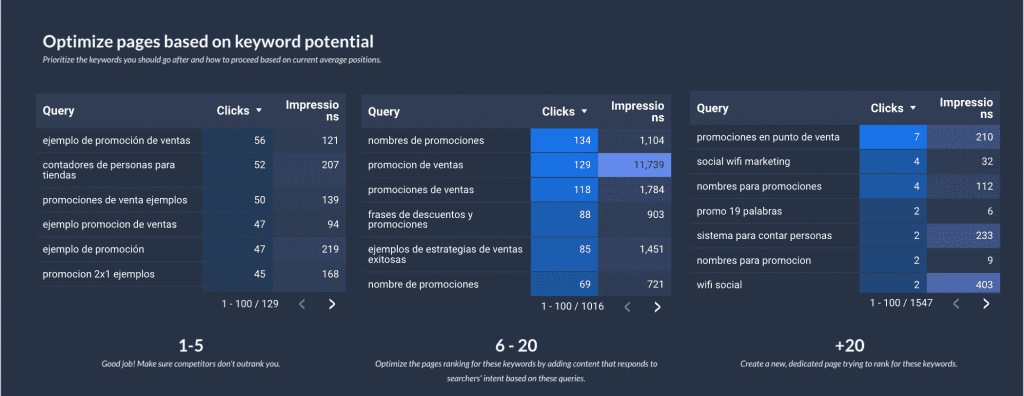
We created three tables; the first one shows the keywords your site is ranking for on the first page (1-5 position); the second one from 6 to 20; and the third one for keywords where your site is ranking +20.
If your site is showing on the 1st page of Google, it’s a win; if you’re in the top 3, that’s better.
The first table shows where you’re already winning—and what keywords you should use to prevent competitors from outranking you.
To me, those keywords you rank for in the 5th to 20th position are the ones you should prioritize.
You’re already ranking for them with your current content. You can spot an opportunity when you’re ranking for a keyword that you don’t even have content specifically targeting it.
If you’re already indirectly ranking for such keywords with an unintended page, you can update such a page by adding more content around such keywords to match the user’s intent or create a new one from scratch. Updating content is easier and faster than creating it.

How to set up a copy of this template
Setting up this template requires a few more steps than regularly.
The reason is that we use some custom formulas that are not transferred when a copy is created.
These formulas are for calculating the length of a query to determine if it is a short tail or long tail keyword.
Once you create a copy of this report, some of the charts will break.
I will help you fix it.
First, go to edit the report.
In the menu, click on Resource – Manage Added Data Sources.
You will find two Google Search Console data sources. Use the one for URL Impressions. You can tell it is URL and not Site as the metrics name contain the word URL.
Then, you will create the following field:
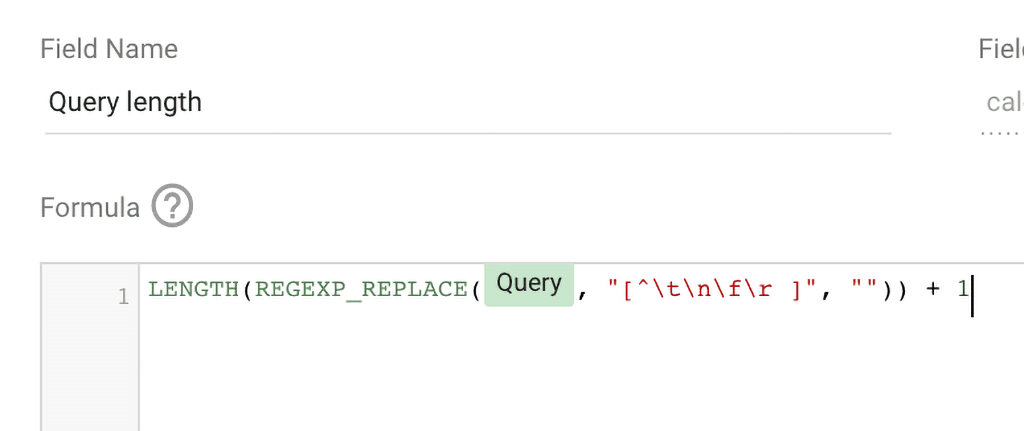
Copy and paste: LENGTH(REGEXP_REPLACE(Query, “[^\t\n\f\r ]”, “”)) + 1
If you’re not familiar with Regular Expressions, this one is calculating the length of the Queries. Every time it finds a word, counts 1. Call this new field Query length.
Now, we will create a new field to determine if these queries have 3 or fewer words to define them as short-tail, and if they have more than 3 words, they will be defined as long tail.
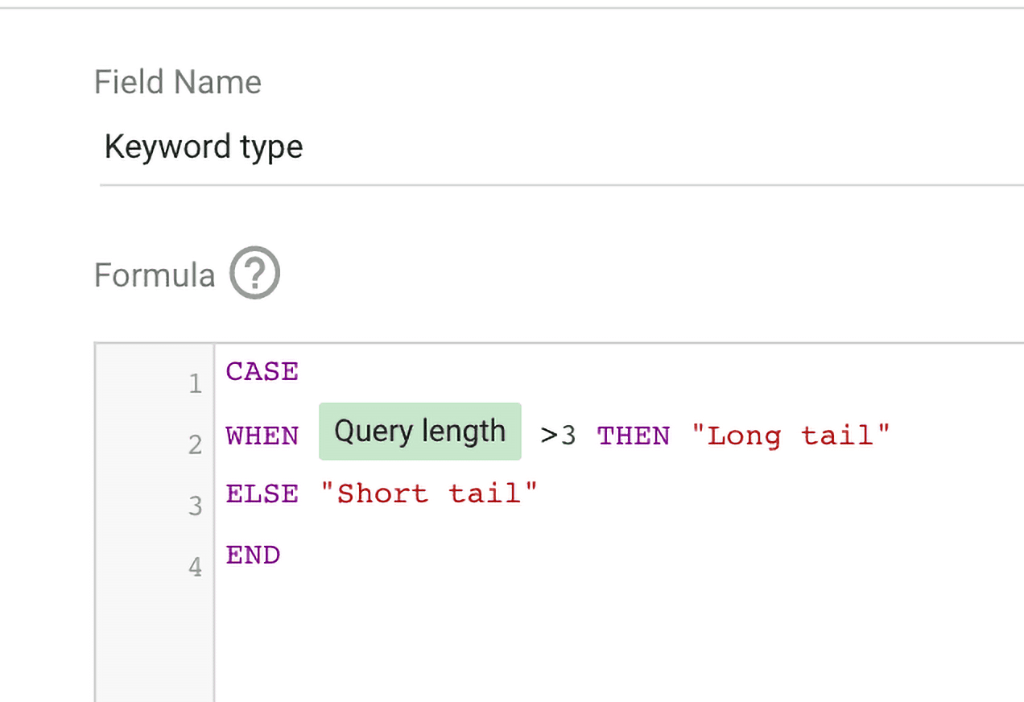
Copy and paste this formula:
CASE
WHEN Query length >3, THEN “Long tail”
ELSE “Short tail”
END
Finally, set up your visualizations like this:
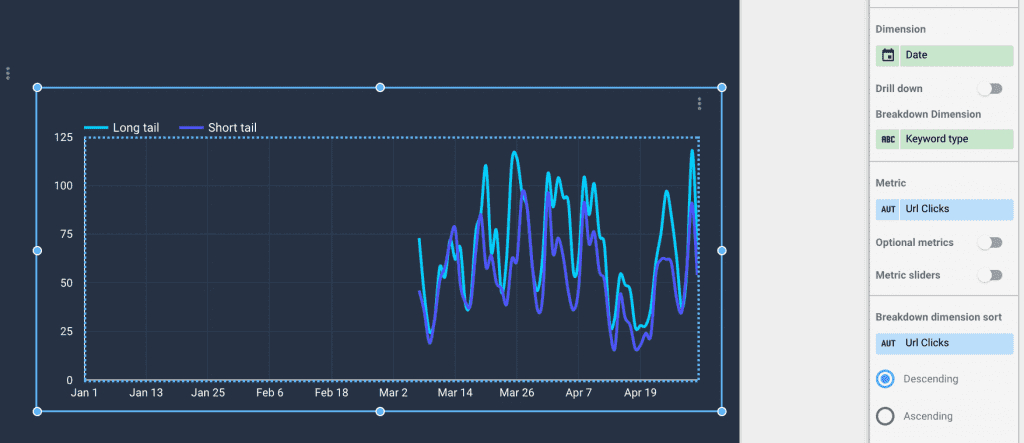
Dimension should be keyword type; you can use any metric.
Since you’re here
At Porter, we want to help you build beautiful visualizations with Google Data Studio.

