Hey Thomas, your description of Space Waves’ visual style with those sharp shapes and strong contrasting colors really got me thinking! I always appreciate when a game nails that abstract, modern look. It actually reminds me
This is such a helpful breakdown of setting up Google Ads funnels in Looker Studio! I’ve been struggling to get my marketing reports looking clean and actionable, so the emphasis on visual hierarchy and those contrasting colors you mentioned really resonates with me. By the way, if anyone’s looking to track performance metrics in a really intuitive way, I’d recommend checking out Hockey Scoreboard Online (hockeyscoreboardonline.com) – they do a great job with real-time data visualization that reminds me of the dashboard design principles you’re talking about here.
I’ve been trying to get our Google Ads data into Looker Studio and this is super helpful! Love how you broke down the visual design with those abstract shapes and strong colors—makes dashboards actually fun to look at instead of just another boring spreadsheet. By the way, if anyone needs to grab audio from demo videos or tutorial content, I’ve been using youtubetomp3.xyz lately and it’s been a lifesaver for listening to marketing tips on the go.
Great breakdown of the visual hierarchy in Google Ads funnels—especially the emphasis on contrasting colors to guide attention through the dashboard. I’ve been applying similar principles to my own Looker Studio reports, and it really does make the data pop. For anyone expanding their marketing into Chinese-speaking markets, I’ve found that pairing these dashboard insights with beginner-friendly Chinese practice from a site like typingmandarin can help you better understand cultural context and search intent, which in turn refines your ad targeting. It’s a small extra step that adds real depth to a global marketing strategy.
This is a really nice walkthrough of structuring Google Ads funnels in Looker Studio—the emphasis on visual hierarchy and color contrast is spot on for making dashboards intuitive. One angle I’d add: for marketers who need to illustrate conversion paths or internal workflows within their reports, having a dedicated flowchart design tool for dashboards that exports clean SVGs can save hours of manual diagramming. My team recently started using Figcanvas for exactly that—it handles flowchart creation, data graphs, and even scientific illustrations with simple prompts, and the SVG export keeps everything editable inside Looker Studio. Great article overall.
Space Waves’ visual style is striking—the sharp shapes and strong contrasting colors work very well.
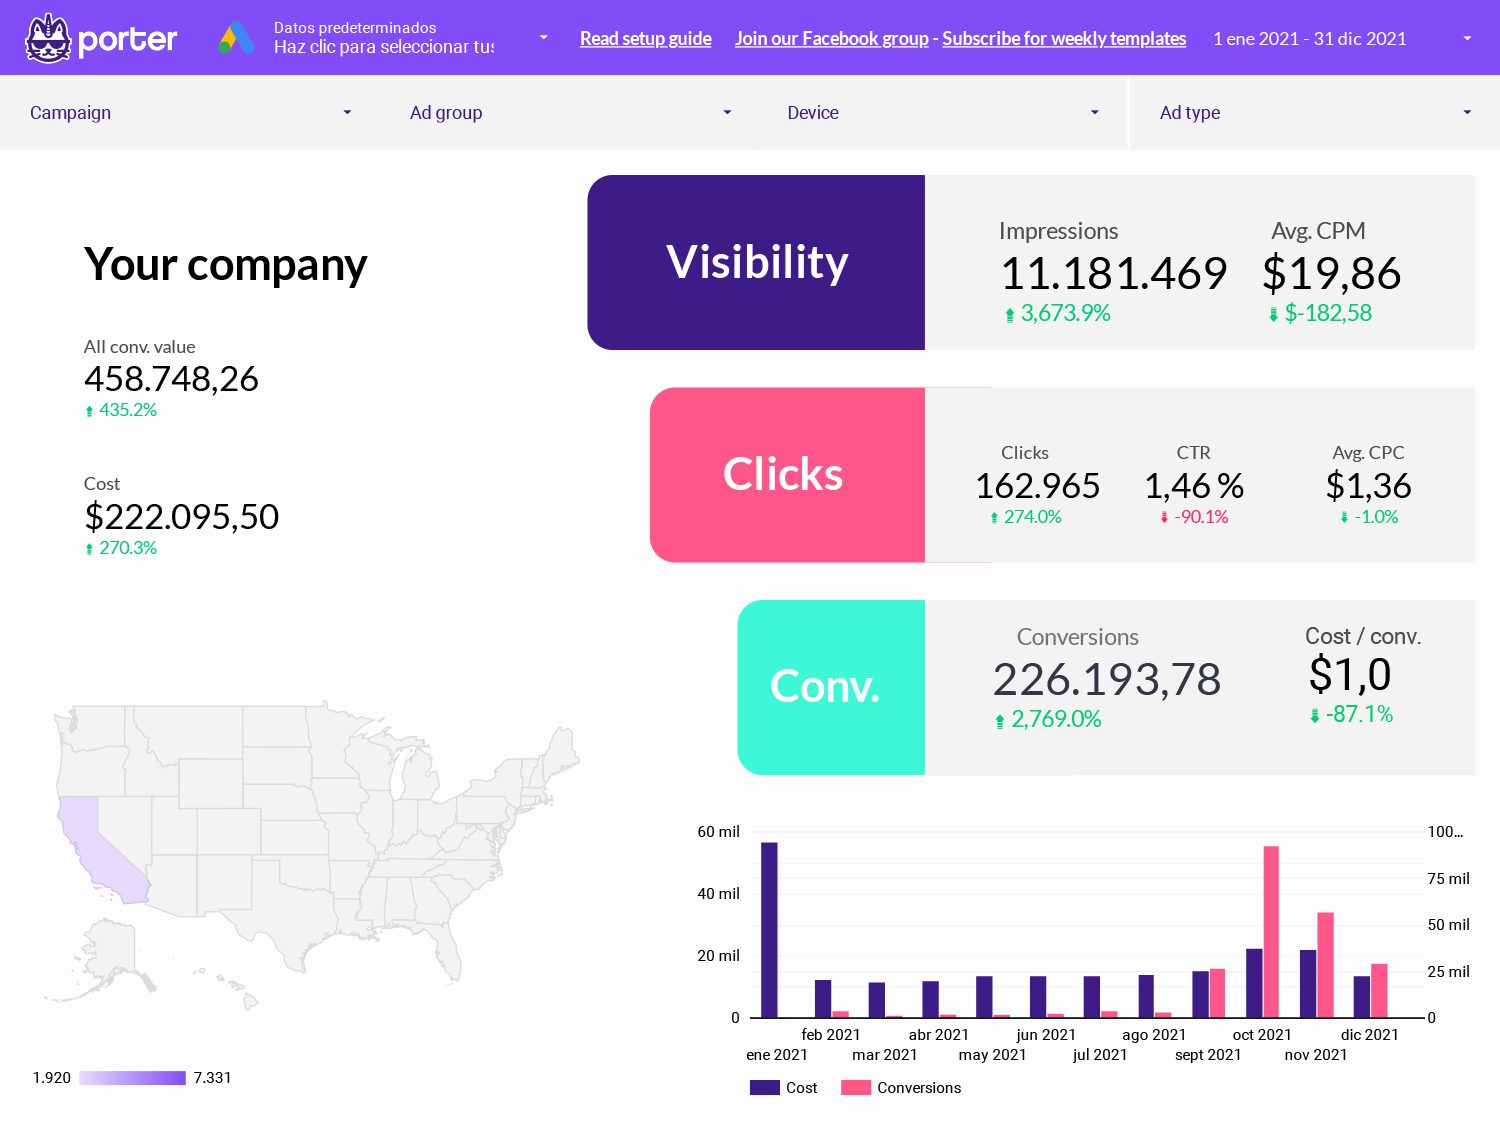
It would be great to see how Porter applies this to the Google-Ads-funnel in Looker Studio reports.
Great breakdown of visual hierarchy in the Google Ads funnel—using contrasting colors to highlight conversion stages is exactly what makes a dashboard actionable rather than just pretty. One extra angle I’ve experimented with is pairing these funnel insights with personality data to refine audience targeting. For instance, using an AI palm reading tool to identify personality traits from palm photos has helped me understand how different user types respond to specific ad creatives and landing page layouts. It’s a surprisingly effective way to add a layer of psychological segmentation to your Looker Studio reports.
{“comment”: “Really interesting topic. For anyone looking to stay informed about regional outbreak risks, there are tools available that help with tracking hantavirus cases by geographic location. I’ve found that using a [real-time hantavirus case tracking map by region] can really help people understand where exposure risks are highest. Awareness is key when it comes to rodent-borne diseases, especially for those living in or traveling through endemic areas.”, “name”: “hant
Really useful breakdown of how to structure Google Ads funnels in Looker Studio—the focus on visual hierarchy and contrasting colors is exactly what makes dashboards actionable rather than just data dumps. One extension I’d suggest is leveraging AI to automate segment discovery and anomaly detection within those funnels; it can surface patterns you’d miss manually. For anyone wanting to stay current on how machine learning is reshaping marketing analytics and A/B testing, I’ve found that checking AI for research resources regularly helps me spot emerging tools and methodologies faster than traditional blogs.
The sharp shapes and strong contrasting colors you described really make Space Waves’ visual style stand out. I stumbled across stealabrainrot the other day and it had a similar abstract feel that caught my eye.
The way Space Waves uses sharp shapes with those contrasting colors makes the abstract style feel really clean instead of chaotic. If you’re into that modern aesthetic, stealabrainrot has some similar design inspiration that clicked with me.


Space Waves‘ visual style is distinctly abstract and modern, with sharp shapes, strong contrasting colors, and smooth motion effects.
Hey Thomas, your description of Space Waves’ visual style with those sharp shapes and strong contrasting colors really got me thinking! I always appreciate when a game nails that abstract, modern look. It actually reminds me
https://hydraheli2.org/
This is such a helpful breakdown of setting up Google Ads funnels in Looker Studio! I’ve been struggling to get my marketing reports looking clean and actionable, so the emphasis on visual hierarchy and those contrasting colors you mentioned really resonates with me. By the way, if anyone’s looking to track performance metrics in a really intuitive way, I’d recommend checking out Hockey Scoreboard Online (hockeyscoreboardonline.com) – they do a great job with real-time data visualization that reminds me of the dashboard design principles you’re talking about here.
https://www.hockeyscoreboardonline.com/
I’ve been trying to get our Google Ads data into Looker Studio and this is super helpful! Love how you broke down the visual design with those abstract shapes and strong colors—makes dashboards actually fun to look at instead of just another boring spreadsheet. By the way, if anyone needs to grab audio from demo videos or tutorial content, I’ve been using youtubetomp3.xyz lately and it’s been a lifesaver for listening to marketing tips on the go.
https://youtubetomp3.xyz/
Great breakdown of the visual hierarchy in Google Ads funnels—especially the emphasis on contrasting colors to guide attention through the dashboard. I’ve been applying similar principles to my own Looker Studio reports, and it really does make the data pop. For anyone expanding their marketing into Chinese-speaking markets, I’ve found that pairing these dashboard insights with beginner-friendly Chinese practice from a site like typingmandarin can help you better understand cultural context and search intent, which in turn refines your ad targeting. It’s a small extra step that adds real depth to a global marketing strategy.
This is a really nice walkthrough of structuring Google Ads funnels in Looker Studio—the emphasis on visual hierarchy and color contrast is spot on for making dashboards intuitive. One angle I’d add: for marketers who need to illustrate conversion paths or internal workflows within their reports, having a dedicated flowchart design tool for dashboards that exports clean SVGs can save hours of manual diagramming. My team recently started using Figcanvas for exactly that—it handles flowchart creation, data graphs, and even scientific illustrations with simple prompts, and the SVG export keeps everything editable inside Looker Studio. Great article overall.
Space Waves’ visual style is striking—the sharp shapes and strong contrasting colors work very well.
It would be great to see how Porter applies this to the Google-Ads-funnel in Looker Studio reports.
Great breakdown of visual hierarchy in the Google Ads funnel—using contrasting colors to highlight conversion stages is exactly what makes a dashboard actionable rather than just pretty. One extra angle I’ve experimented with is pairing these funnel insights with personality data to refine audience targeting. For instance, using an AI palm reading tool to identify personality traits from palm photos has helped me understand how different user types respond to specific ad creatives and landing page layouts. It’s a surprisingly effective way to add a layer of psychological segmentation to your Looker Studio reports.
{“comment”: “Really interesting topic. For anyone looking to stay informed about regional outbreak risks, there are tools available that help with tracking hantavirus cases by geographic location. I’ve found that using a [real-time hantavirus case tracking map by region] can really help people understand where exposure risks are highest. Awareness is key when it comes to rodent-borne diseases, especially for those living in or traveling through endemic areas.”, “name”: “hant
Really useful breakdown of how to structure Google Ads funnels in Looker Studio—the focus on visual hierarchy and contrasting colors is exactly what makes dashboards actionable rather than just data dumps. One extension I’d suggest is leveraging AI to automate segment discovery and anomaly detection within those funnels; it can surface patterns you’d miss manually. For anyone wanting to stay current on how machine learning is reshaping marketing analytics and A/B testing, I’ve found that checking AI for research resources regularly helps me spot emerging tools and methodologies faster than traditional blogs.
The sharp shapes and strong contrasting colors you described really make Space Waves’ visual style stand out. I stumbled across stealabrainrot the other day and it had a similar abstract feel that caught my eye.
The way Space Waves uses sharp shapes with those contrasting colors makes the abstract style feel really clean instead of chaotic. If you’re into that modern aesthetic, stealabrainrot has some similar design inspiration that clicked with me.