A Social Media Client presentation report should include metrics such as Conversion metrics like Conversion rate, Cost per conversion, Conversion value; Engagement metrics like Likes, Shares, Comments; and Visibility metrics like Impressions, Reach, Follower Growth.
Then, segment and filter this data by dimensions like Campaign name, campaign duration, campaign budget; Audience demographics, audience interests, audience location; By hour, day, week, month, quarter, or year.
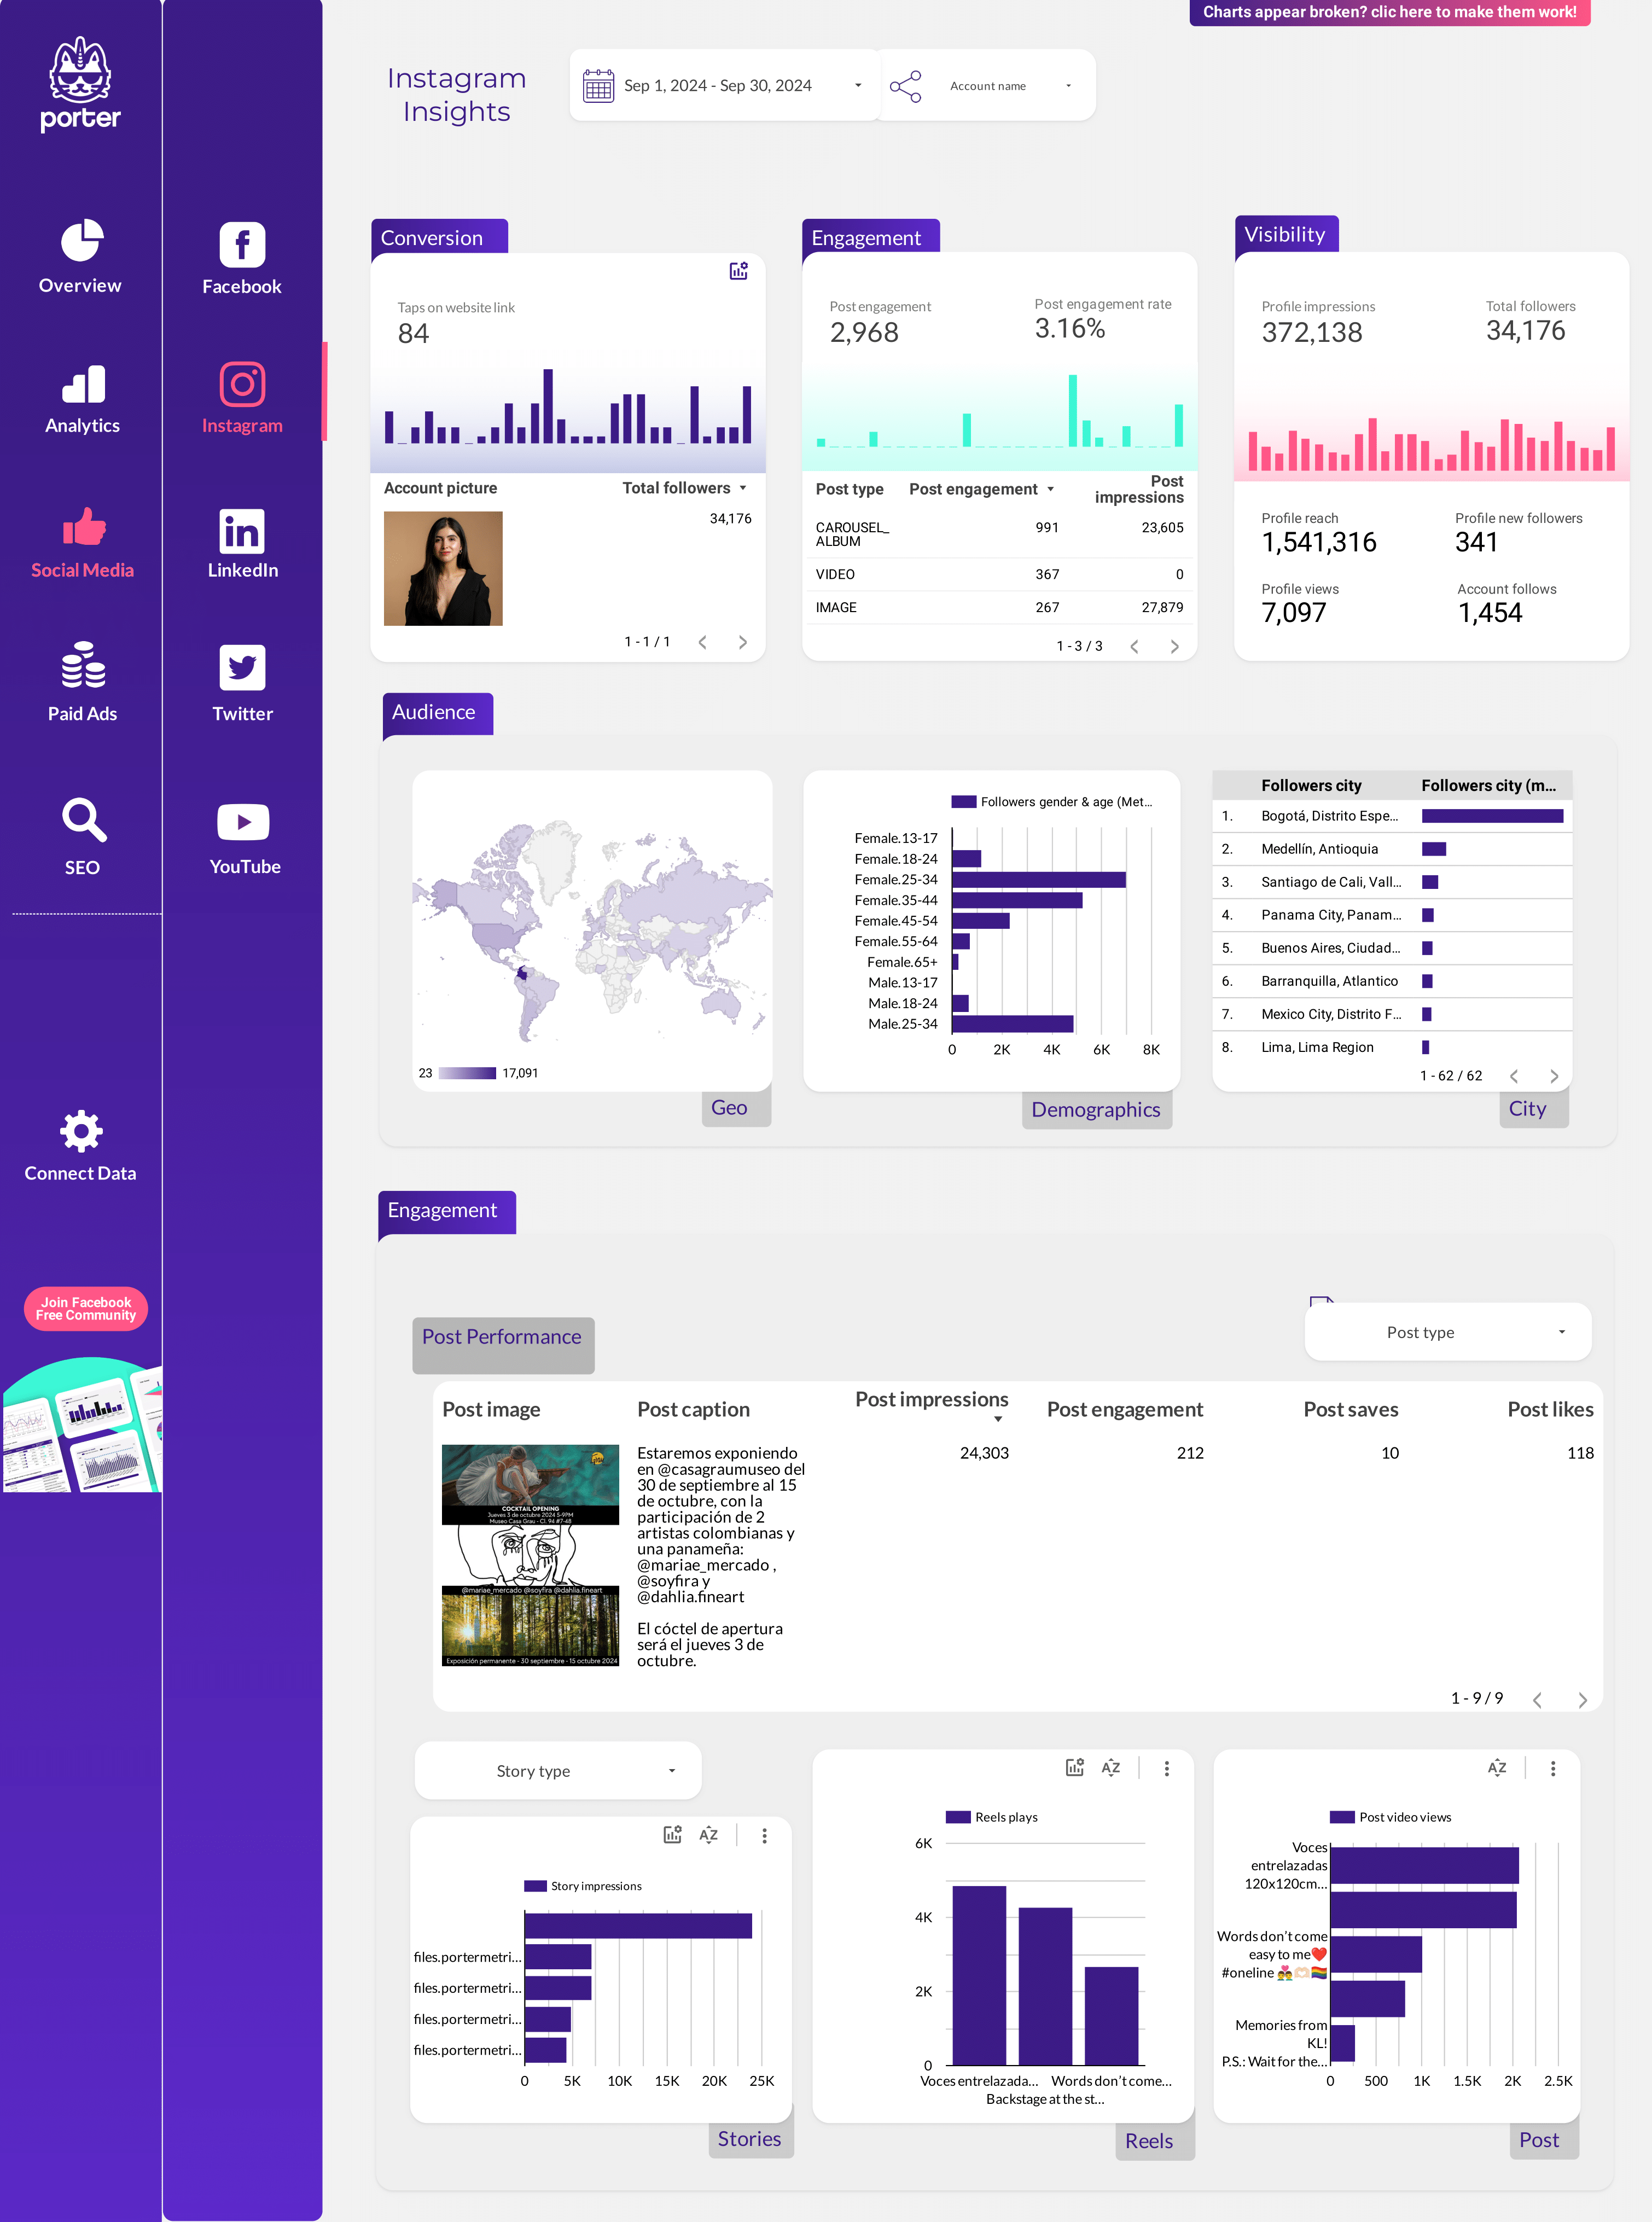
Once the data is ready, make sure to add buttons and filters to make your reports interactive, use custom colors and logos to make it white-label, and share via link, PDF, or email so your teams or clients can access it.
To analyze Social Media Client presentation data, follow these steps:
1) Define your use case: For a client presentation, focus on showcasing performance and insights.
2) Define your metrics: Choose metrics such as visibility (e.g., Instagram followers, reach), engagement (e.g., likes, comments, shares on Instagram and Facebook), and conversion (e.g., click-through rates, conversion rates from Instagram Insights).
3) Add context: Compare these metrics over time, against set objectives, and evaluate cost efficiency (e.g., cost per engagement) and effectiveness (e.g., engagement rate improvements). For example, compare engagement rates before and after a specific campaign to assess impact.
4) Segment your data: Break down the data by channel (e.g., Instagram vs Facebook), objective (e.g., brand awareness vs sales), campaign (e.g., product launches), product, and time (e.g., monthly performance). For instance, analyze the engagement of a holiday campaign on Instagram targeting Gen Z from November to December.
To build a Social Media Client presentation dashboard, start by connecting your social media data, such as Instagram Insights, to platforms like Google Sheets or Google Looker Studio. Choose metrics like conversion rate, cost per conversion, conversion value, likes, shares, comments, impressions, reach, and follower growth to map your funnel comprehensively. Segment and break down your data by channel, campaign, audience, product, or objective, using dimensions such as campaign name, campaign duration, campaign budget, audience demographics, audience interests, and audience location. This combination of metrics and segmentation will help you identify trends and areas for optimization. Share your dashboard via PDF, scheduled emails, or links for easy access.
A Social Media Client presentation dashboard is a visual tool that aggregates and displays key social media metrics to showcase performance and insights for clients. It connects social media data to platforms like Google Sheets or Looker Studio, using metrics such as conversion rates, engagement (likes, shares, comments), and visibility (impressions, reach). The data is segmented by factors like channel, campaign, and audience demographics to identify trends and optimize strategies. The dashboard can be shared via PDF, email, or links for easy client access.
Yes, Looker Studio allows you to download your report as a PDF. To do it, follow these steps:
Before downloading your report choose the date range you want to visualize on your report.
Click on the “File” menu at the top left corner of the screen.
Select “Download as” from the drop-down menu and choose “PDF.”
You can choose which pages you want to download, and also you can add a password to protect the report and add a link back to the online report.
Click on “Download” to save the report on your device.


 Instagram Insights
 Facebook Insights
 LinkedIn Pages
 Google Business Profile
 Pinterest
 TikTok
 Impressions
 Ad Spend
 Engagement Rate
 Followers