A LinkedIn Ads report should include metrics such as conversion metrics like Leads, Conversions, and Conversion Rate; engagement metrics like CTR (Click-through rate), Clicks, and Engagement Rate; and visibility metrics like Impressions, Reach, and Frequency.
Then, segment and filter this data by dimensions like Campaign name, campaign objective, campaign status, Job title, company industry, company size, and by time dimensions such as hour, day, week, month, quarter, or year.
Once the data is ready, make sure to add buttons and filters to make your reports interactive, use custom colors and logos to make it white-label, and share via link, PDF, or email so your teams or clients can access it.
To analyze LinkedIn Ads data for a client presentation, follow these steps:
1) Define your metrics: Focus on revenue, cost, and funnel metrics such as visibility (impressions, reach), engagement (clicks, likes, shares), and conversion metrics (click-through rates, lead generation rates).
2) Add context: Compare these metrics over time, against set objectives, and evaluate cost efficiency (e.g., cost per lead) and effectiveness (e.g., conversion rate from impressions to leads). For instance, analyze how the cost per lead has changed over the last quarter and how it aligns with your lead generation goals.
3) Segment your data: Break down the data by channel (e.g., LinkedIn Sponsored Content vs. Text Ads), objective (e.g., brand awareness vs. lead generation), campaign (e.g., Q4 B2B lead generation campaign), product (e.g., different service offerings), and time (e.g., monthly or quarterly performance). For example, evaluate the performance of a B2B lead generation campaign targeting decision-makers in the tech industry over the past six months.
To build a LinkedIn Ads dashboard, start by connecting your LinkedIn Ads data to platforms like Google Sheets or Google Looker Studio. Then, choose metrics such as Leads, Conversions, Conversion Rate, CTR (Click-through rate), Clicks, Engagement Rate, Impressions, Reach, and Frequency to fully map your funnel. Segment and break down your data by channel, campaign, audience, product, or objective, with dimensions such as Campaign name, campaign objective, campaign status, Job title, company industry, and company size. The combination of these metrics and segmentation will help you spot trends and identify areas for optimization. Share your dashboard via PDF, scheduled emails, or links for easy access.
A LinkedIn Ads dashboard is a visual tool that connects LinkedIn Ads data to platforms like Google Sheets or Looker Studio, allowing users to track and analyze key metrics such as Leads, Conversions, CTR, Clicks, Engagement Rate, Impressions, and Reach. It segments data by dimensions like campaign, audience, and time, helping identify trends and optimization areas. The dashboard can be shared via PDF, email, or links for easy access.
Yes, Looker Studio allows you to download your report as a PDF. To do it, follow these steps:
Before downloading your report choose the date range you want to visualize on your report.
Click on the “File” menu at the top left corner of the screen.
Select “Download as” from the drop-down menu and choose “PDF.”
You can choose which pages you want to download, and also you can add a password to protect the report and add a link back to the online report.
Click on “Download” to save the report on your device.
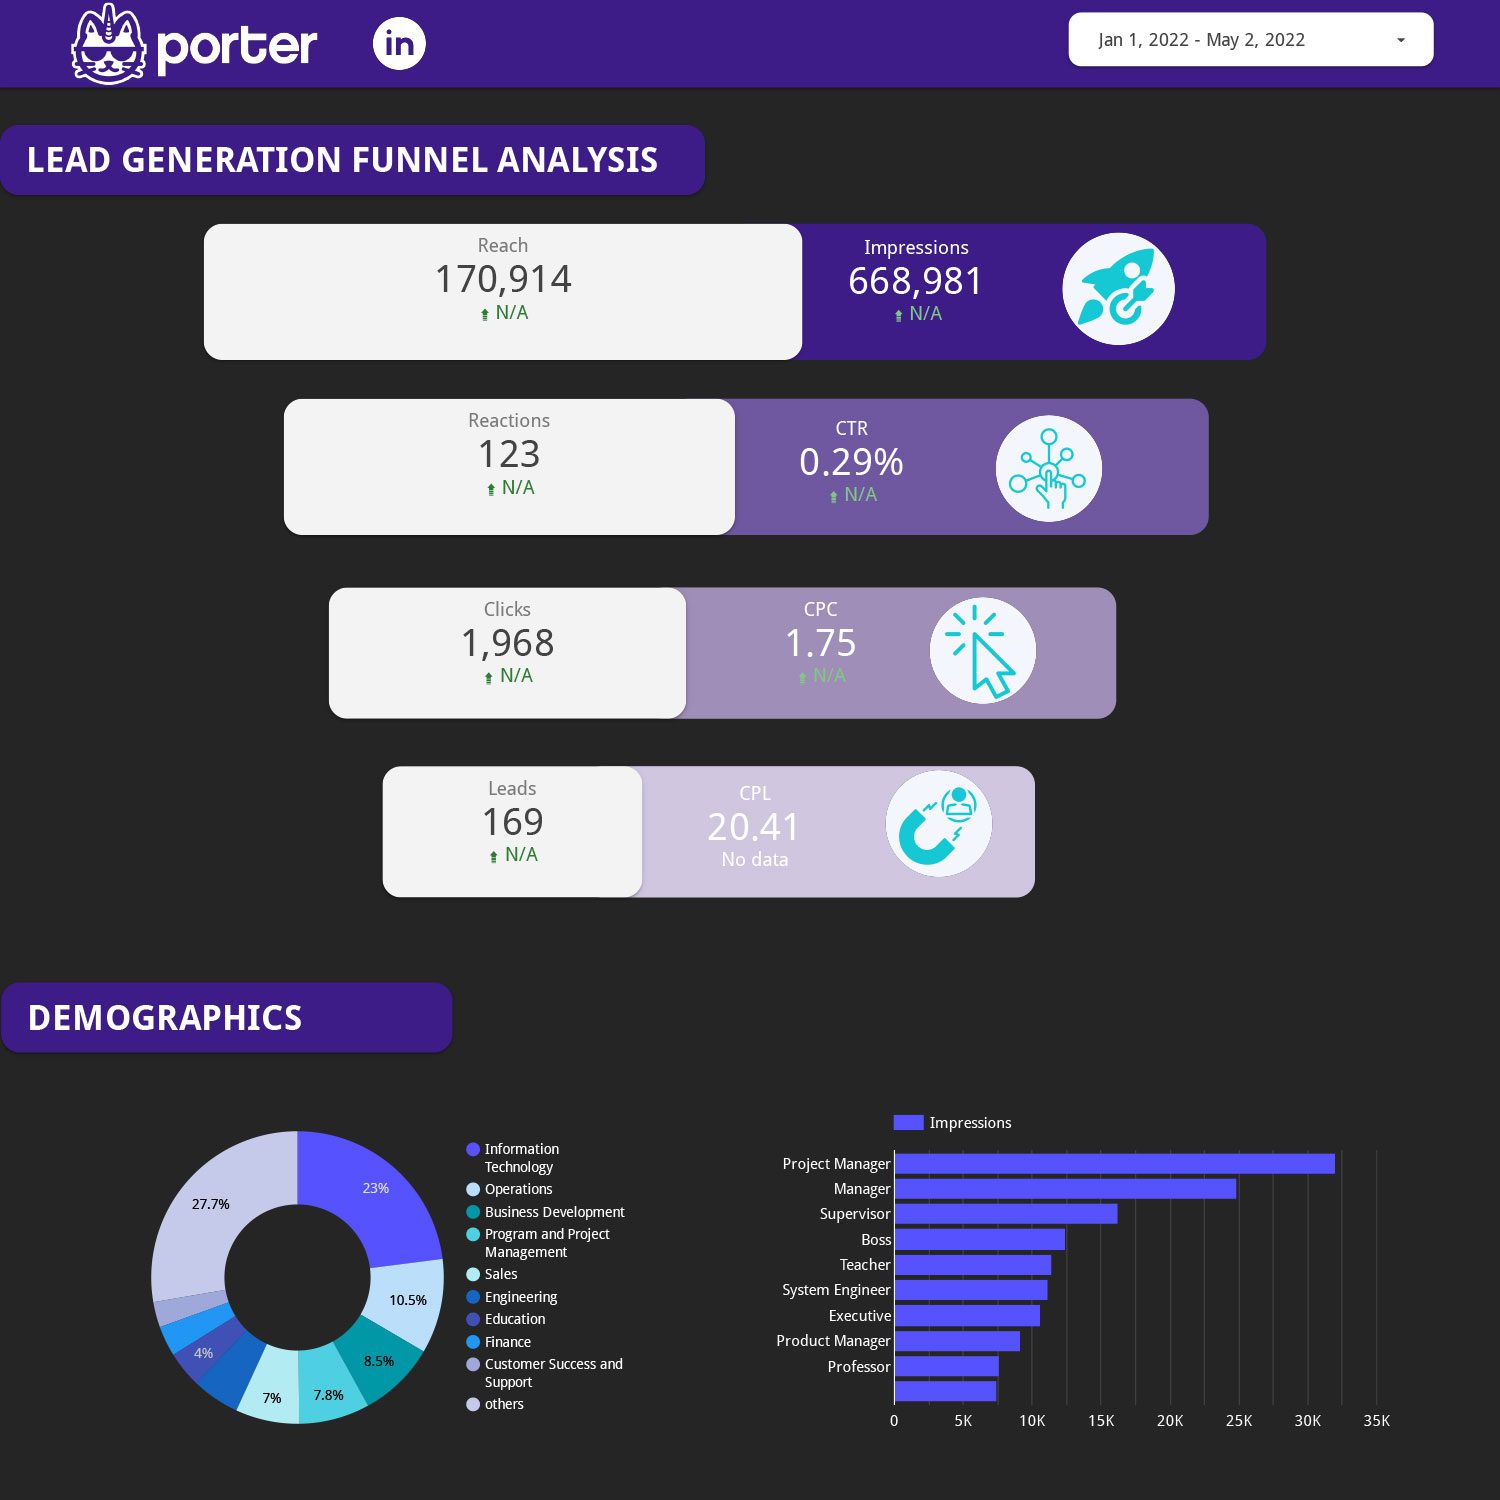


 LinkedIn Ads
 Impressions