


7 best Marketing campaign performance reporting and dashobards tools we tested in 2024
Review the best Marketing campaign performance reporting tools by features, pricing, user experience, and reviews
7 best LinkedIn Pages reporting and dashobards tools we tested in 2024
Review the best LinkedIn Pages reporting tools by features, pricing, user experience, and reviews
7 best Marketing ETL reporting and dashobards tools we tested in 2024
Review the best Marketing ETL reporting tools by features, pricing, user experience, and reviews
7 best Dropshipping reporting and dashobards tools we tested in 2024
Review the best Dropshipping reporting tools by features, pricing, user experience, and reviews
7 best Marketing data warehouse reporting and dashobards tools we tested in 2024
As a marketer and Marketing data warehouse data analyst, I’ve tested and compared some of the best Marketing data warehouse reporting and dashboards tools ,including: Porter Metrics, Supermetrics, Funnel IO, Windsor AI, Power My Analytics, Dataslayer, AgencyAnalytics, and Polar Analytics. These reviews are written by me, Juan, founder of Porter. As a marketer and tech […]
7 best SaaS reporting and dashobards tools we tested in 2024
Review the best SaaS reporting tools by features, pricing, user experience, and reviews
7 best Marketing OKR reporting and dashobards tools we tested in 2024
Review the best Marketing OKR reporting tools by features, pricing, user experience, and reviews
How to design Looker Studio reports and customize them
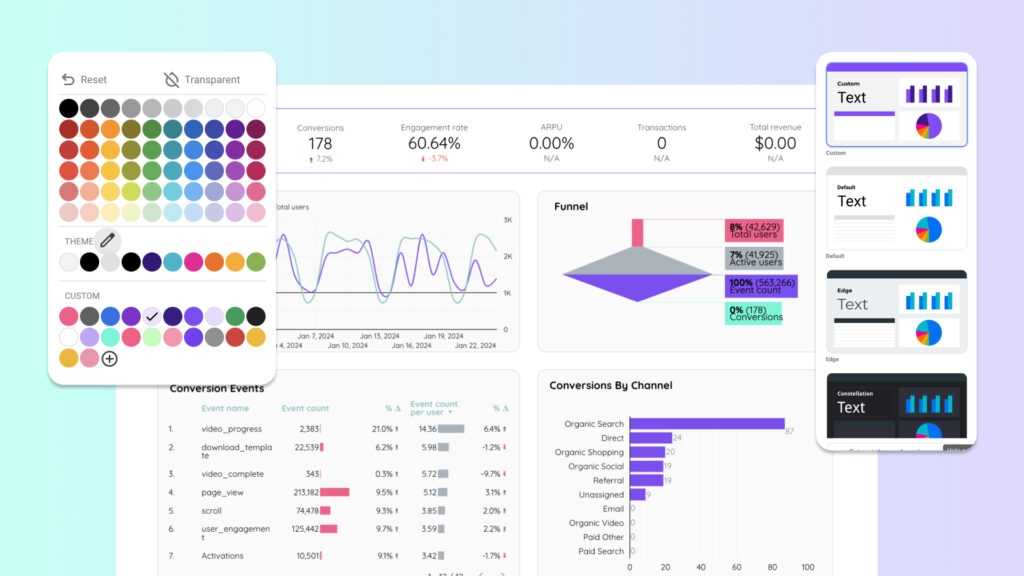
In this tutorial, you’ll learn how to design Looker Studio reports, starting from the theme and layout, editing charts, and adding filters and buttons to make them interactive. No good design will save you if you don’t have the fundamentals right, such as the most important metrics and KPIs, and a good narrative to support […]
How to add charts and graphs to Looker Studio
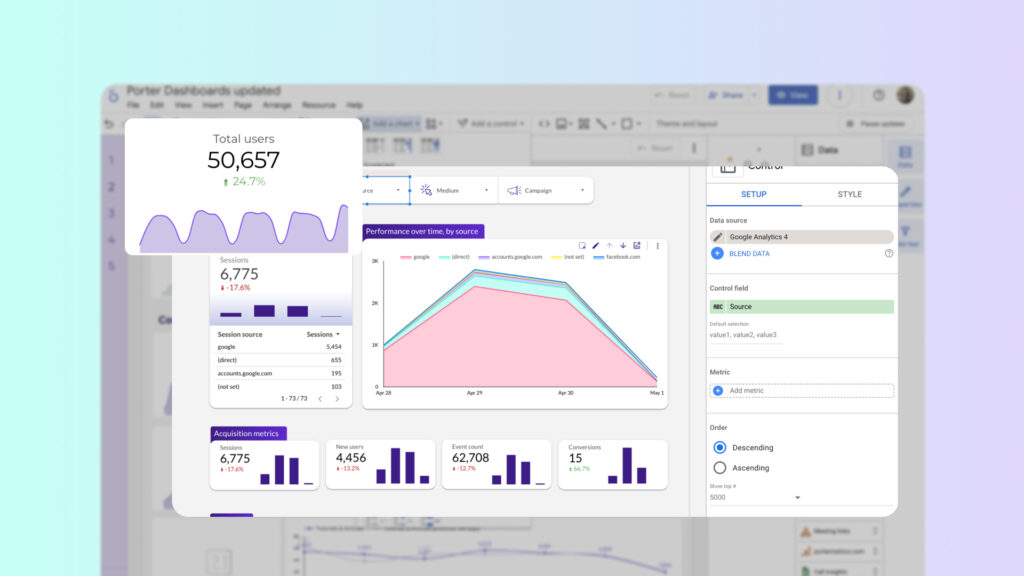
To create a good report you have to understand how to create and edit charts on Looker Studio. If you want better reports, you have to understand: Combining these two ideas will help you create engaging, useful reports. I will cover the step-by-step process of creating charts, the different types, customization options, and interactive filters- […]