A PPC Funnel report should include the following elements:
1. Campaign Name
2. Date
3. Impressions
4. Clicks
5. Ad Spend
6. Click-Through Rate (CTR)
7. Cost Per Click (CPC)
8. Conversions
9. Conversion Rate
10. Platform-specific metrics:
– Facebook: Page Likes, Ad ID
– Google: Quality Score, Keyword
– LinkedIn: Engagement Rate, Company Name
– TikTok: Video Views, Hashtag
– Twitter: Retweets, Handle
These elements provide a comprehensive overview of the performance across different stages of the PPC funnel for various advertising platforms.
To analyze PPC funnel data, follow these steps:
1. **Collect Data**: Gather data from various platforms like Facebook Ads, Google Ads, LinkedIn Ads, TikTok Ads, and Twitter Ads. Key metrics include impressions, clicks, ad spend, CTR, CPC, conversions, and conversion rate.
2. **Segment by Campaign**: Break down data by campaign name to understand performance across different campaigns.
3. **Evaluate Metrics**:
– **Impressions and Clicks**: Assess the reach and engagement of your ads.
– **CTR and CPC**: Determine the effectiveness and cost-efficiency of your ads.
– **Conversions and Conversion Rate**: Measure the success in achieving desired actions.
4. **Platform-Specific Analysis**:
– **Facebook**: Look at page likes and ad ID performance.
– **Google**: Analyze quality score and keyword effectiveness.
– **LinkedIn**: Check engagement rate and company name impact.
– **TikTok**: Review video views and hashtag performance.
– **Twitter**: Evaluate retweets and handle engagement.
5. **Identify Trends and Patterns**: Look for trends over time by analyzing data by date.
6. **Optimize**: Use insights to adjust targeting, ad creatives, and budget allocation to improve performance.
7. **Report**: Summarize findings and recommendations for stakeholders.
To build a PPC Funnel dashboard, follow these steps:
1. **Data Collection**: Gather data from various ad platforms like Facebook Ads, Google Ads, LinkedIn Ads, TikTok Ads, and Twitter Ads. Key metrics to collect include Impressions, Clicks, Ad Spend, CTR, CPC, Conversions, and Conversion Rate.
2. **Organize Data**: Structure the data in a base with fields such as Campaign Name, Date, Ad ID, Keyword, Company Name, Hashtag, and Handle for easy reference and filtering.
3. **Visualization**: Use a dashboard tool to visualize the data. Create charts and graphs to display metrics like Impressions, Clicks, CTR, CPC, and Conversion Rate. Include specific platform metrics like Facebook Page Likes, Google Quality Score, LinkedIn Engagement Rate, TikTok Video Views, and Twitter Retweets.
4. **Funnel Stages**: Define the stages of your PPC funnel (e.g., Awareness, Consideration, Conversion) and map the metrics to these stages to track performance at each level.
5. **Analysis and Optimization**: Regularly analyze the dashboard to identify trends and areas for improvement. Use insights to optimize campaigns and improve ROI.
Ensure the dashboard is updated regularly to reflect the latest data for accurate analysis.
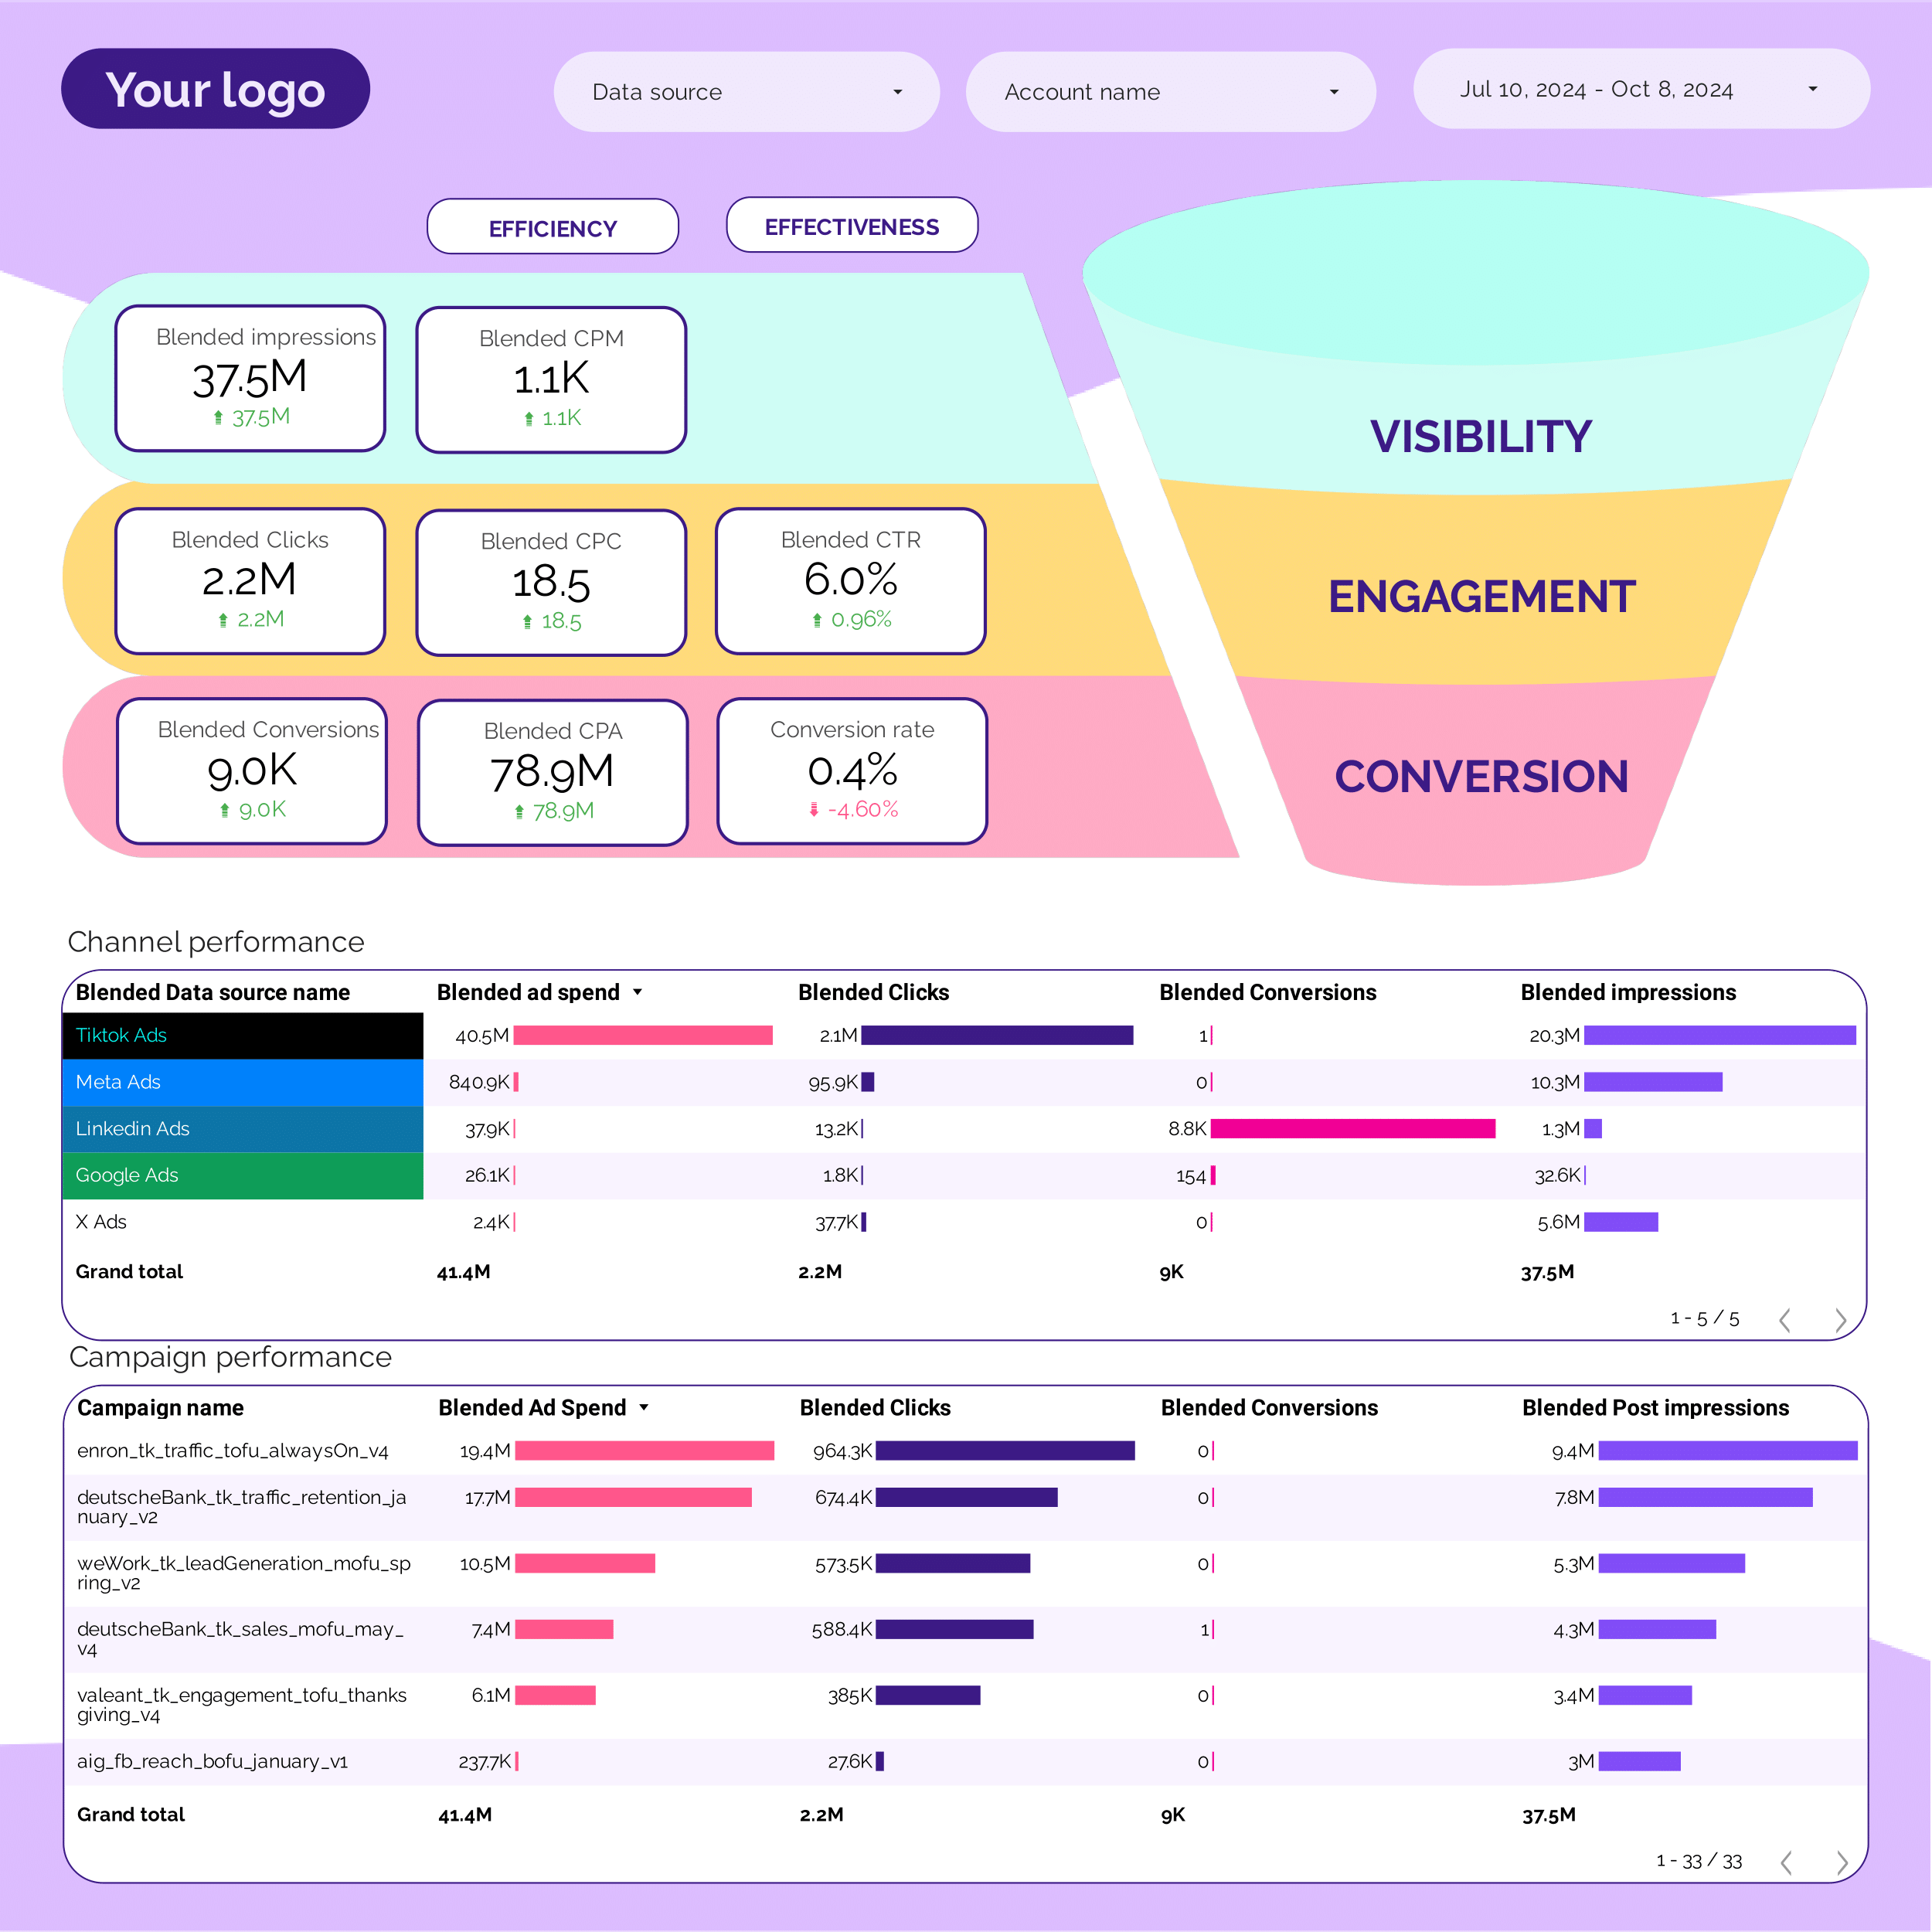
A PPC Funnel dashboard is a tool used to visualize and analyze the performance of pay-per-click advertising campaigns across various platforms like Facebook Ads, Google Ads, LinkedIn Ads, TikTok Ads, and Twitter Ads. It tracks key metrics such as impressions, clicks, ad spend, CTR (click-through rate), CPC (cost per click), conversions, and conversion rate. This dashboard helps marketers understand the effectiveness of their ad campaigns and optimize their strategies to improve ROI.
Can I download this template in PDF?


 Impressions
 Page Likes
 Quality Score
 Engagement Rate
 Video Views
 Retweets