A PPC campaign performance report should include the following elements:
1. Campaign Name
2. Date Range
3. Platform (e.g., Google Ads, Facebook Ads, TikTok Ads, LinkedIn Ads, Twitter Ads)
4. Impressions
5. Clicks
6. Ad Spend
7. Click-Through Rate (CTR)
8. Cost Per Click (CPC)
9. Conversions
10. Conversion Rate
11. Bounce Rate
12. Sessions
13. Users
14. Page Views
15. Reach
16. Engagement Rate
17. Video Views (if applicable)
18. Ad ID
19. Ad Set Name
20. Post ID and Post Type (for social media platforms)
These metrics provide a comprehensive overview of the campaign’s performance across different platforms.
To analyze PPC campaign performance data, consider the following metrics:
1. Impressions: Measure how often your ads are shown.
2. Clicks: Track the number of times users click on your ads.
3. CTR (Click-Through Rate): Calculate by dividing clicks by impressions to assess ad effectiveness.
4. CPC (Cost Per Click): Determine the average cost for each click.
5. Conversions: Count the number of desired actions taken by users after clicking the ad.
6. Ad Spend: Monitor the total amount spent on the campaign.
7. Bounce Rate: Evaluate the percentage of users who leave the site after viewing only one page.
8. Engagement Rate: Analyze user interaction with the ad content.
9. Reach: Identify the number of unique users who see your ad.
10. Platform Performance: Compare performance across platforms like Facebook, Google, LinkedIn, TikTok, and Twitter.
Use these metrics to identify trends, optimize ad spend, and improve overall campaign effectiveness.
To build a PPC Campaign performance dashboard, follow these steps:
1. **Data Collection**: Gather data from various platforms like Google Ads, Facebook Ads, LinkedIn Ads, TikTok Ads, and Twitter Ads. Use APIs or export data manually.
2. **Metrics Selection**: Choose key performance indicators (KPIs) such as Impressions, Clicks, Ad Spend, CTR (Click-Through Rate), CPC (Cost Per Click), Conversions, Bounce Rate, Sessions, Users, Page Views, Reach, Engagement Rate, and Video Views.
3. **Data Integration**: Use a data integration tool or software to consolidate data from different platforms into a single database or spreadsheet.
4. **Dashboard Tool**: Select a dashboard tool like Google Data Studio, Tableau, or Power BI to visualize the data.
5. **Design Layout**: Organize the dashboard layout to display metrics by platform and campaign. Include filters for date ranges and platforms.
6. **Visualization**: Use charts, graphs, and tables to represent data clearly. Ensure the dashboard is easy to interpret and highlights key insights.
7. **Automation**: Set up automated data refreshes to keep the dashboard up-to-date with the latest performance data.
8. **Testing and Feedback**: Test the dashboard for accuracy and usability. Gather feedback from stakeholders and make necessary adjustments.
9. **Deployment**: Share the dashboard with relevant team members and stakeholders for ongoing monitoring and analysis of PPC campaign performance.
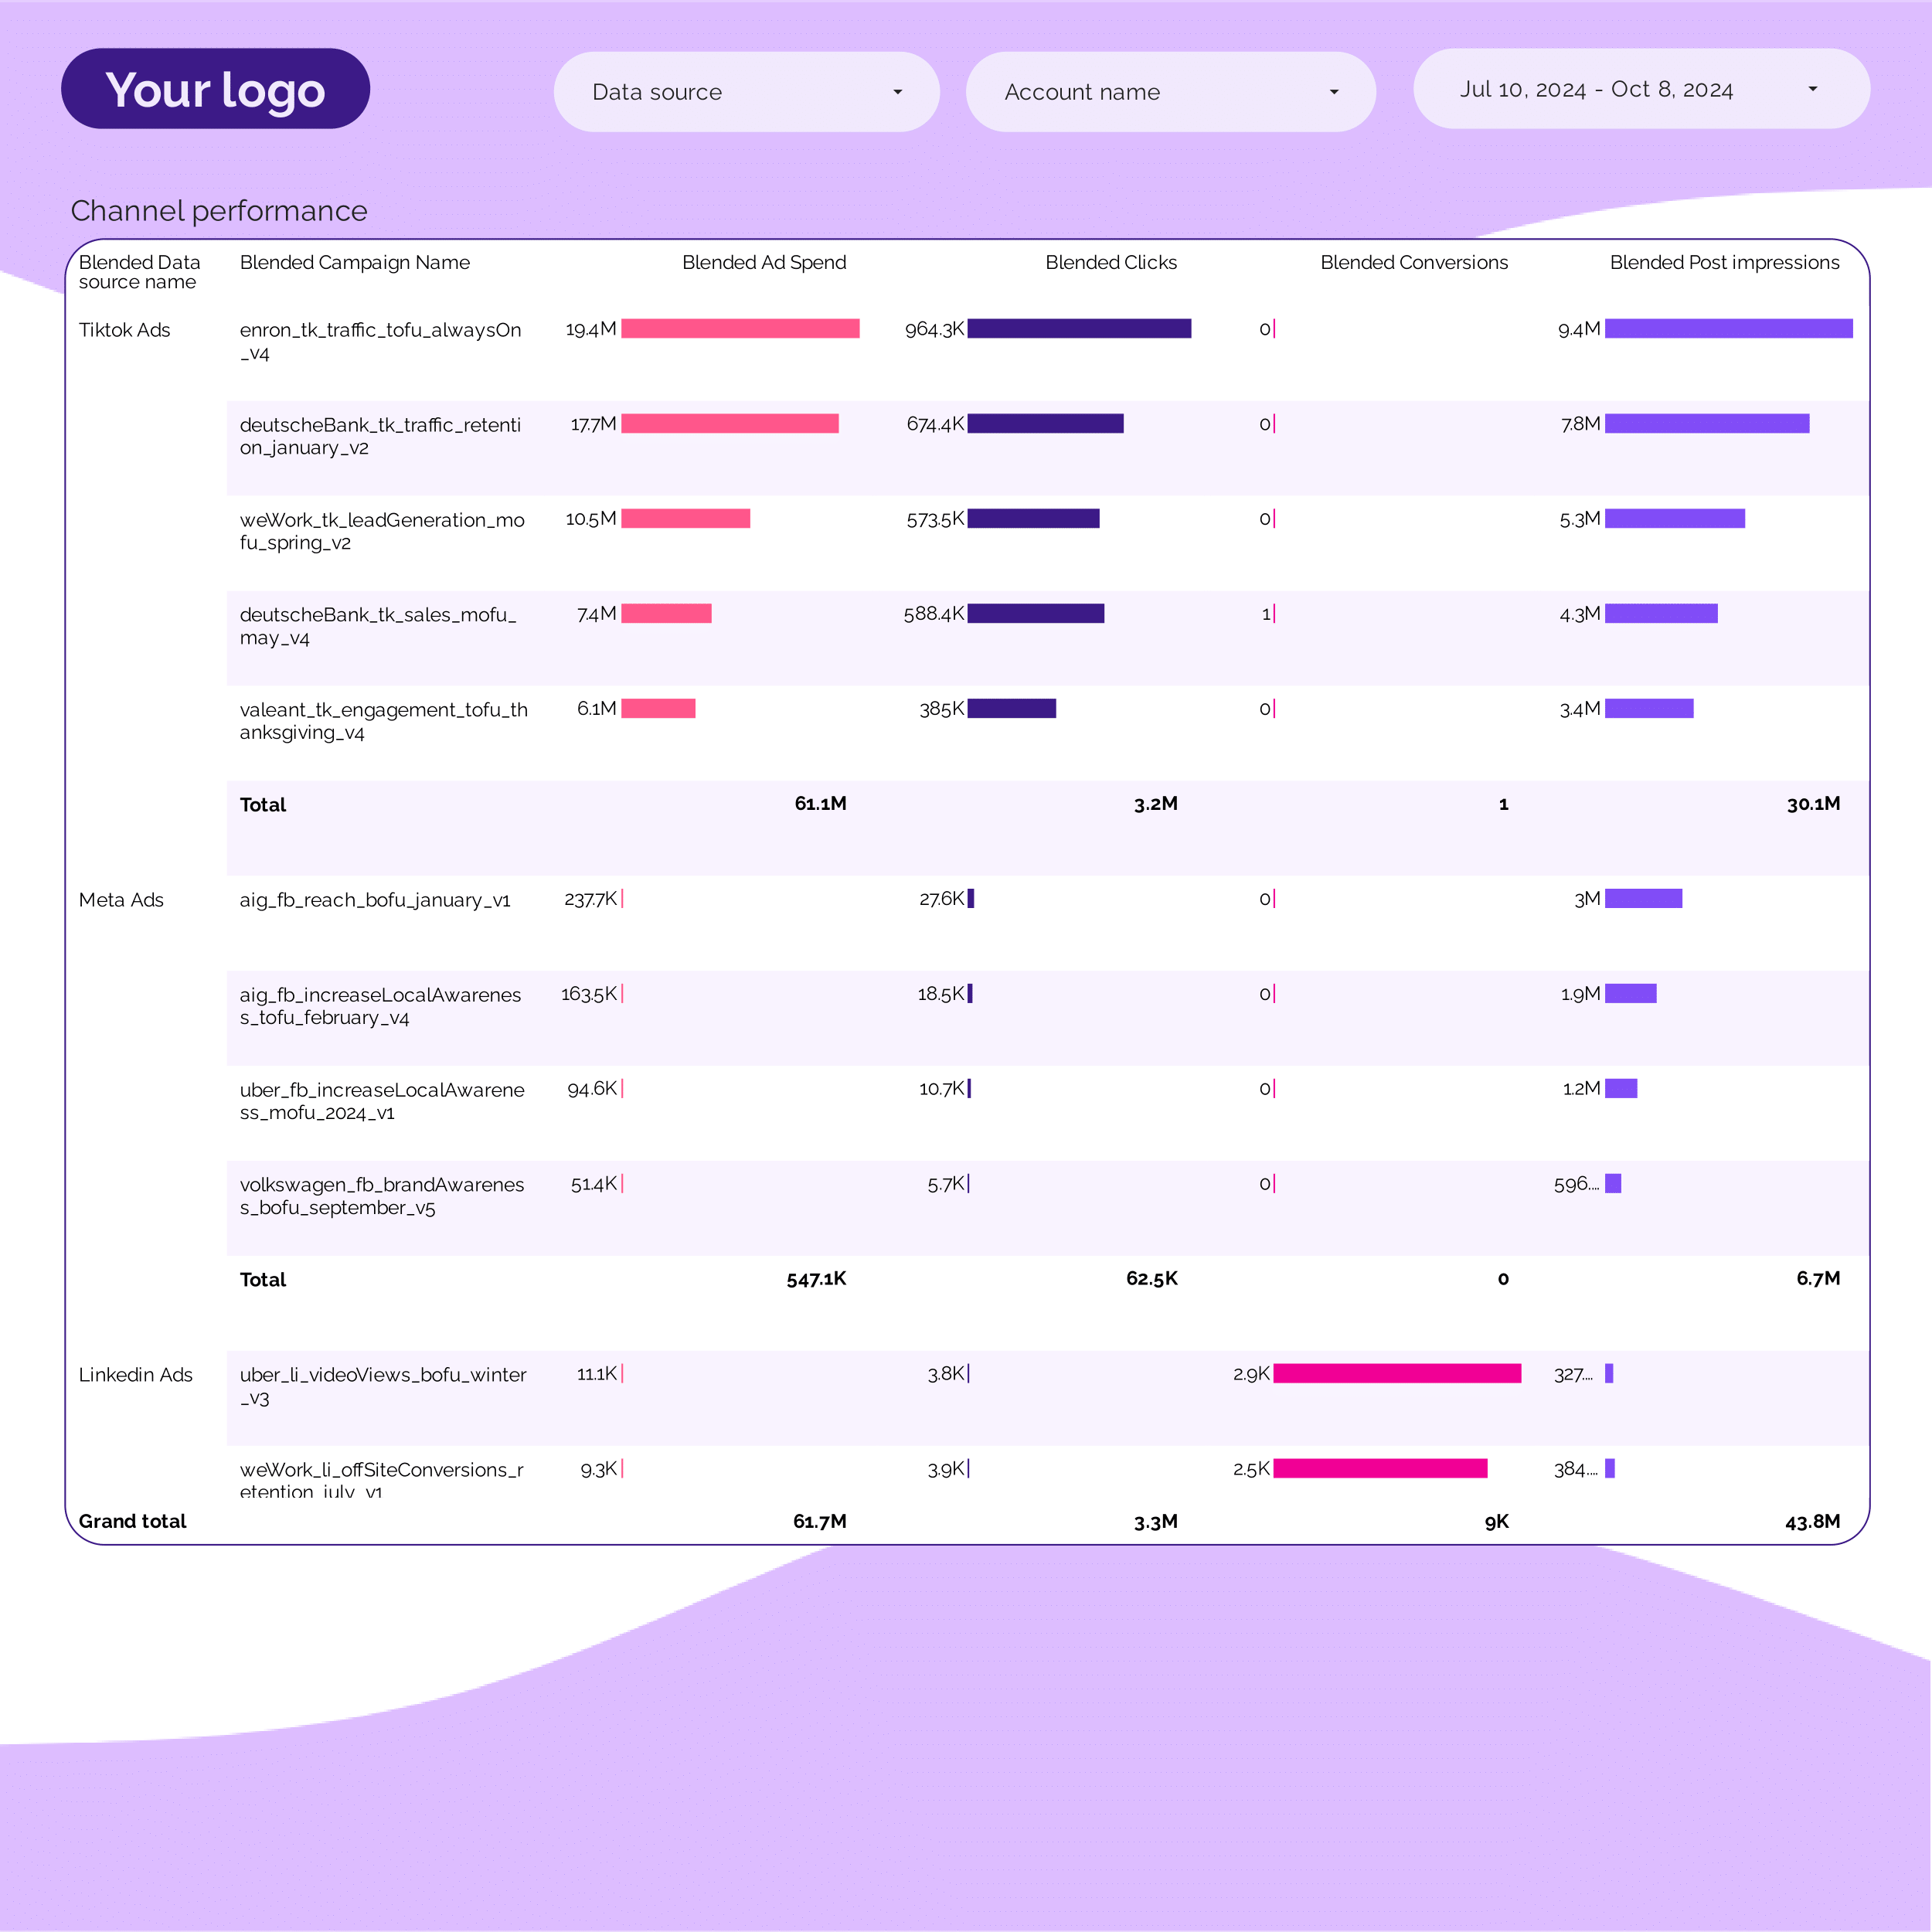
A PPC Campaign performance dashboard is a tool used to track and analyze the effectiveness of pay-per-click advertising campaigns across various platforms such as Google Ads, Facebook Ads, LinkedIn Ads, TikTok Ads, and Twitter Ads. It typically includes metrics like impressions, clicks, ad spend, CTR (click-through rate), CPC (cost per click), conversions, bounce rate, sessions, users, page views, reach, engagement rate, and video views. This dashboard helps marketers assess campaign performance, optimize strategies, and make data-driven decisions.
Can I download this template in PDF?


 Impressions
 Ad Spend
 Conversions
 Platform