


To connect HubSpot to Google BigQuery:
-
1
Log in with Google on portermetrics.com.
-
2
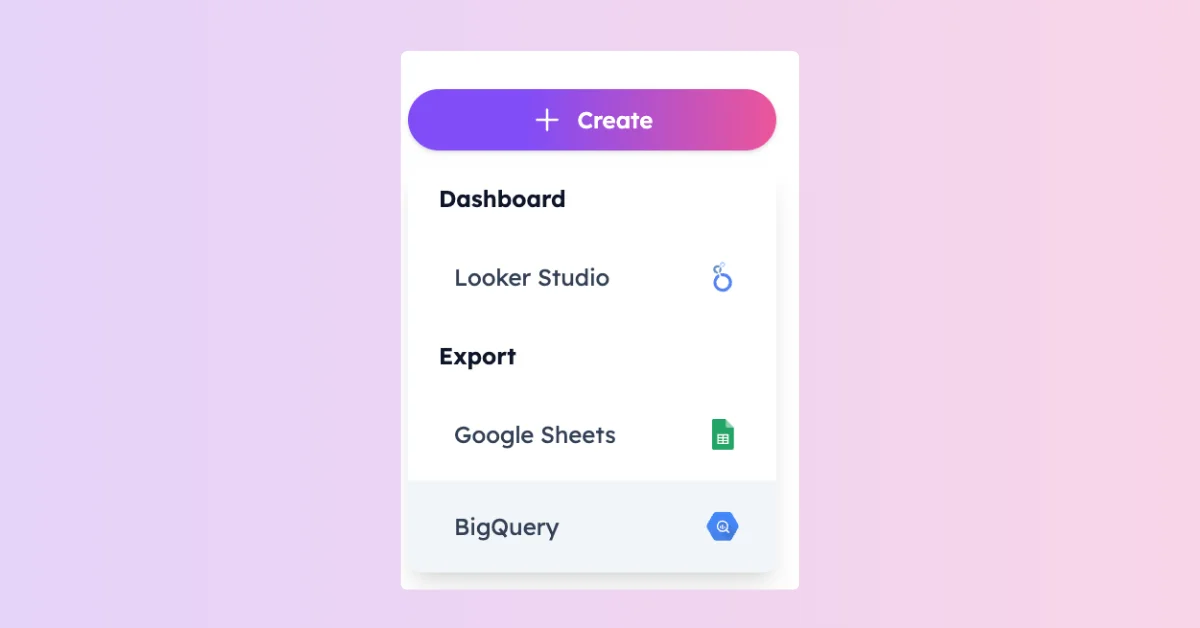
Select Google BigQuery as destination.
-
3
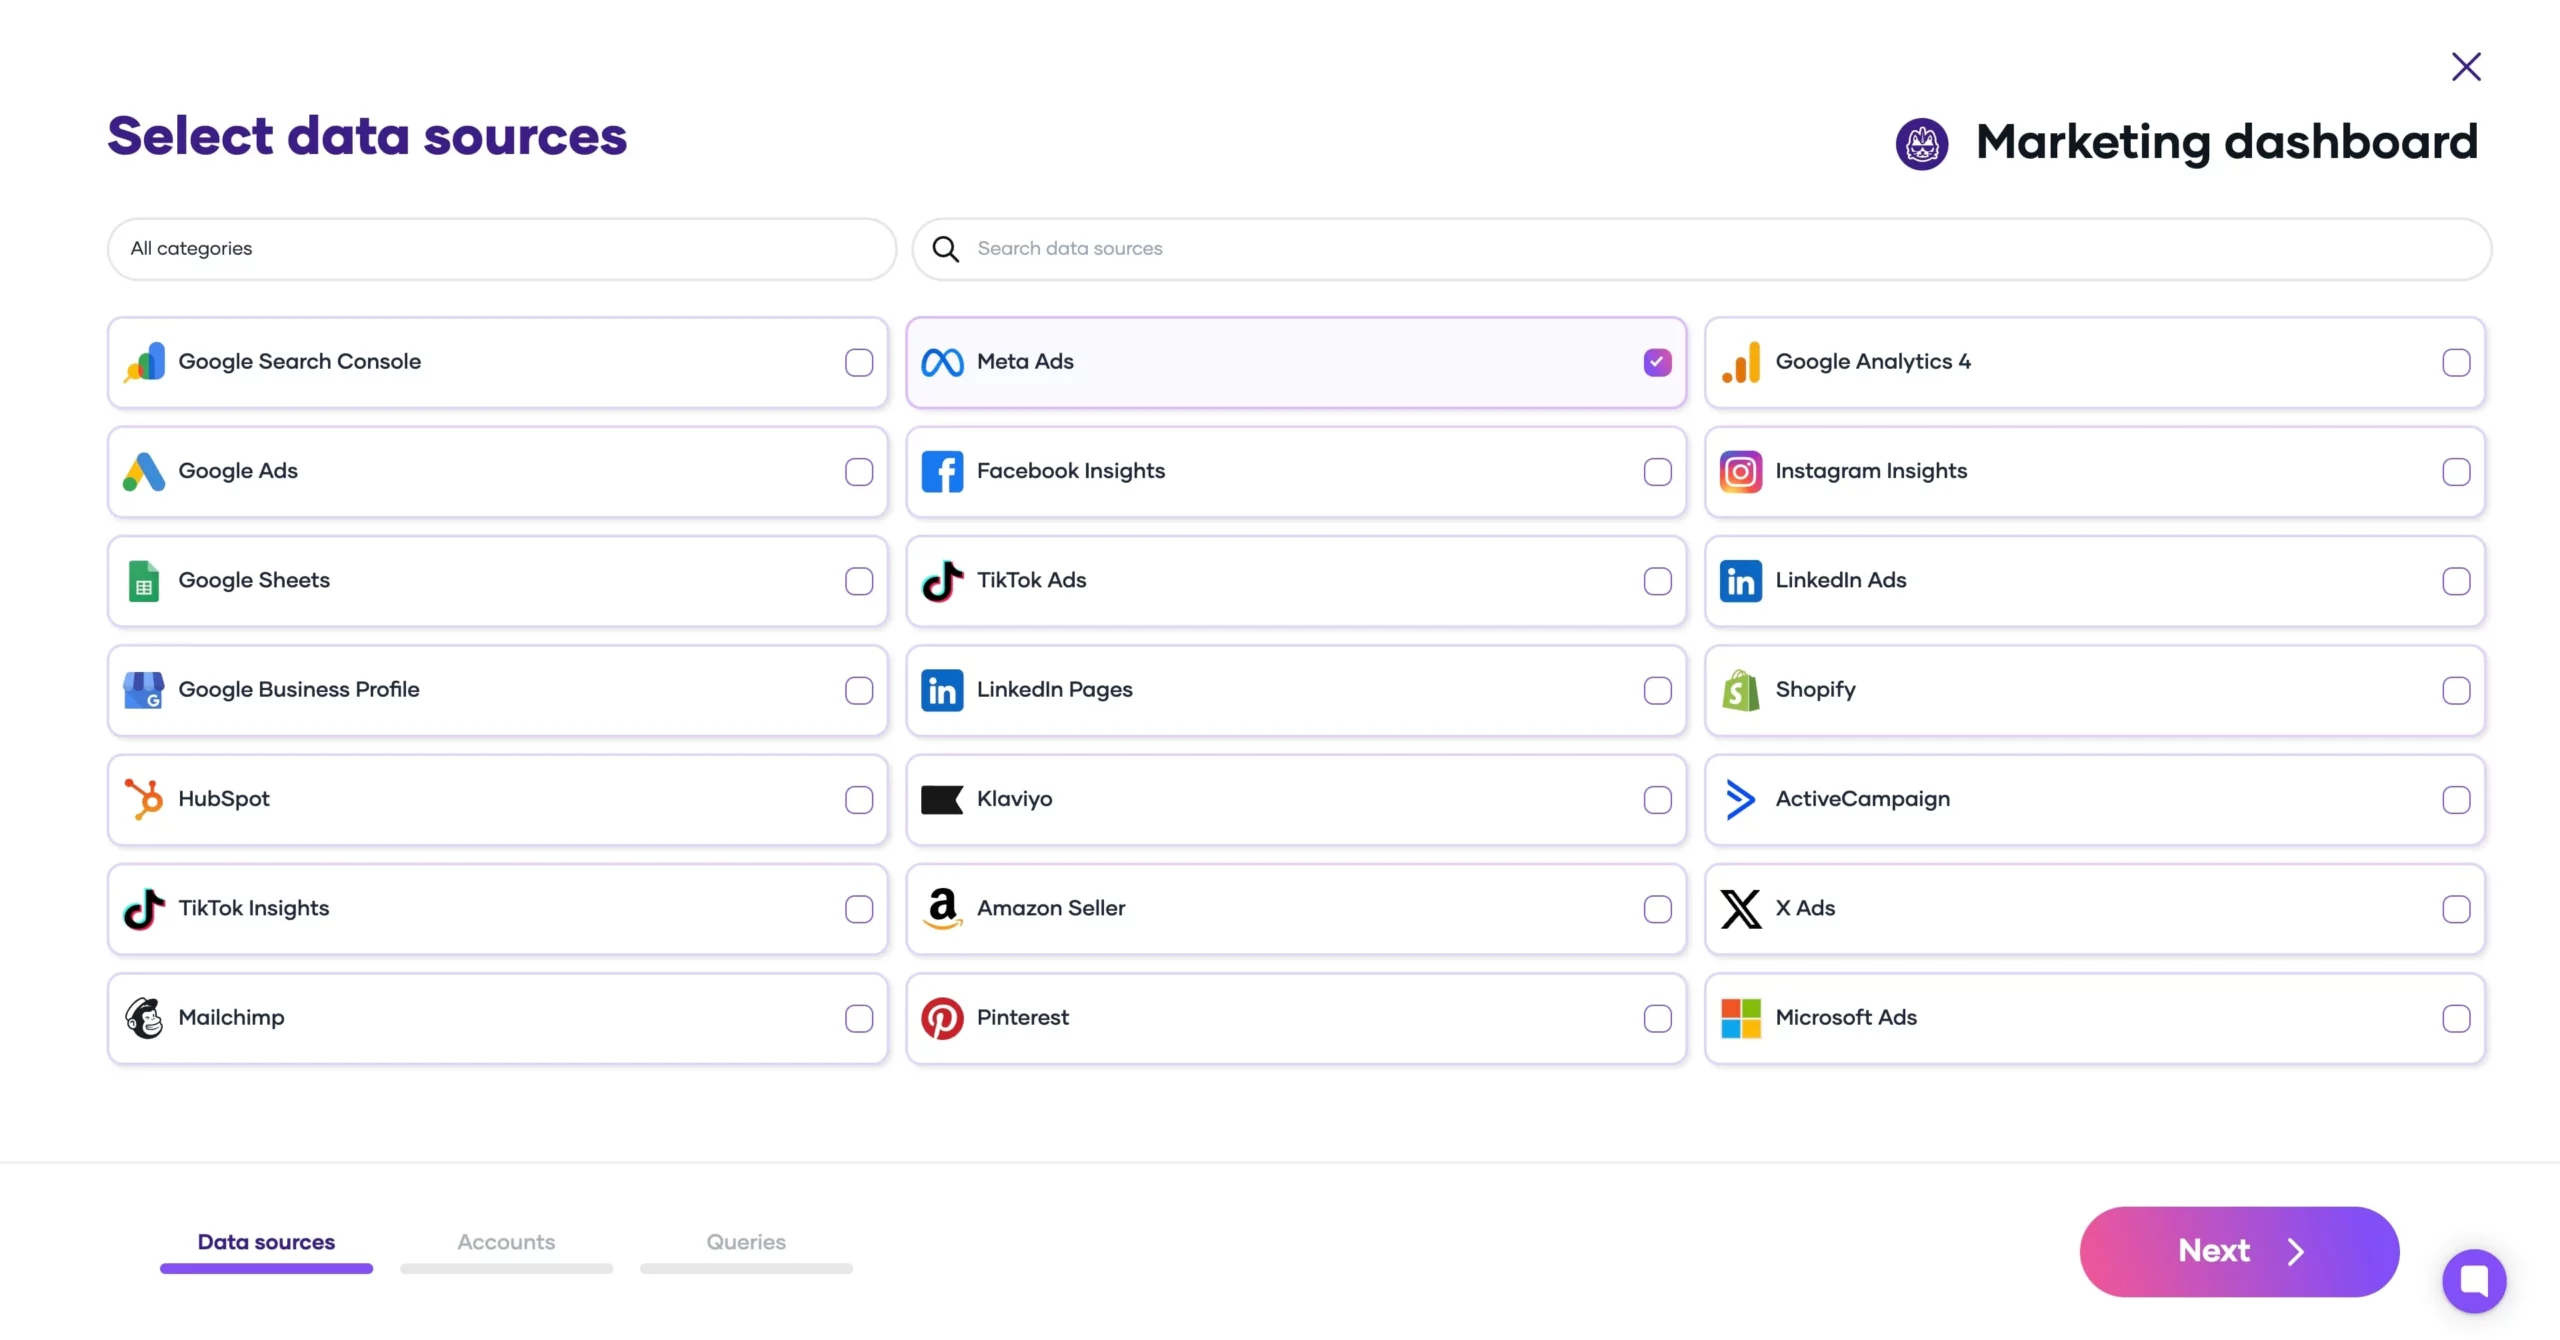
Select HubSpot as data source and name your connection.
-
4
Authorize your HubSpot account via OAuth or Private App.
-
5
Authenticate BigQuery via Google login or Service Account.
-
6
Select Project ID, Dataset location, Dataset, and Table name (or create new).
-
7
Select metrics (e.g., Analytics sessions) and dimensions (e.g., Account name).
-
8
Optionally, prompt custom fields (e.g., Cost per MQL, CAC).
-
9
Set date range (e.g., this month to date).
-
10
Schedule refreshes in natural language (e.g., “daily at 8am”).
-
11
Set write mode (overwrite, append, or update).
-
12
Send and monitor execution logs.
Four free and paid ways to connect HubSpot to Google BigQuery
1. No-code marketing ETL powered by AI (Porter Metrics)
AI-native connector for marketers. Build queries with all fields—contact, company, deal, ticket metrics—already joined. Create custom fields, calculated metrics, and dimension segmentations in natural language. Data arrives in BigQuery marketing-ready: connect directly to Looker Studio without transformation.
2. General ETL/ELT tools
Data integration platforms for data engineers. Examples: Fivetran, Stitch, Airbyte.
Export raw tables that mirror the source schema: one table for contacts, one for companies, one for deals, one for tickets. Each table contains all fields. The data engineer writes SQL JOINs to relate tables, selects fields, transforms data, and uses dbt or Python for preprocessing before visualization.
3. Google BigQuery Data Transfer Service
Free native Google integration for data engineers.
Setup requirements:
- Create a Private App in HubSpot settings.
- Select required scopes: crm.objects.contacts.read, crm.objects.deals.read, etc.
- Copy the access token for API authentication.
- Rate limits: 100 requests/10 seconds (Private App).
- Build custom ETL pipeline to BigQuery (no native integration).
What you get:
- CRM objects: contacts, companies, deals, tickets.
- Engagement data: emails, calls, meetings.
- Manual data pipeline maintenance required.
Limitations:
- No native BigQuery integration: requires custom ETL pipeline.
- API limits vary by plan: Free/Starter more restricted.
- Pagination required: max 100 records per request.
- Property limits: max properties returned per object varies.
4. Manual CSV export or Google Sheets
Export from HubSpot Reports manually. No automation.
How it works:
- In HubSpot: go to CRM → Contacts or Deals, apply filters, click Export → CSV. The file is sent to your email.
- Upload CSV to BigQuery manually or via Cloud Storage.
- Alternative: use Porter to send HubSpot data to Google Sheets, then connect Sheets to BigQuery.
Limitations:
- No automation: repeat manually for each update.
- Export limit: 1,000,000 rows per file. Larger exports are split and delivered as a ZIP.
- No scheduled refreshes.
- Manual upload to BigQuery required.
How to Connect HubSpot to Google BigQuery for Marketers (No Code)
Porter is an AI-native connector. Configure everything with natural language, not SQL or forms. Custom fields, filters, scheduling—all prompted in plain English. No coding, no data engineering required.
- Data preview is always live. As you select metrics, dimensions, filters, and date ranges, Porter shows your data in real-time. Verify everything before sending to BigQuery.
- Data arrives transformed, blended, and ready to visualize. No SQL transformations needed after.
In this tutorial, we’ll show you how to send your HubSpot data to Google BigQuery with Porter. We’ll send CRM data including fields like Total Contacts, Deals Won, Deal Revenue, and custom fields like Cost per MQL and CAC.
Set a connection
Log in to portermetrics.com with Google. Click “Create” and select “Google BigQuery” as destination. Name your connection (e.g., “HubSpot Campaign Performance”). Select HubSpot as data source.
- Data blending: optionally, add Meta Ads, LinkedIn Ads and Google Ads in the same connection for cross-channel reports.
Connect your HubSpot accounts
Connect your HubSpot account via OAuth or Private App. Grant access to the CRM objects you need (contacts, deals, companies). Select the HubSpot portals you want to connect.
Full CRM access
Access contacts, companies, deals, and custom objects in one connection.
Required permissions
Marketing Access or Super Admin on the HubSpot account.
Private App support
Connect via OAuth or Private App for granular permission control.
Connect your BigQuery destination
Authenticate with Google login or Service Account. Select Project ID, Dataset location, Dataset, and Table name.
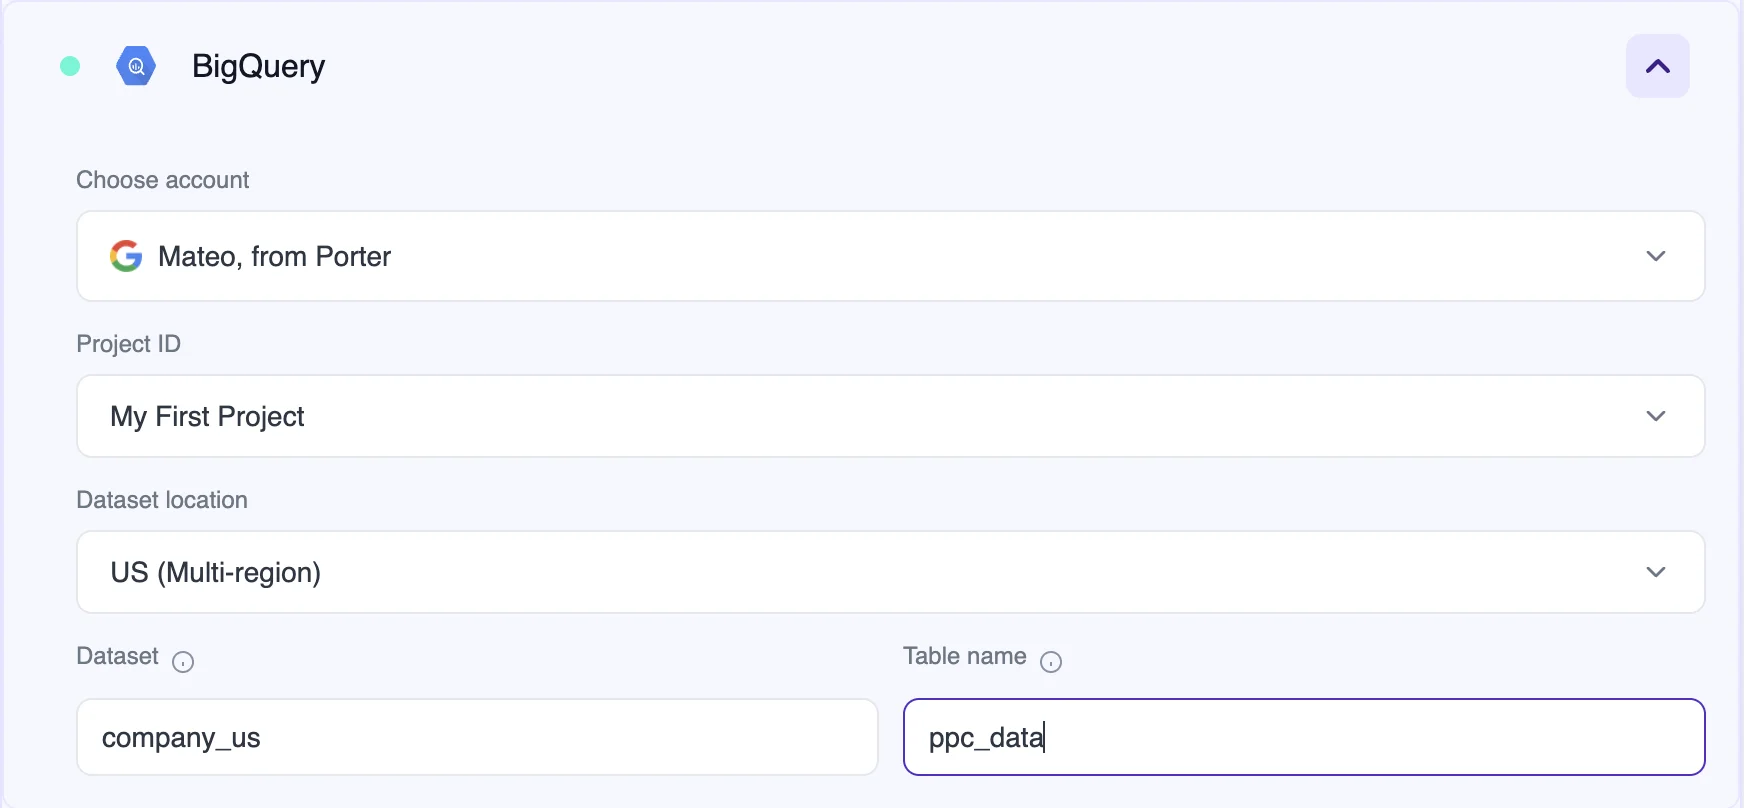
- Google login (recommended): Porter lists your projects in a dropdown. Easiest option.
- Service Account JSON: for companies with strict permissions management on Google Workspace. Copy a JSON text from your project details to connect.
- Dataset location: US, EU, or your preferred region.
- Auto-update schema: if you change your query later, Porter updates the schema automatically and rewrites it in your BigQuery table, unlike other tools.
New to BigQuery? Create your first project:
Go to console.cloud.google.com. In the Navigation Menu (top left), select BigQuery → Studio. On the left panel, you’ll see your projects.
- Create a Project: select or create a new project (e.g., “Marketing Data”). Choose a name, type, and organization. BigQuery creates a folder for it.
- Create a Dataset: expand your project folder, click the ellipsis, and select “Create Dataset.” Name it (e.g., “CRM_data”) and select a location (US or EU).
- Create a Table: inside your dataset, you can create a table (e.g., “hubspot_crm”). Or let Porter create it automatically when you send your first query.
The Project ID, Dataset name, and Table name you set here are the same values you’ll enter in Porter’s BigQuery configuration.
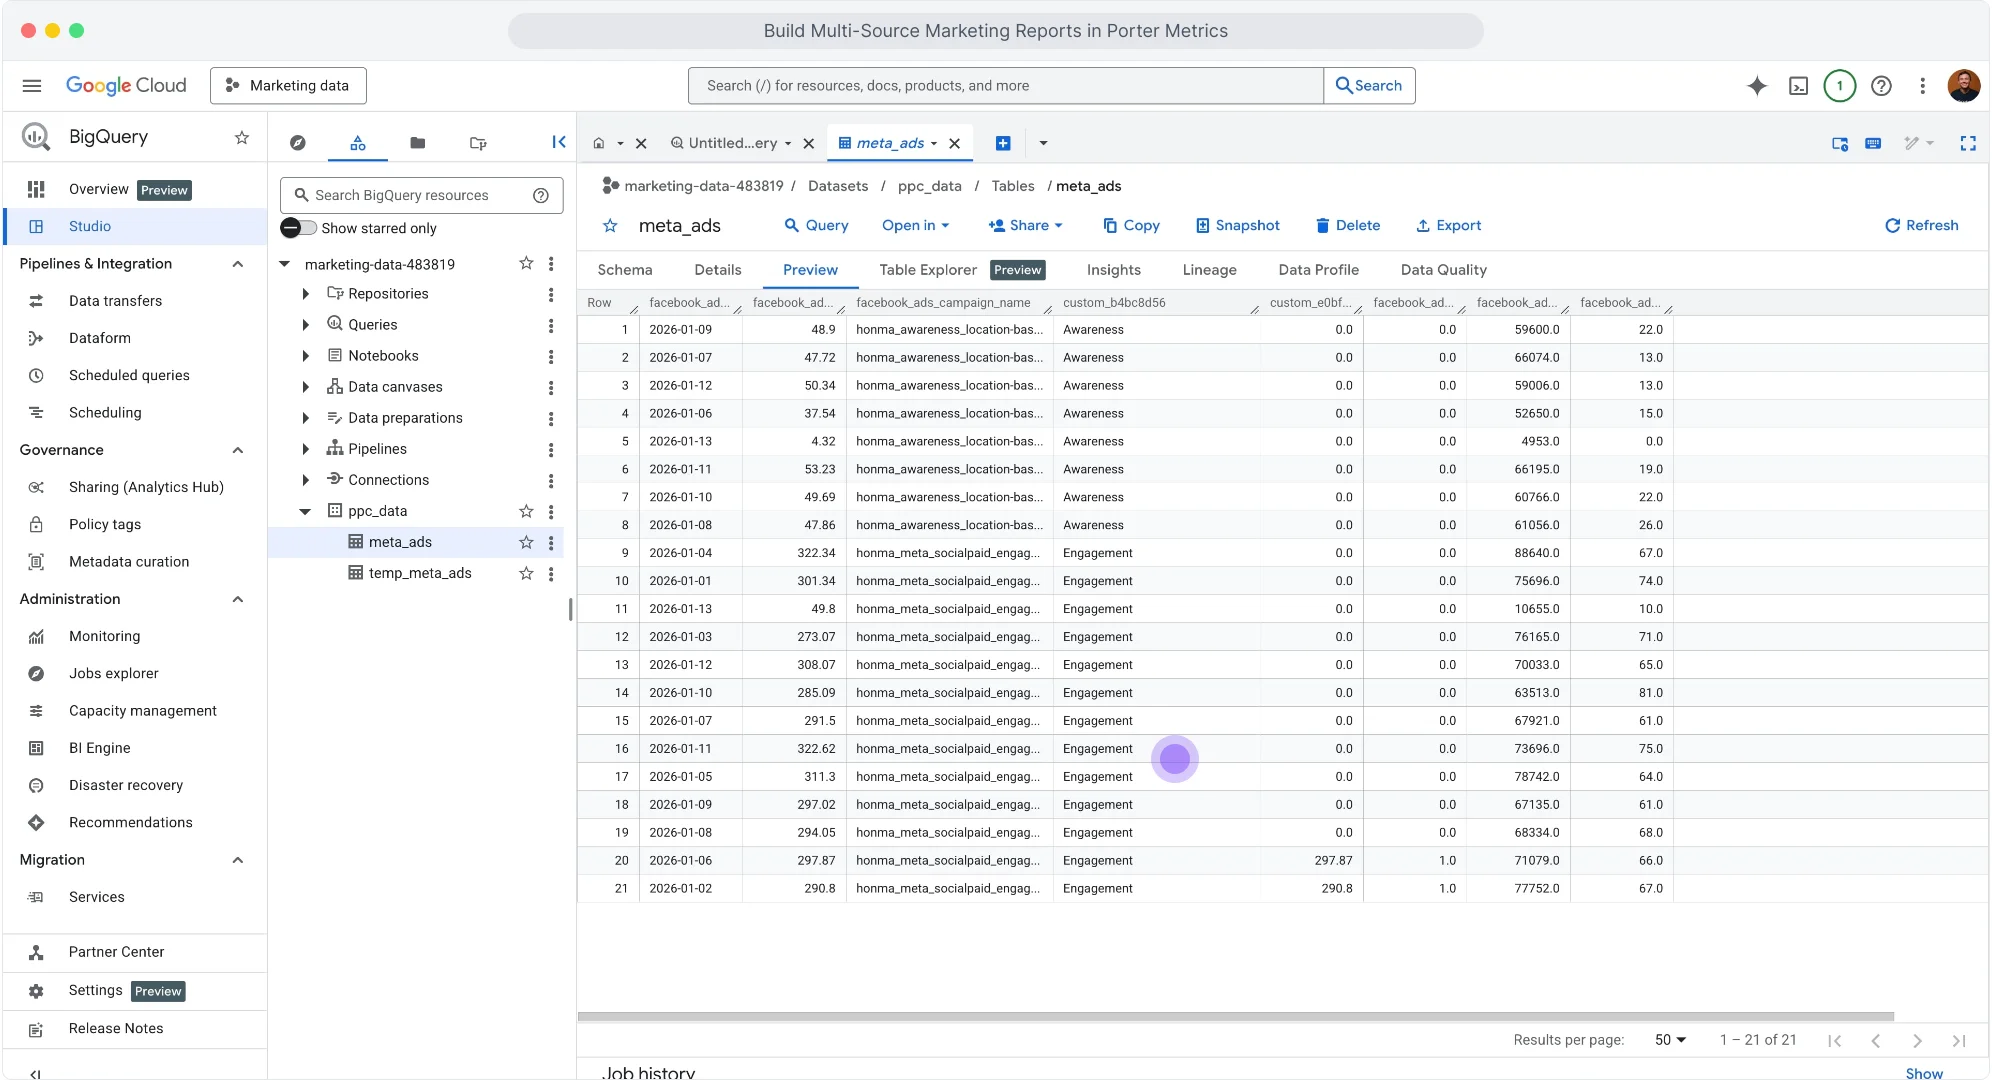
Verify your data in BigQuery:
When you select a table, BigQuery shows the Schema view first. This is the metadata: field names, field types, and modes. To see your exported data, go to the Preview tab. Once your query executes, you’ll see the complete table with your data.
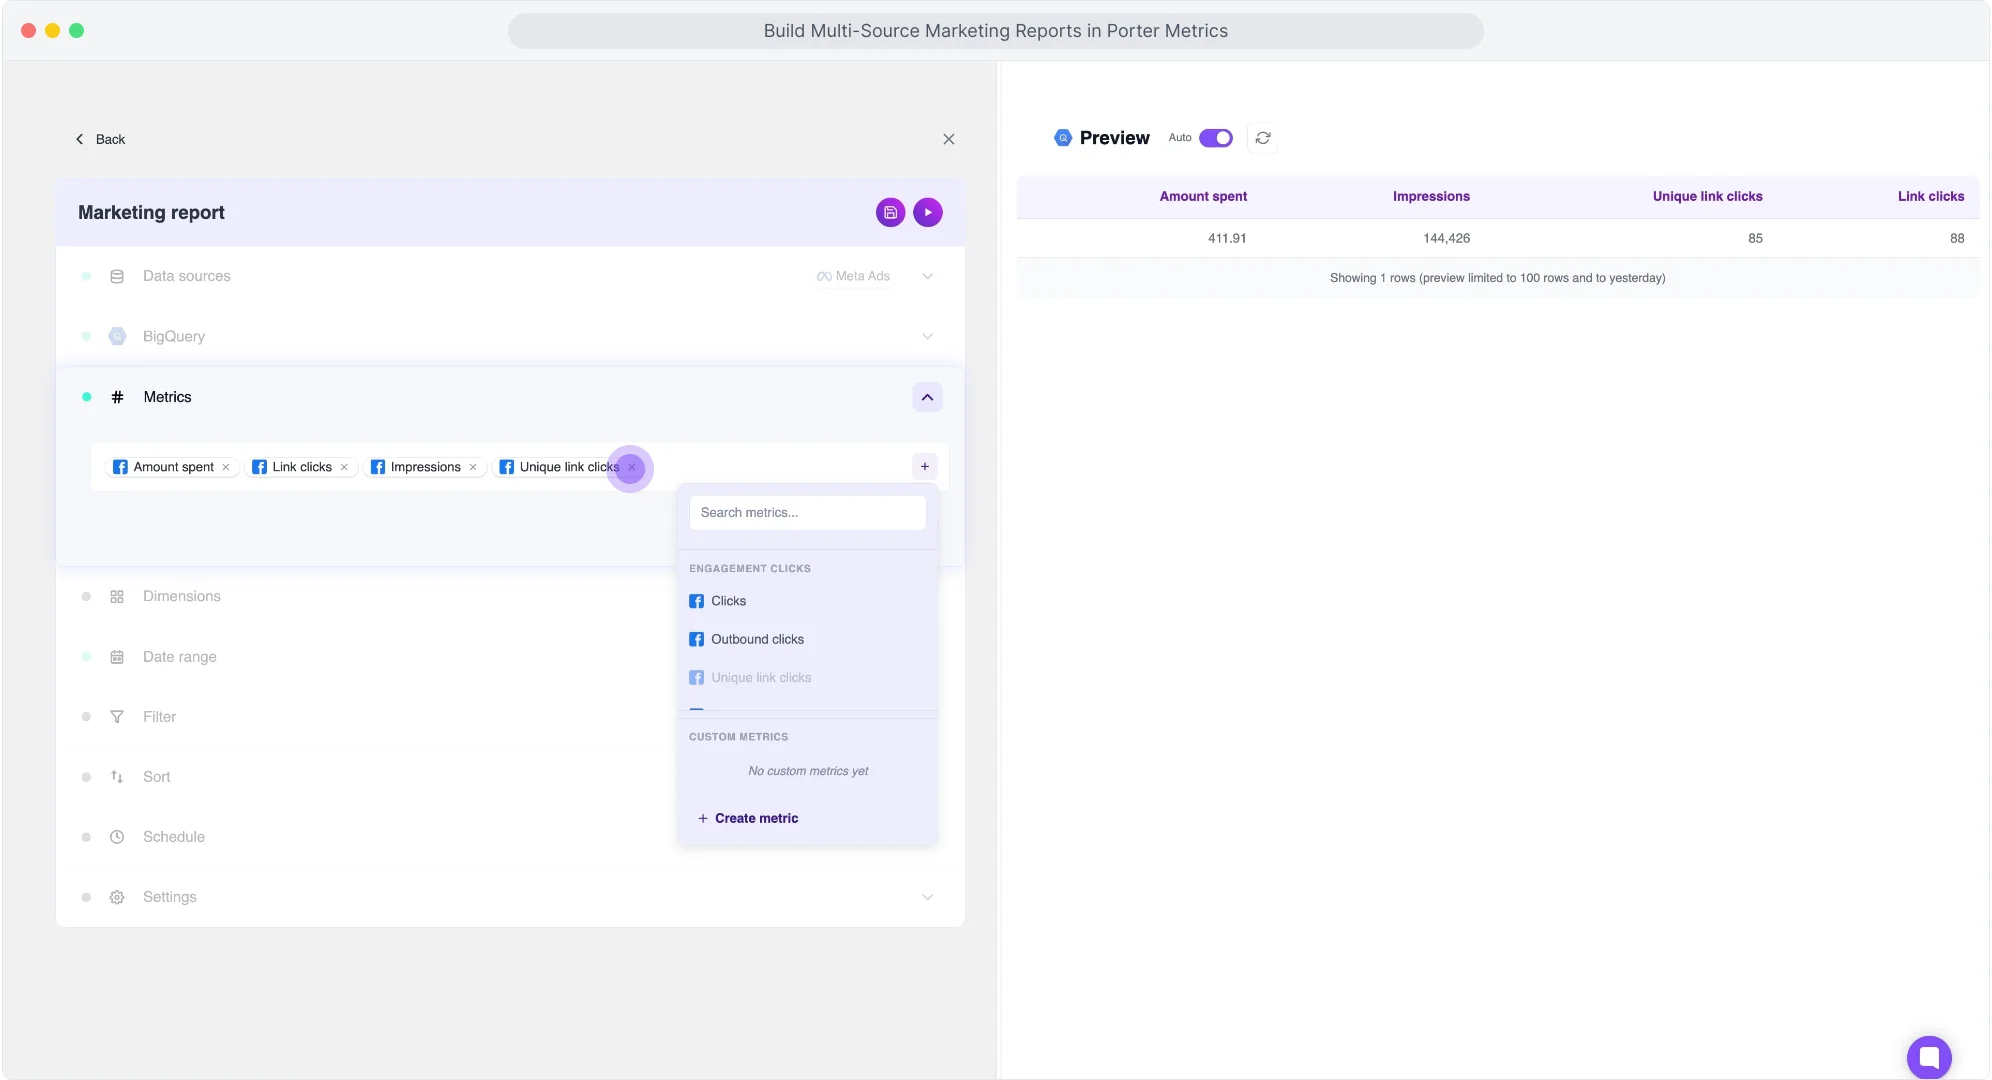
Choose metrics
In the metrics dropdown, search and select: e.g., Account total number of contacts to date, Account total number of deals to date, Analytics conversion rate (%), Analytics bounce rate (%), Analytics CTA clicks.
Choose dimensions
To segment your data, in the dimensions dropdown, search and select: e.g., Account name, Analytics page name, Date.
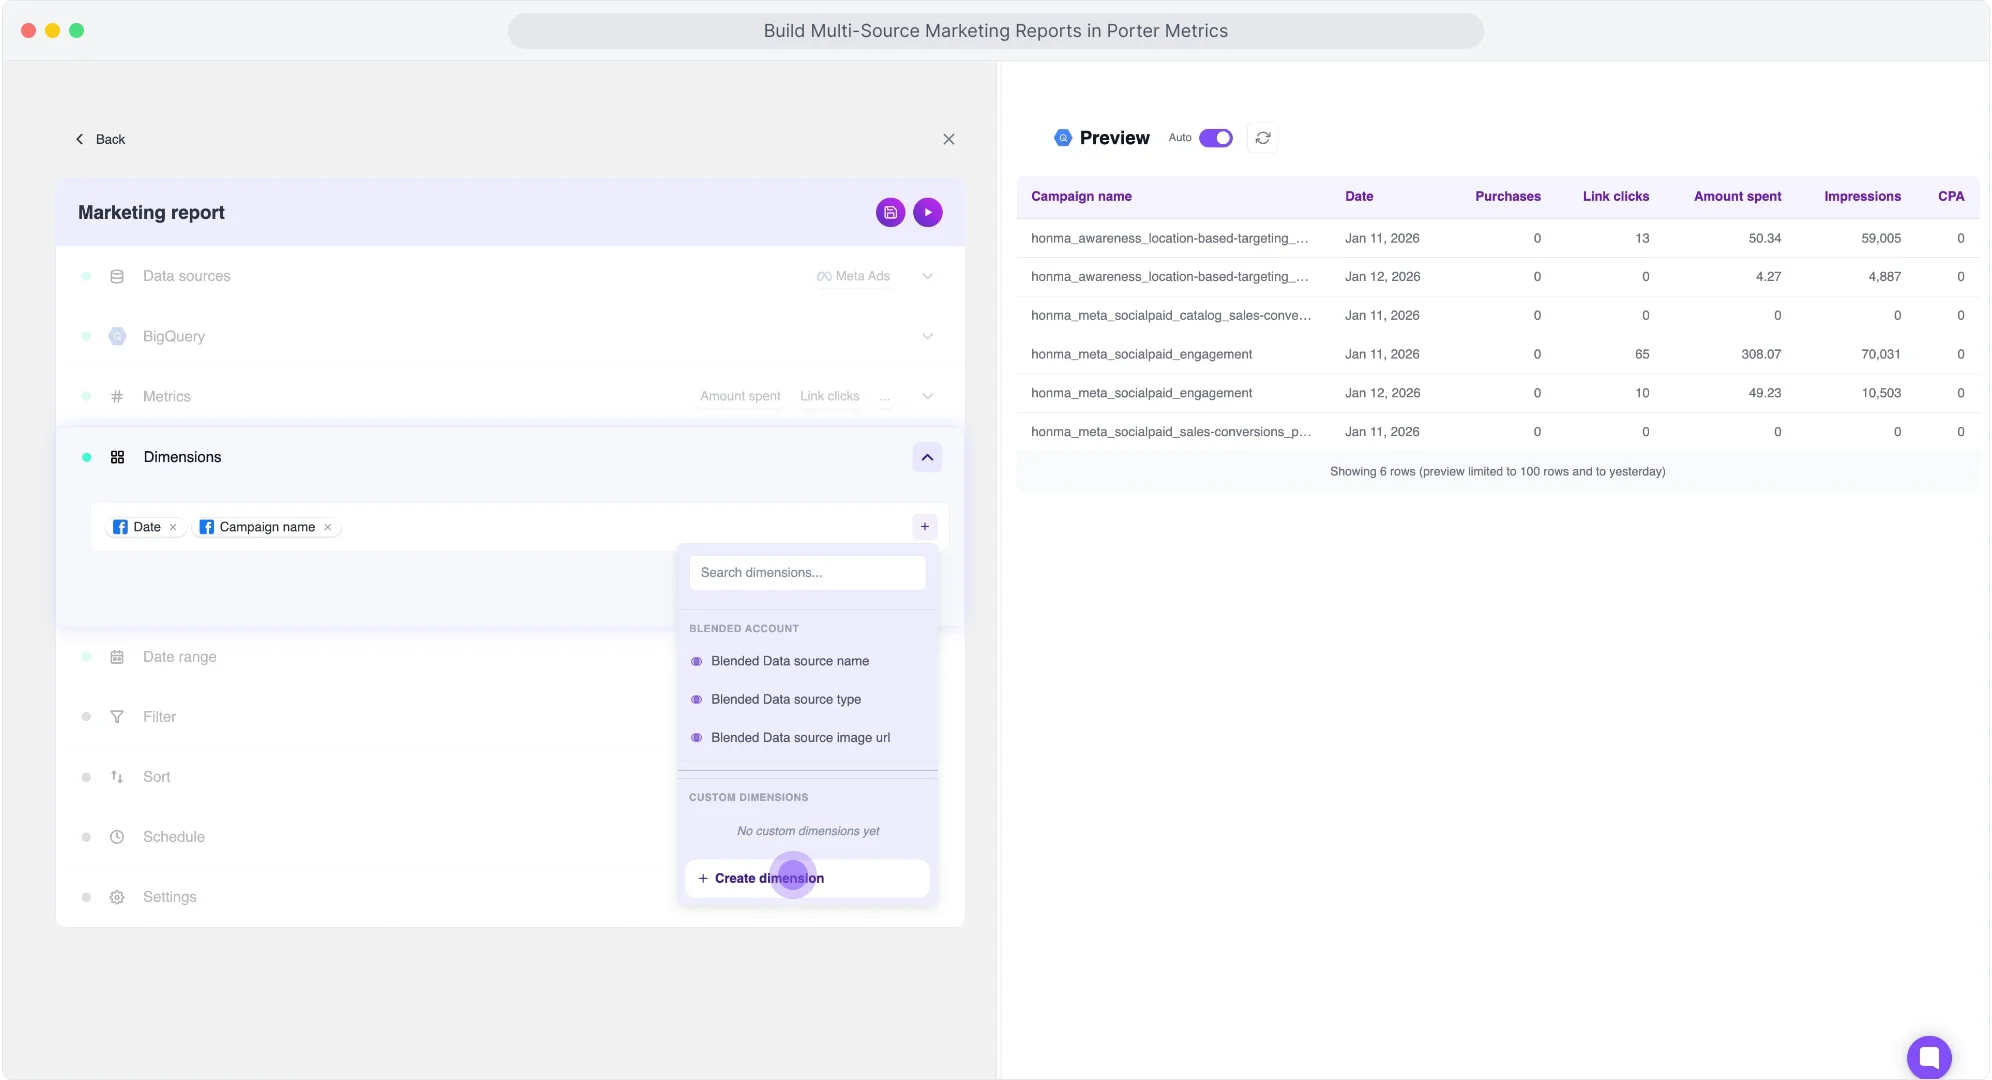
- Other dimensions: Deal stage, Date, Company owner, Company owner assigned date, Company owner email, Company owner first name, Company owner ID.
- CRM Objects: Contacts, Companies, Deals, Tickets, and Custom Objects available.
- Pipeline stages: Deal Stage, Lifecycle Stage, and custom pipeline stages included.
- Custom properties: All custom contact, company, and deal properties are available as dimensions.
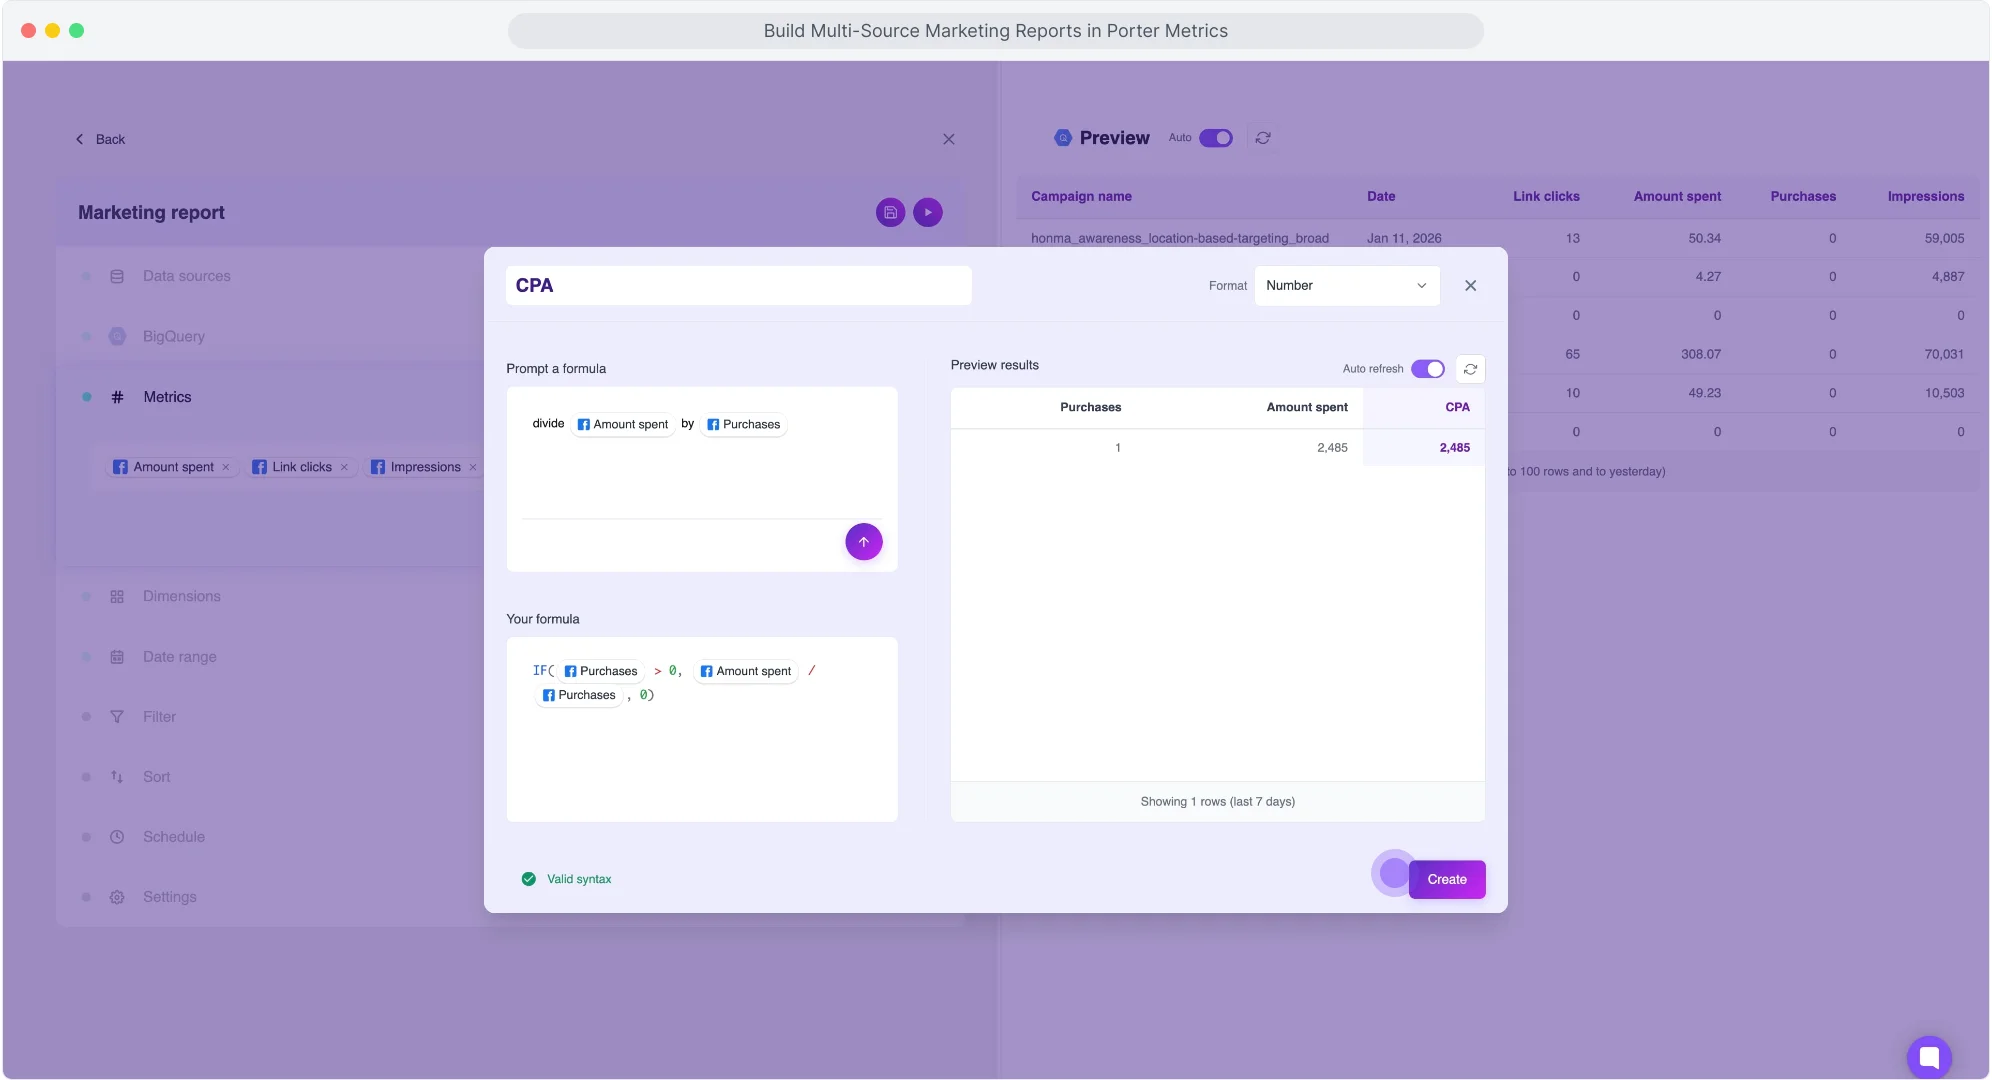
Create custom fields
For custom metrics, add a new metric, prompt your formula in natural language, and check the formula generated and a preview of the query. Choose the format of your metric (number, currency, percentage). For this example: Conversion Rate = “Account total number of deals to date / Account total number of contacts to date”, CTA CTR = “Analytics CTA clicks / Analytics CTA views”.
For custom dimensions, prompt your formula to segment data based on naming conventions. If your naming conventions include objective, funnel stage, or products, prompt a formula like: “If analytics source contains ‘Organic Search’, tag as ‘SEO’. If contains ‘Paid’, tag as ‘Paid’. If contains ‘Social’, tag as ‘Social’. Else ‘Other’.” In the preview, see how Porter transforms conditionals into regex for custom segmentations.
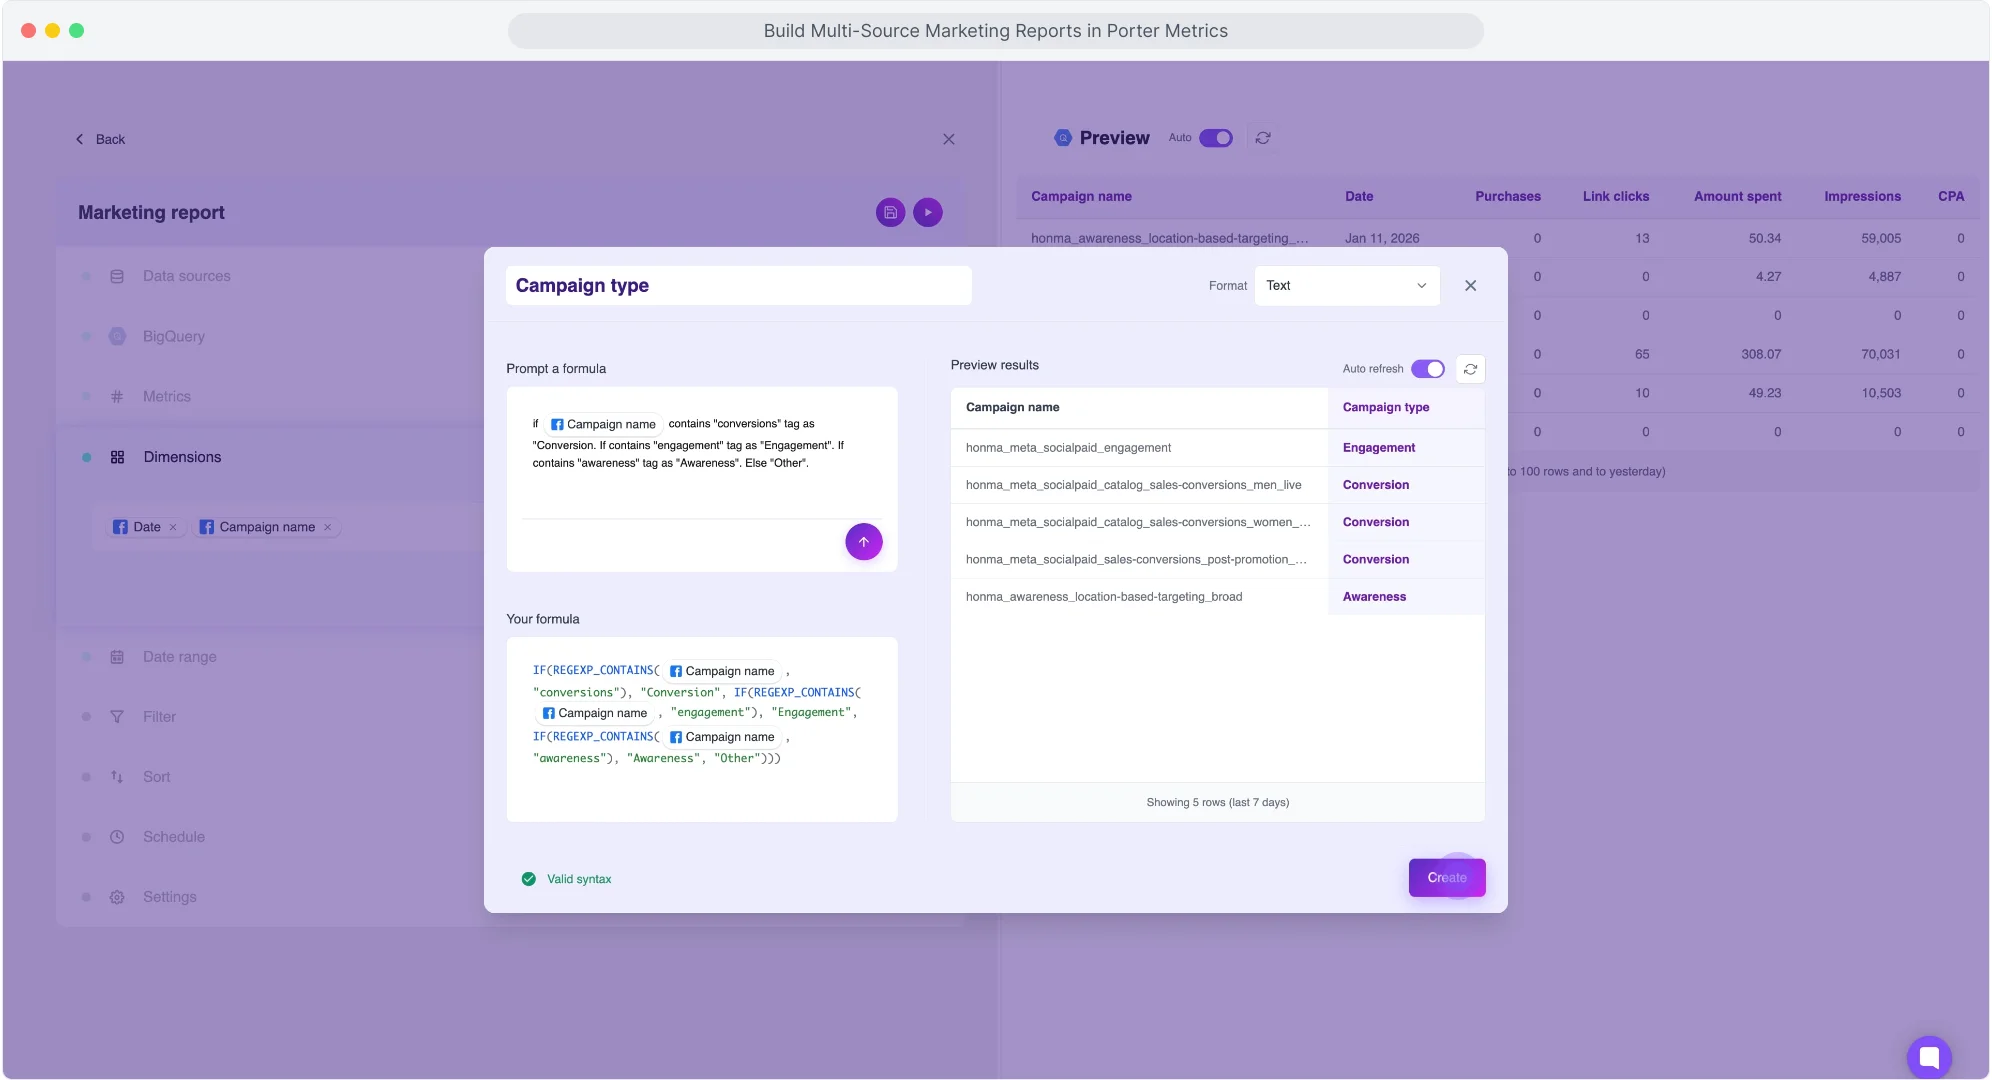
Create your own metrics or dimensions so no SQL or transformation is needed in BigQuery. Your data is ready to be connected to Looker Studio. Supported operations: math (sum, subtract, divide, multiply), conditionals (if/then/else), regex (pattern matching). Same capabilities as Looker Studio calculated fields.
Set date range
Select a date range from the dropdown. For this example: last 30 days.
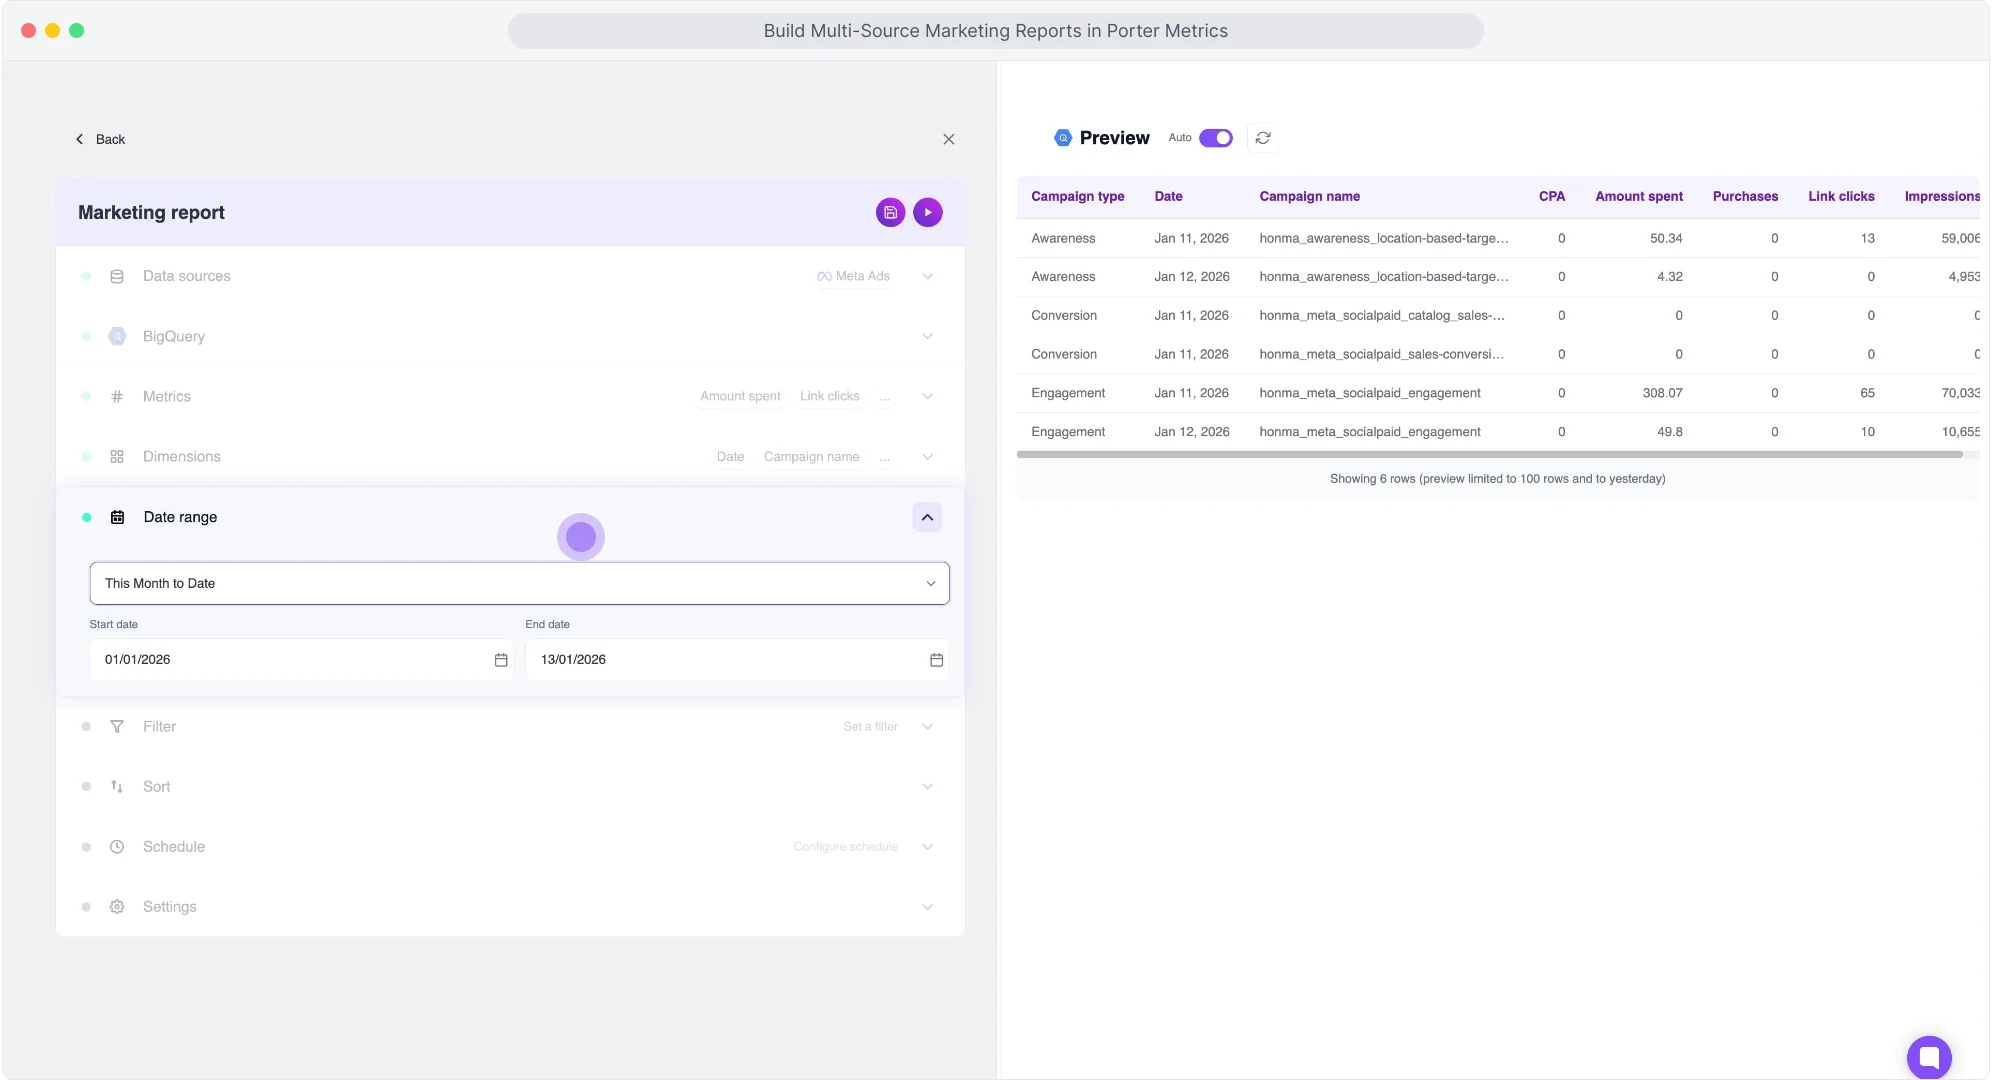
- Dynamic ranges: today, yesterday, last 7/14/28/30/90 days, this week/month/quarter/year to date, last week/month/quarter/year.
- Fixed ranges: specific start and end dates.
- Auto-update: data refreshes automatically based on dynamic range.
Add filters
The HubSpot connector may return records with no activity. We’ll create a filter to exclude them.
For this example:
- Condition: Exclude
- Field: Email Status
- Operator: equals
- Value: 0
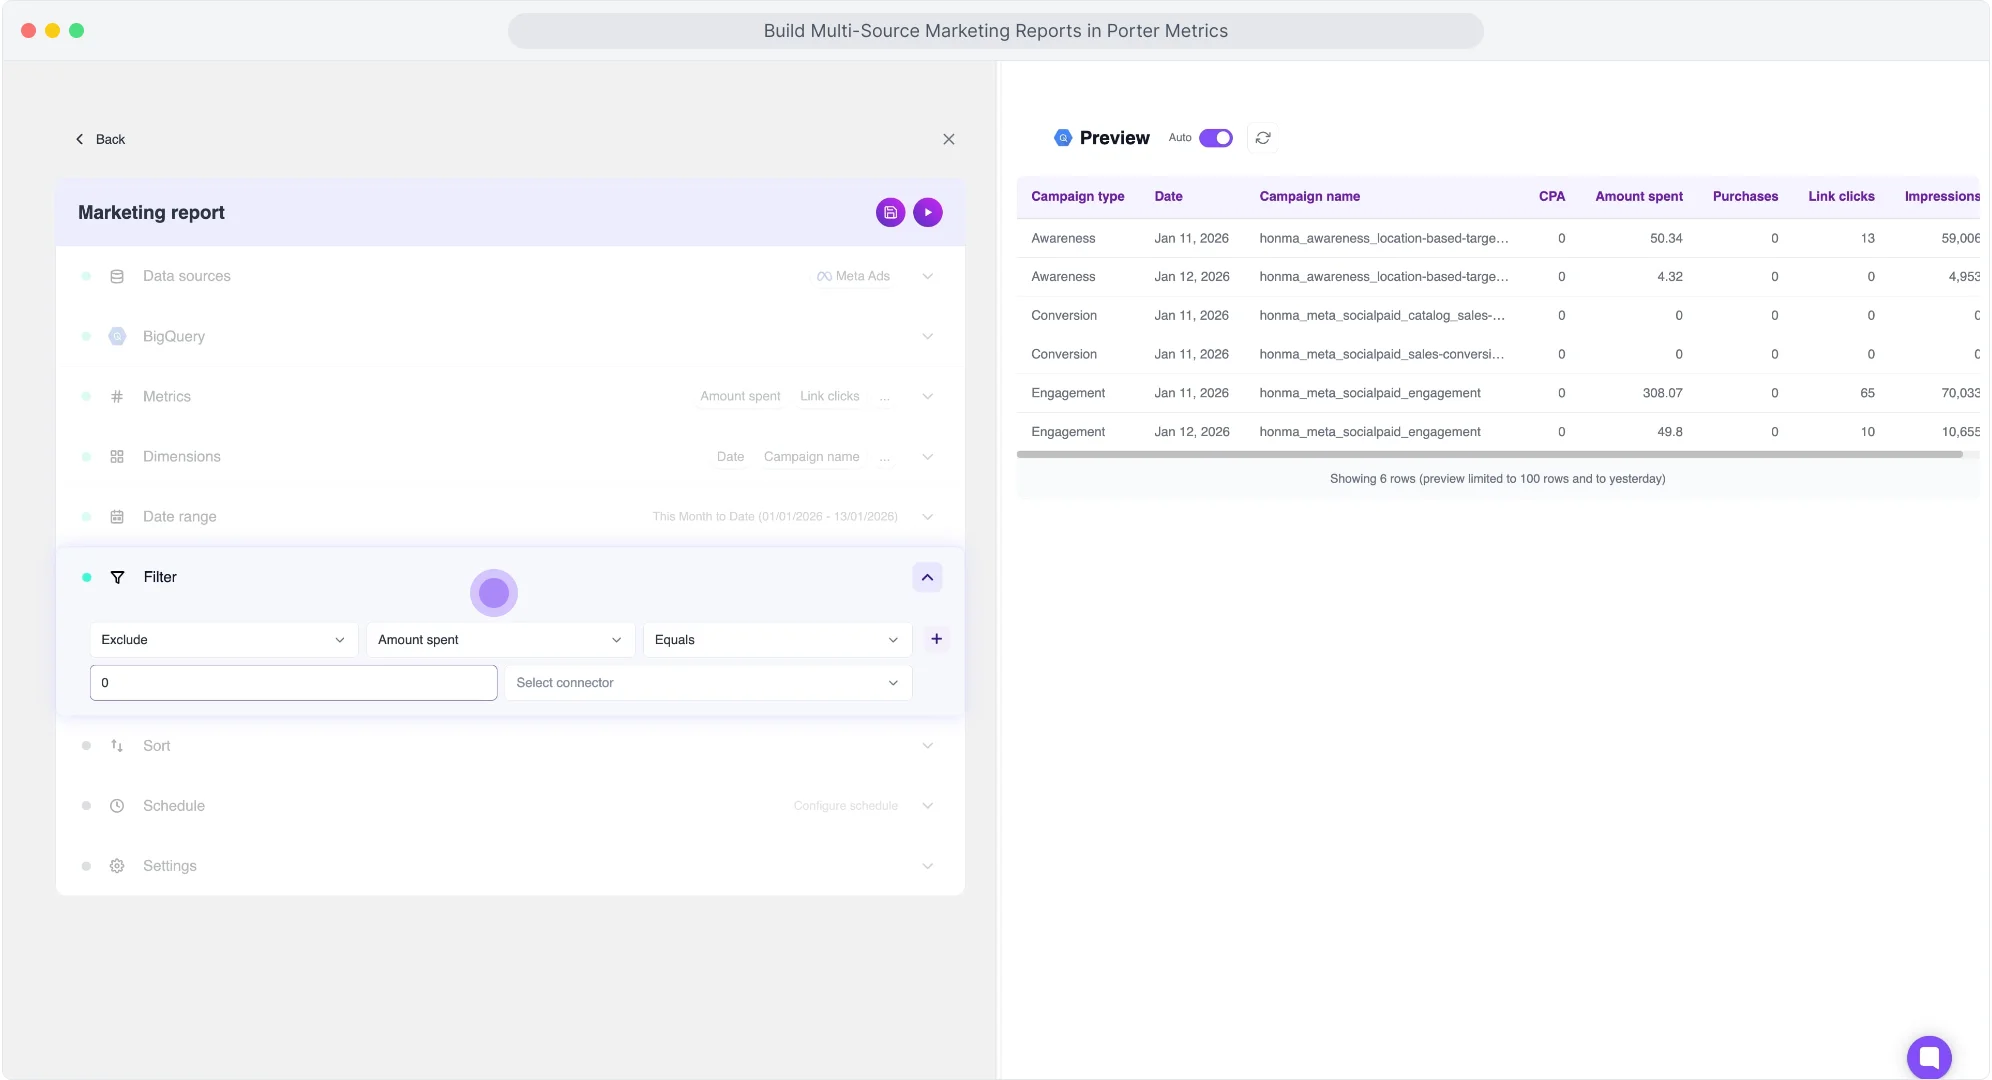
This excludes all campaigns without activity, so your query only returns campaigns with spend.
- Available operators: equals, contains, not contains, greater than, less than, starts with, ends with.
- Value detection: Porter detects if the field is a number or text automatically.
- Combine filters: add AND/OR logic within the same condition or create multiple filters in one query.
Schedule refresh
Prompt your schedule in natural language. For this example: “every day at 8am”.
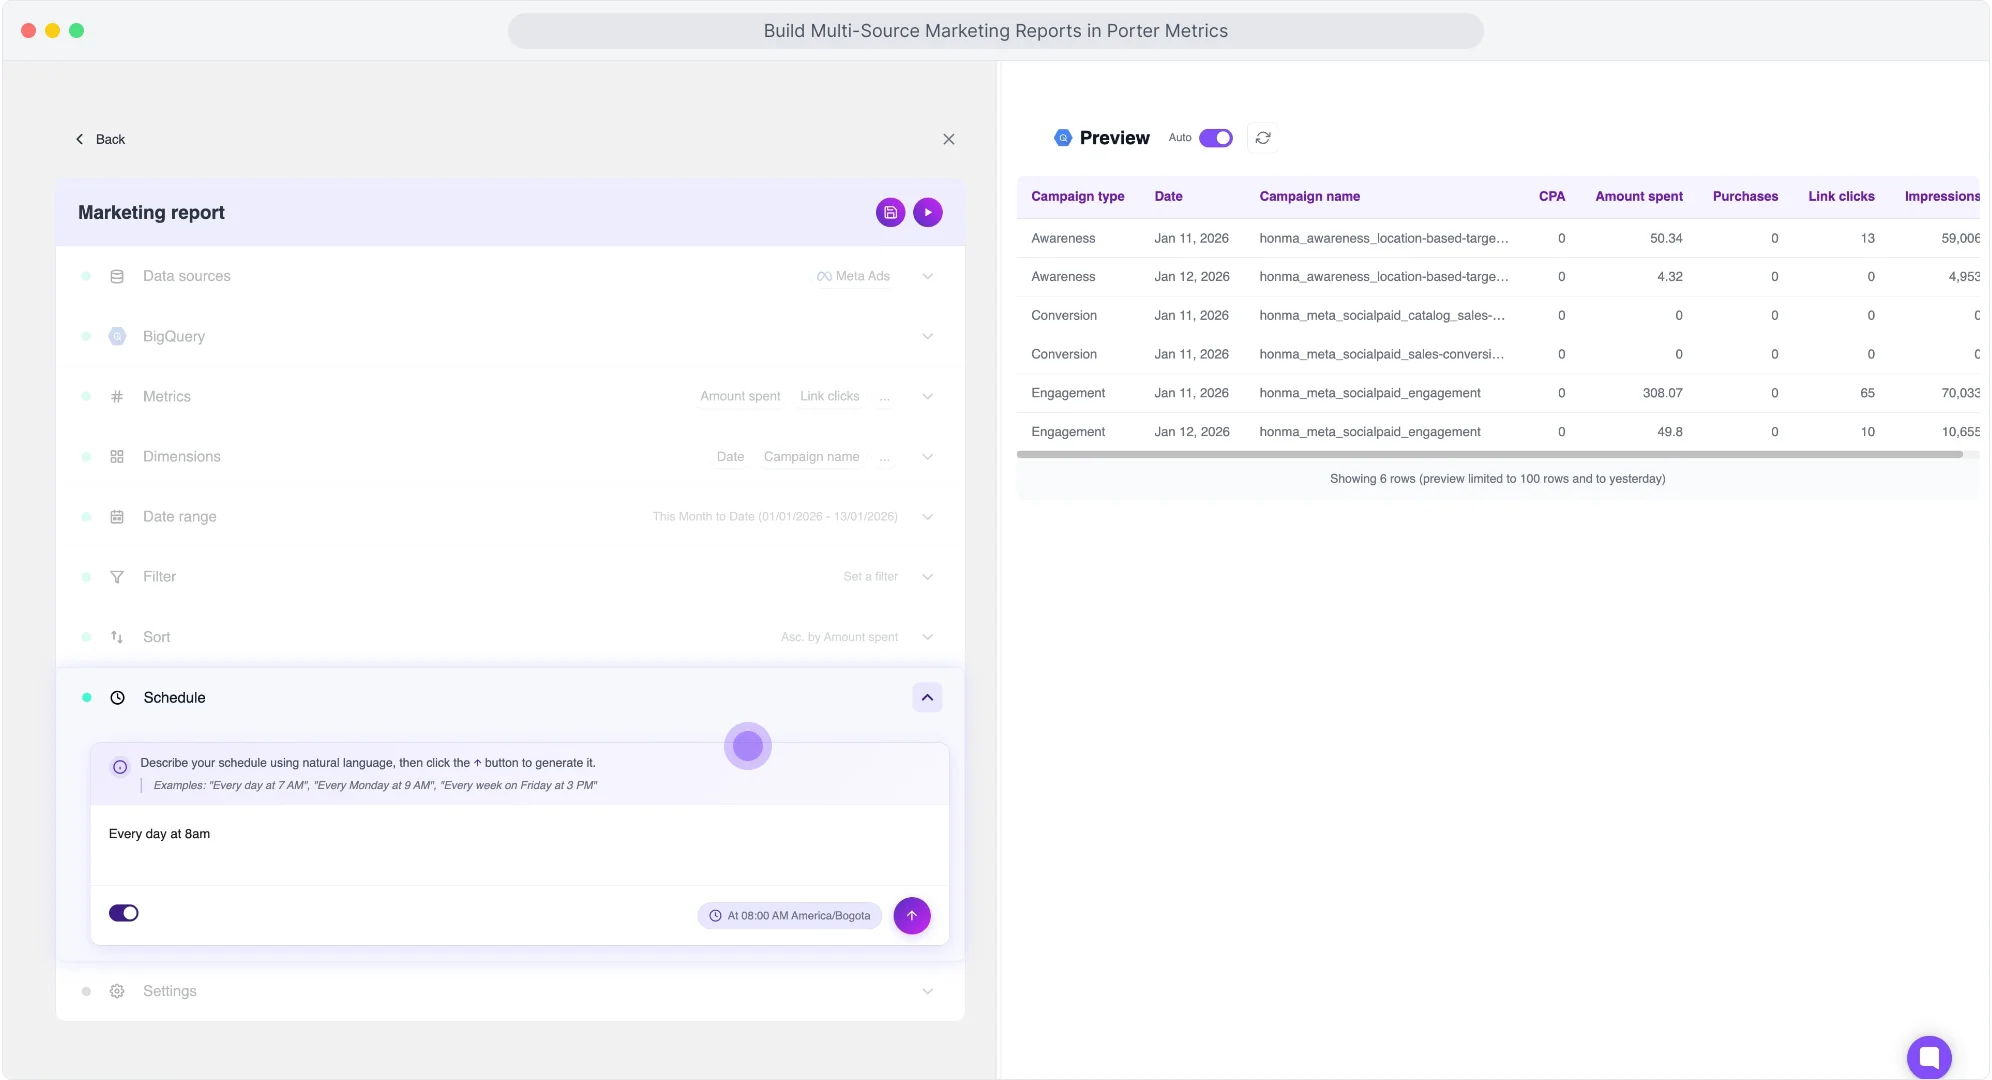
- Examples: “Every Monday at 5am”, “Weekdays at 7pm”, “Every hour”, “Every Tuesday and Friday at 9am”.
- Auto-convert: Porter converts prompts into cron expressions.
- Timezone: detected automatically from your browser.
- Minimum frequency: every minute. No extra cost for frequent refreshes.
Choose write mode
Select how Porter writes data to BigQuery. For this example: Overwrite.
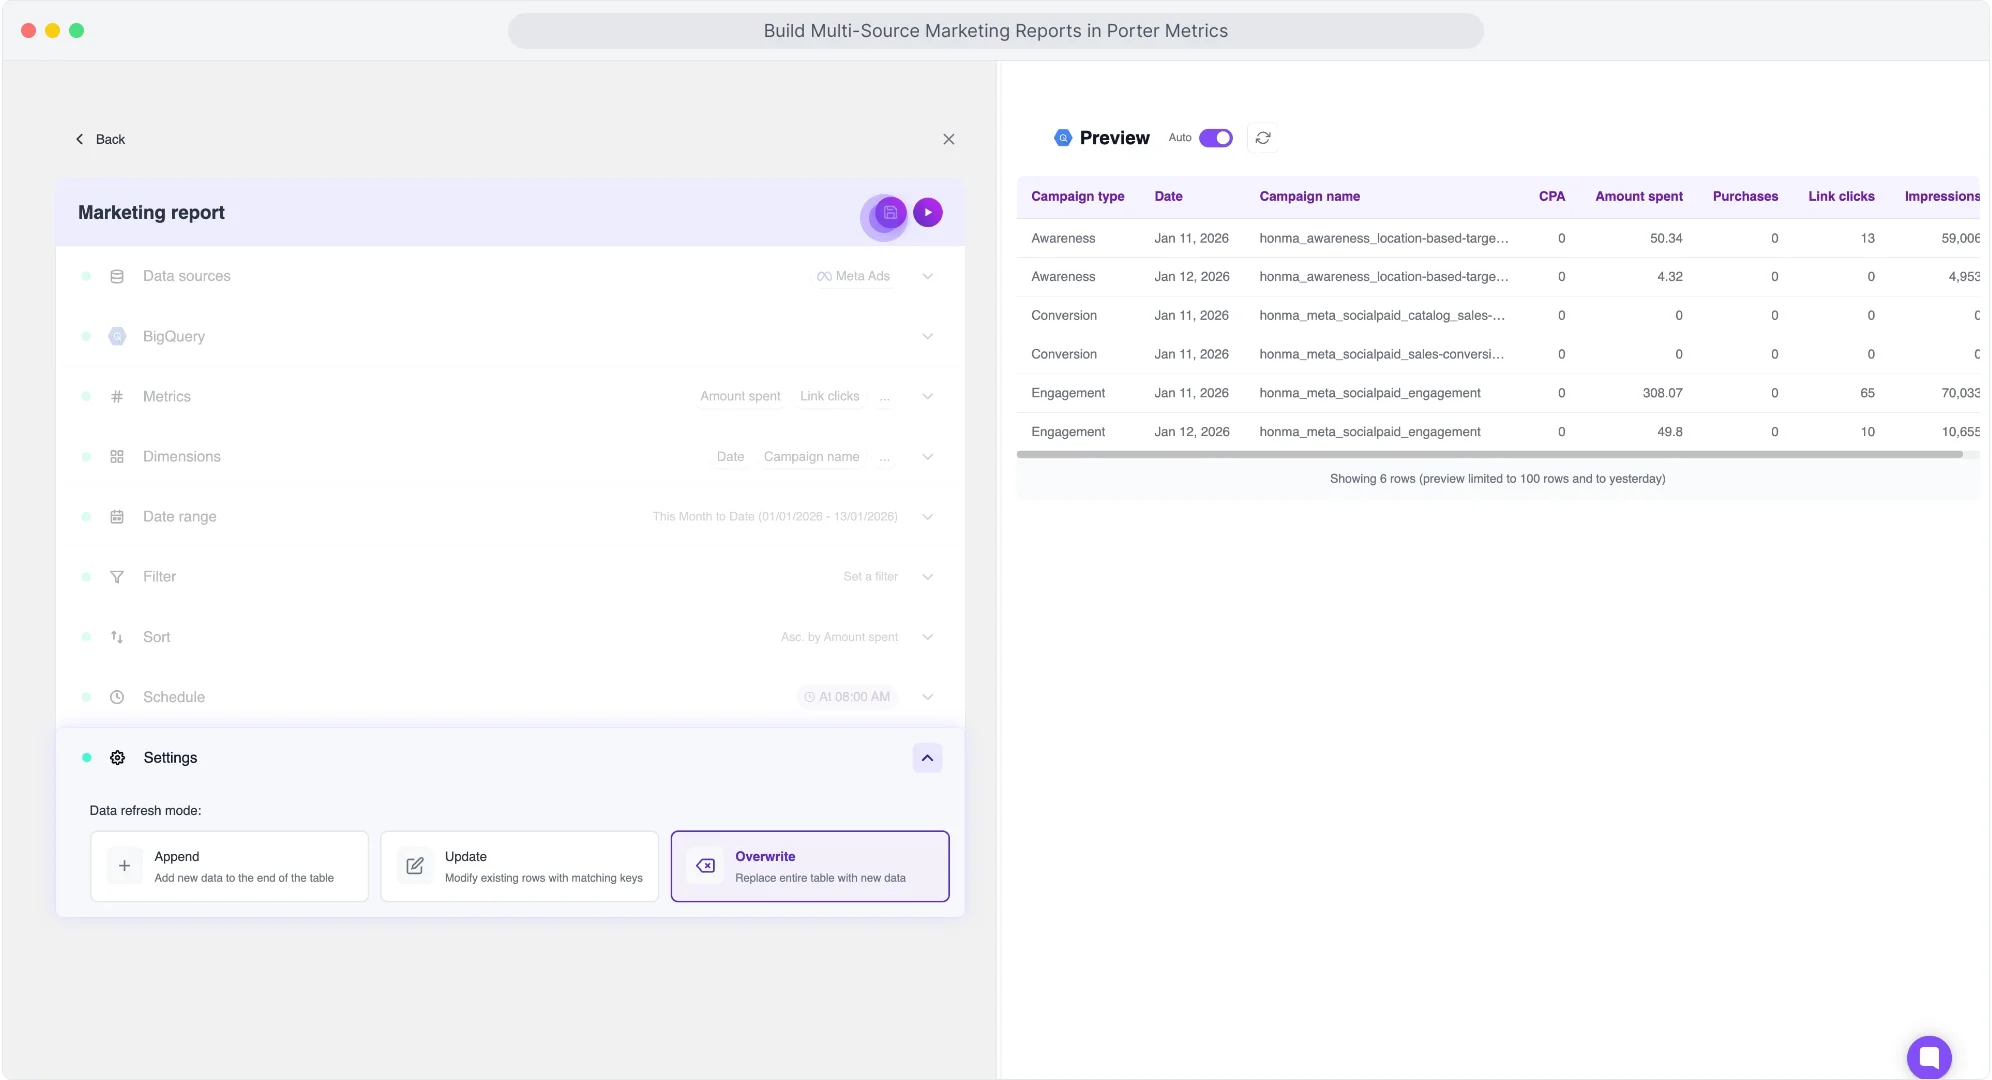
- Overwrite (recommended): deletes existing table and writes fresh data. No duplicates.
- Append: adds new rows below existing data. Risk of duplicates if same date range runs twice.
- Update: matches rows by dimension and updates values. For CRM data with changing values.
Send, monitor, and organize
Click “Save” to save your query and click “Send” to deliver the data to Google BigQuery. The transfer takes a few seconds depending on the volume of data. Once finished, you can refresh it or create more queries.
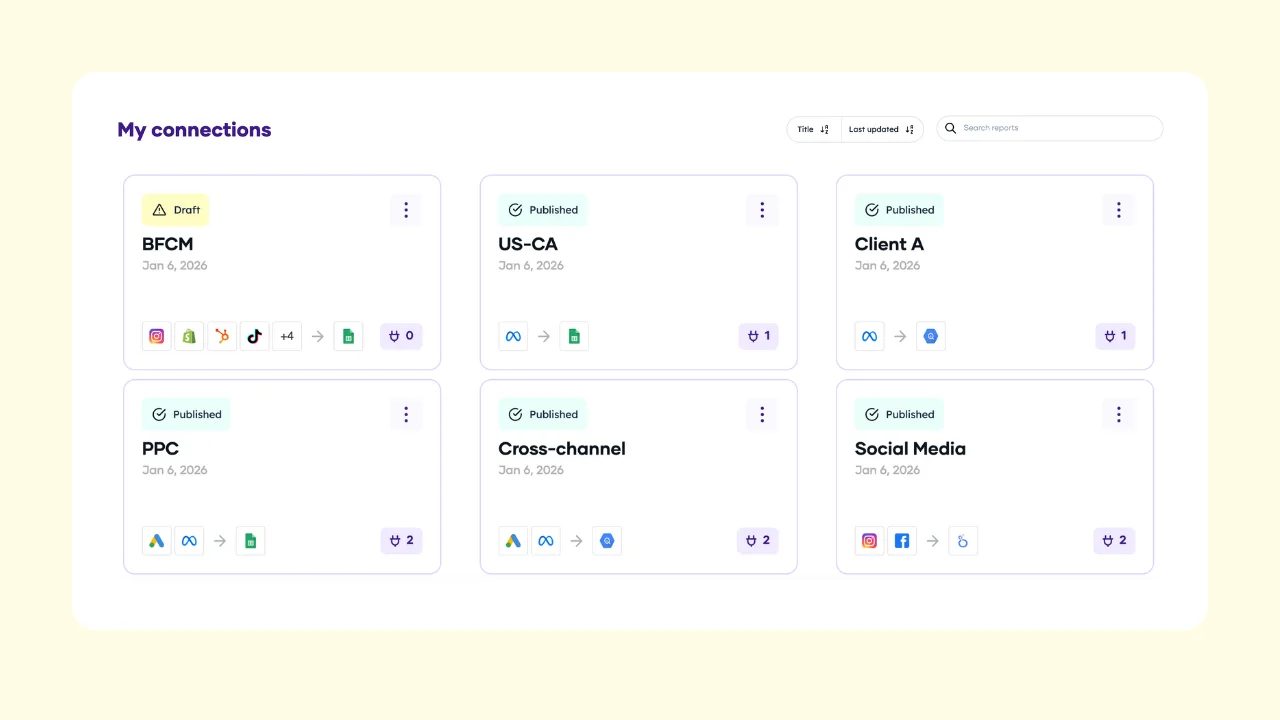
To create more queries: go back to the query manager inside your connection, or go to Porter Metrics → Account → Reports → Connections. In the Queries tab, you’ll see all queries running from your account with their associated connection, name, data sources, last run time, latest status, and option to run manually.
To monitor executions: click the ellipses icon and select “History.” You’ll see logs with exact date and time, execution type (manual or scheduled), and status. If an error occurs, you’ll see the specific error message.
To organize your data: manage connections and queries within them. Name connections by campaign (e.g., “Black Friday”), by client, or by data source. Within each connection, create as many queries or tables as needed and rename them. You can enable/disable queries or connections, and update any query anytime—Porter refreshes and updates the schema on BigQuery automatically.
How to Connect Your BigQuery Table to Google Looker Studio
First, verify your data in BigQuery:
Go to console.cloud.google.com/bigquery. In the left menu, under Products, find BigQuery → Studio. This is where you manage your tables.
BigQuery hierarchy:
- Project (e.g., “Marketing Data”): your top-level container.
- Dataset (e.g., “CRM_Data”): a collection of tables within a project.
- Table (e.g., “HubSpot”): your actual data.
In BigQuery Studio, go to “Classic Explorer” and select your project. Click the ellipsis to create a new dataset if needed (set a name and location, e.g., US or Europe). Navigate to your dataset and table. In “Schema,” see the list of fields and their types. In “Preview,” see your actual data. To refresh data, go back to Porter and resend—Porter overwrites the table.
Connect BigQuery to Looker Studio:
Go to Looker Studio. Click “Create” and select “Report” to start a blank report. Looker Studio will prompt you to add a data source. Search for “BigQuery” and connect your Google account.
You’ll see options: Recent Projects, My Projects, Shared Projects, Custom Query, Public Datasets.
Select “My Projects” and navigate to your project, dataset, and table. In this example: Project “Marketing Data” → Dataset “CRM_Data” → Table “HubSpot”. Click “Add” to connect.
Once connected, Looker Studio loads the fields from your table. Create a chart, add your dimensions (e.g., date) and metrics (e.g., Analytics sessions). Make sure to set a date range that matches your query in Porter.
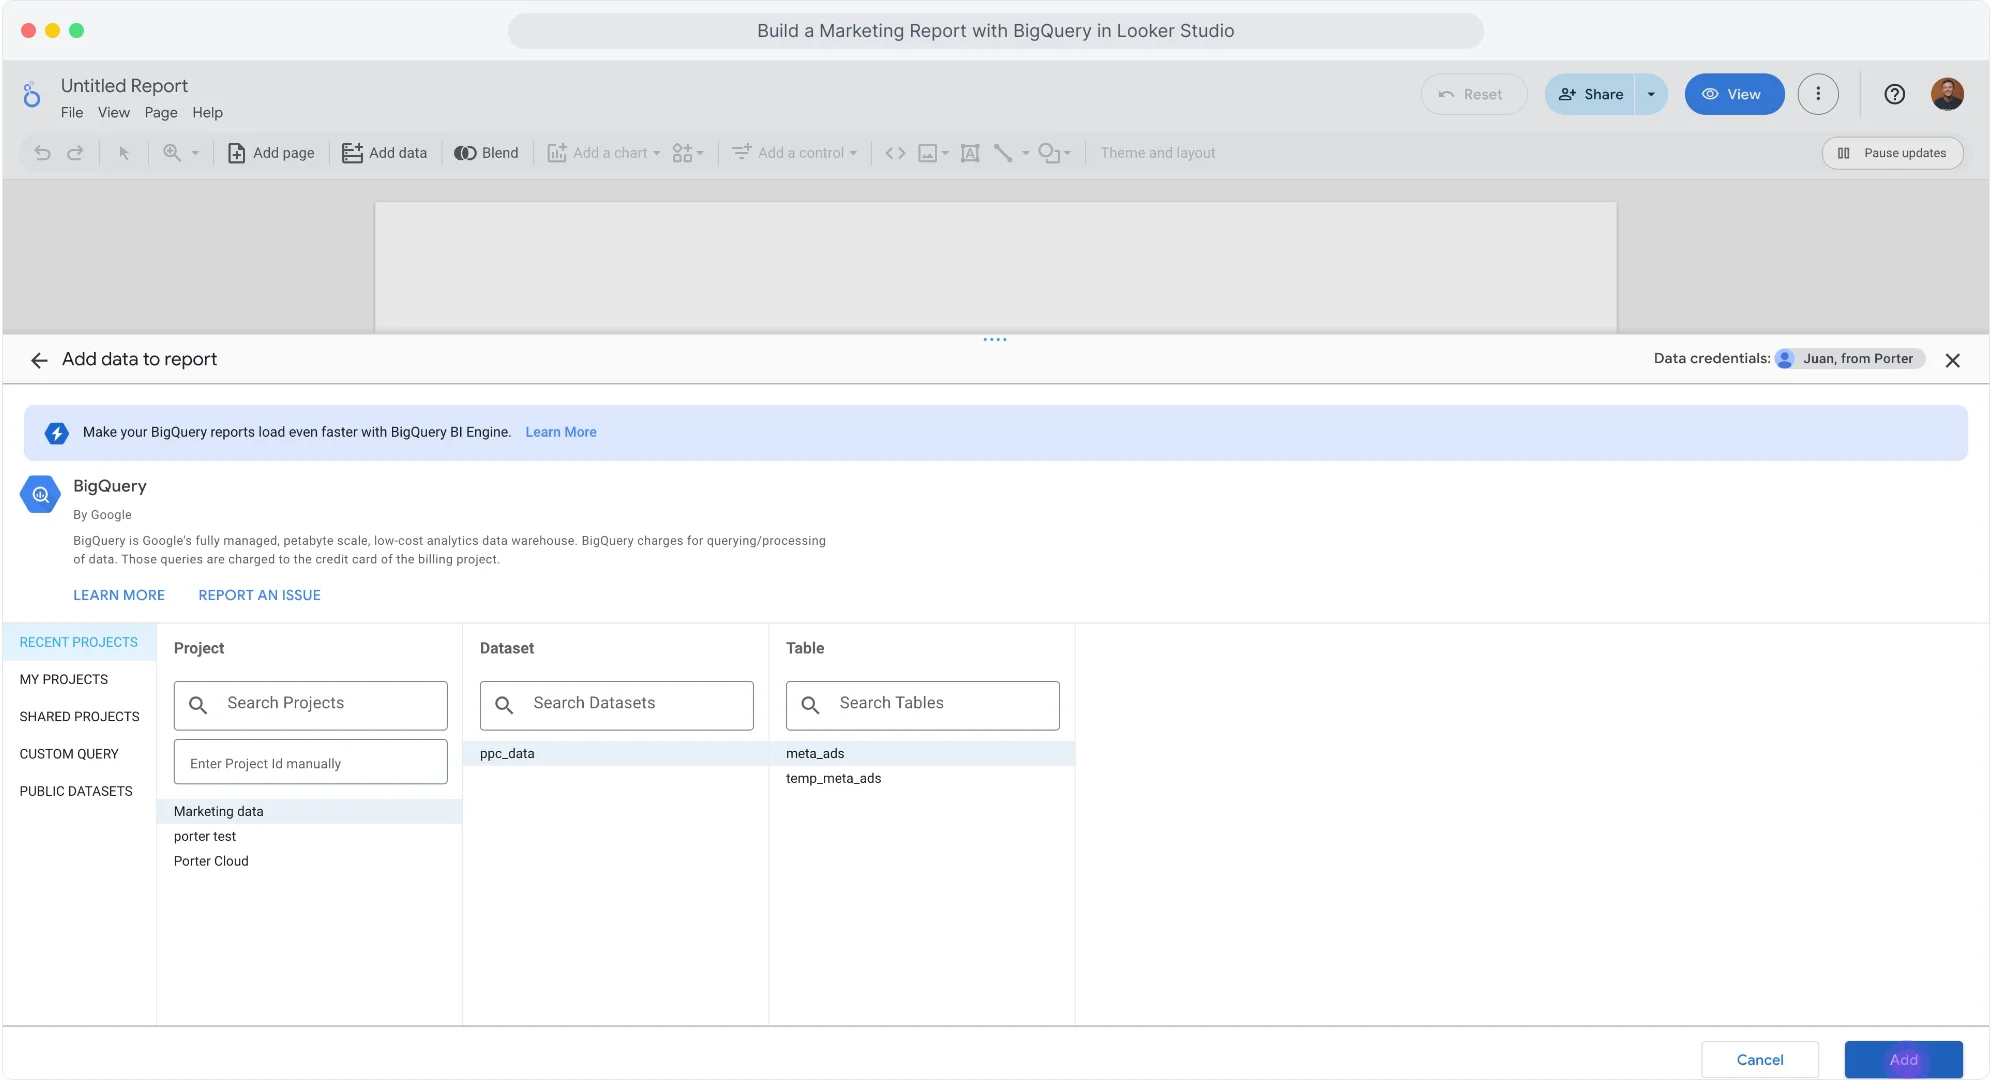
Your BigQuery data is now connected to Looker Studio.
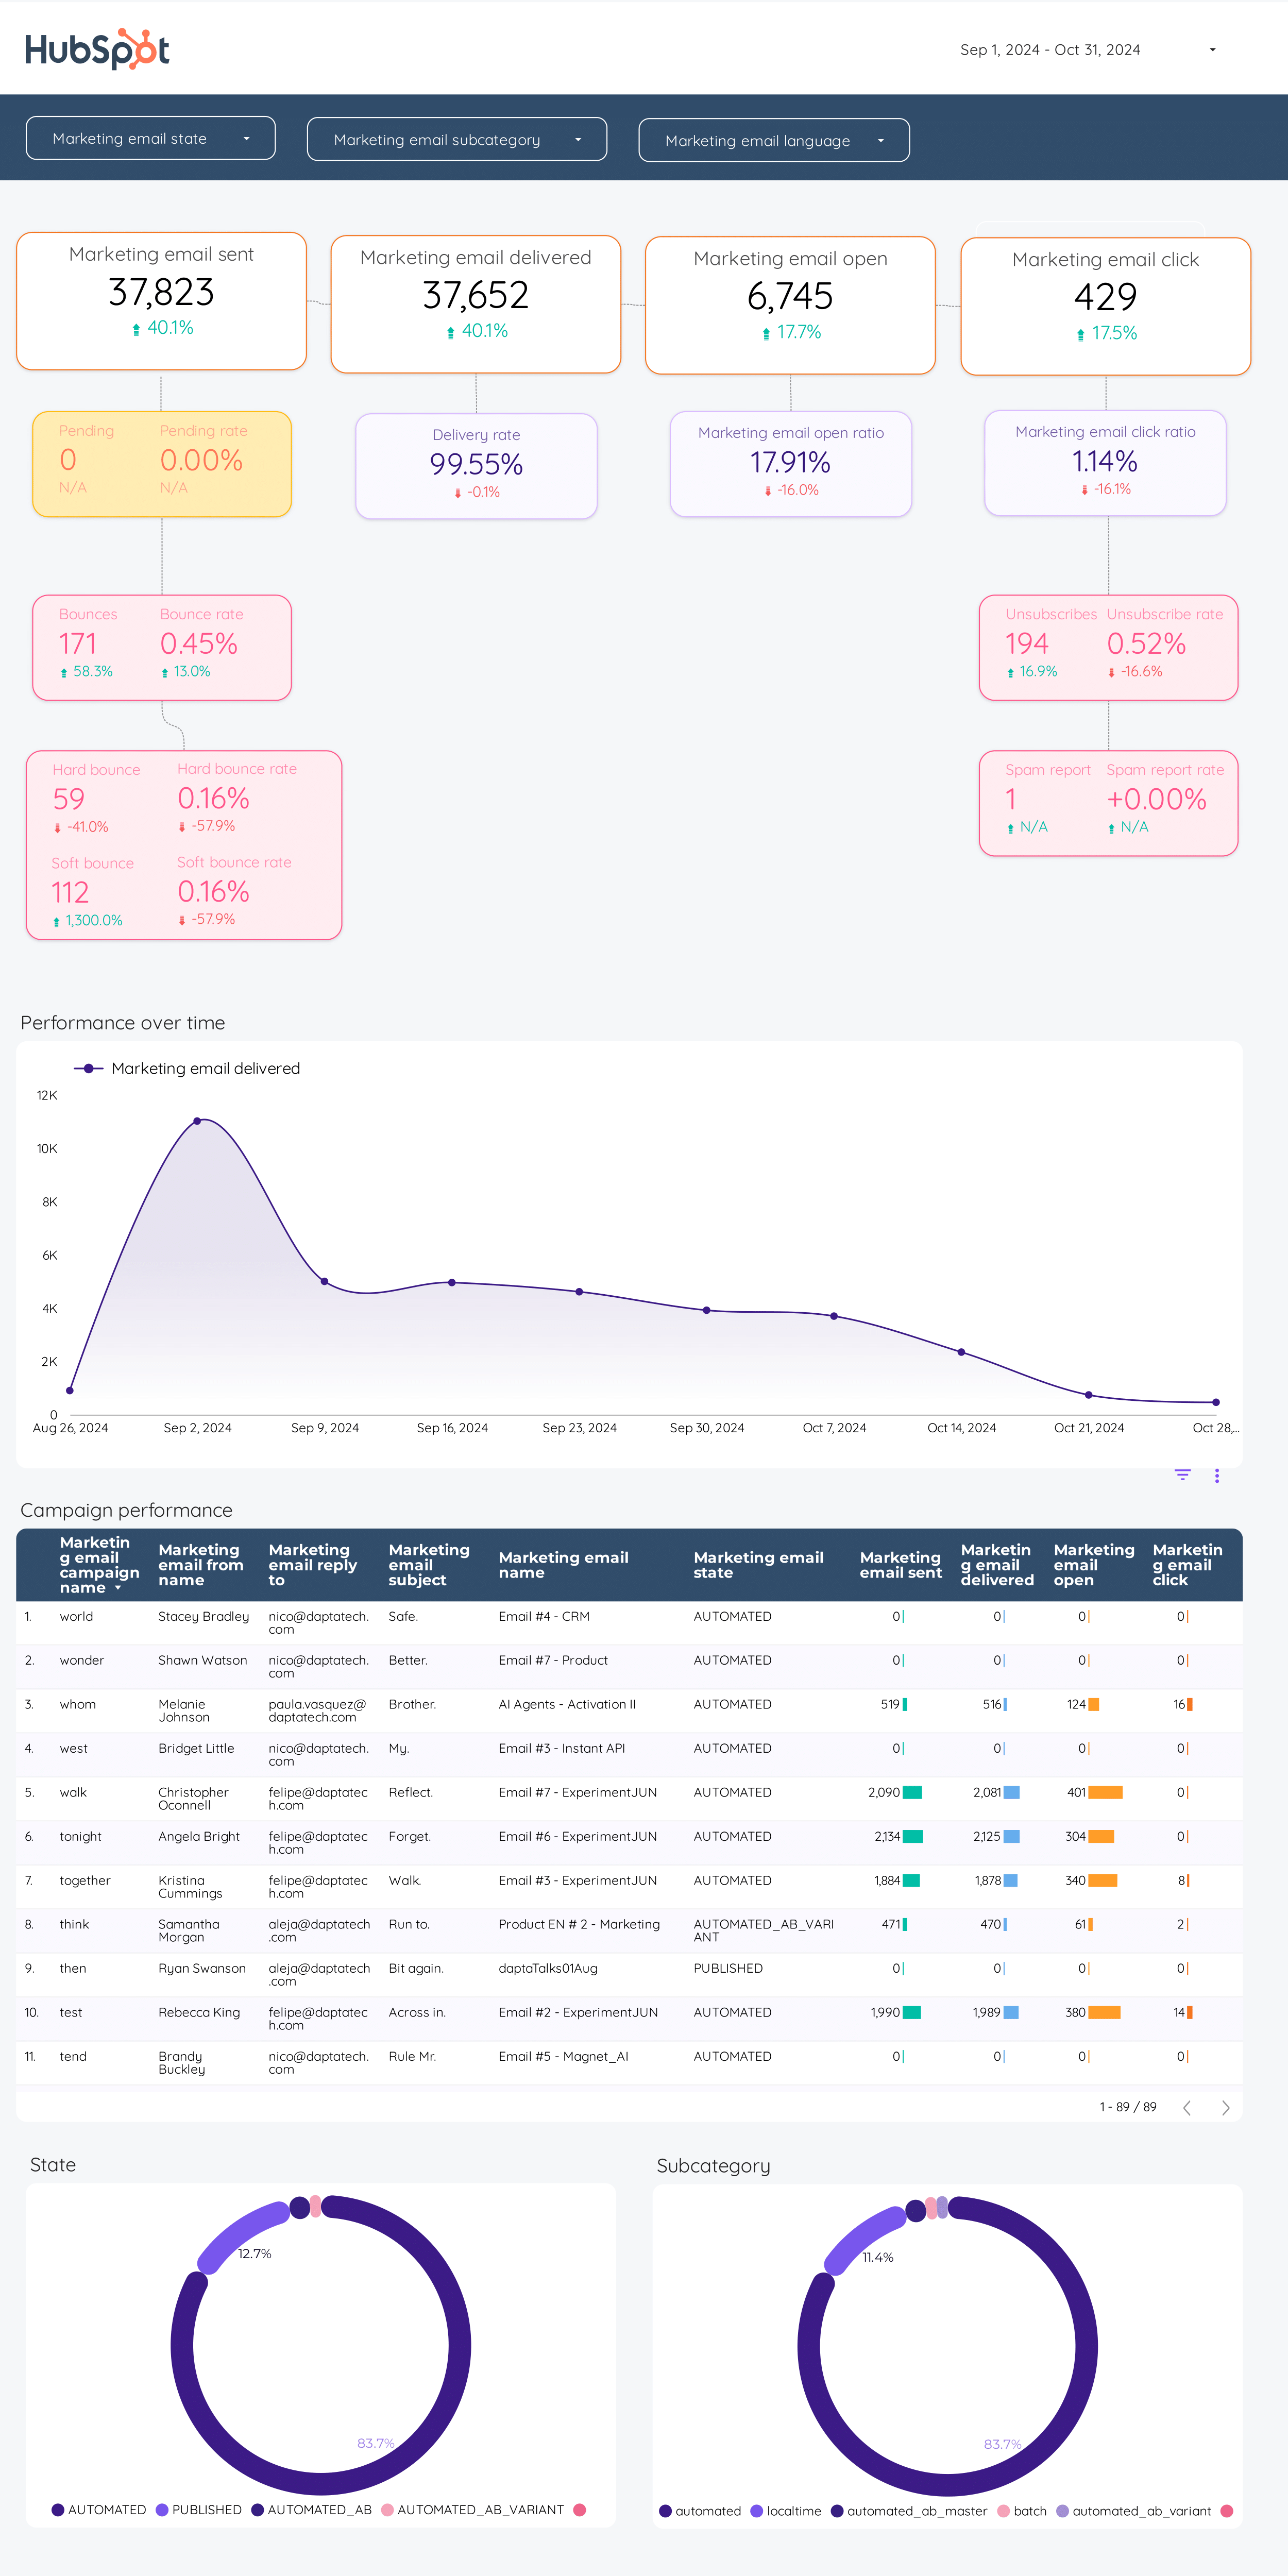
HubSpot Templates for BigQuery + Looker Studio
Porter has the most complete Looker Studio template gallery for marketing data.
Templates are compatible with BigQuery tables created in Porter.
Available templates:
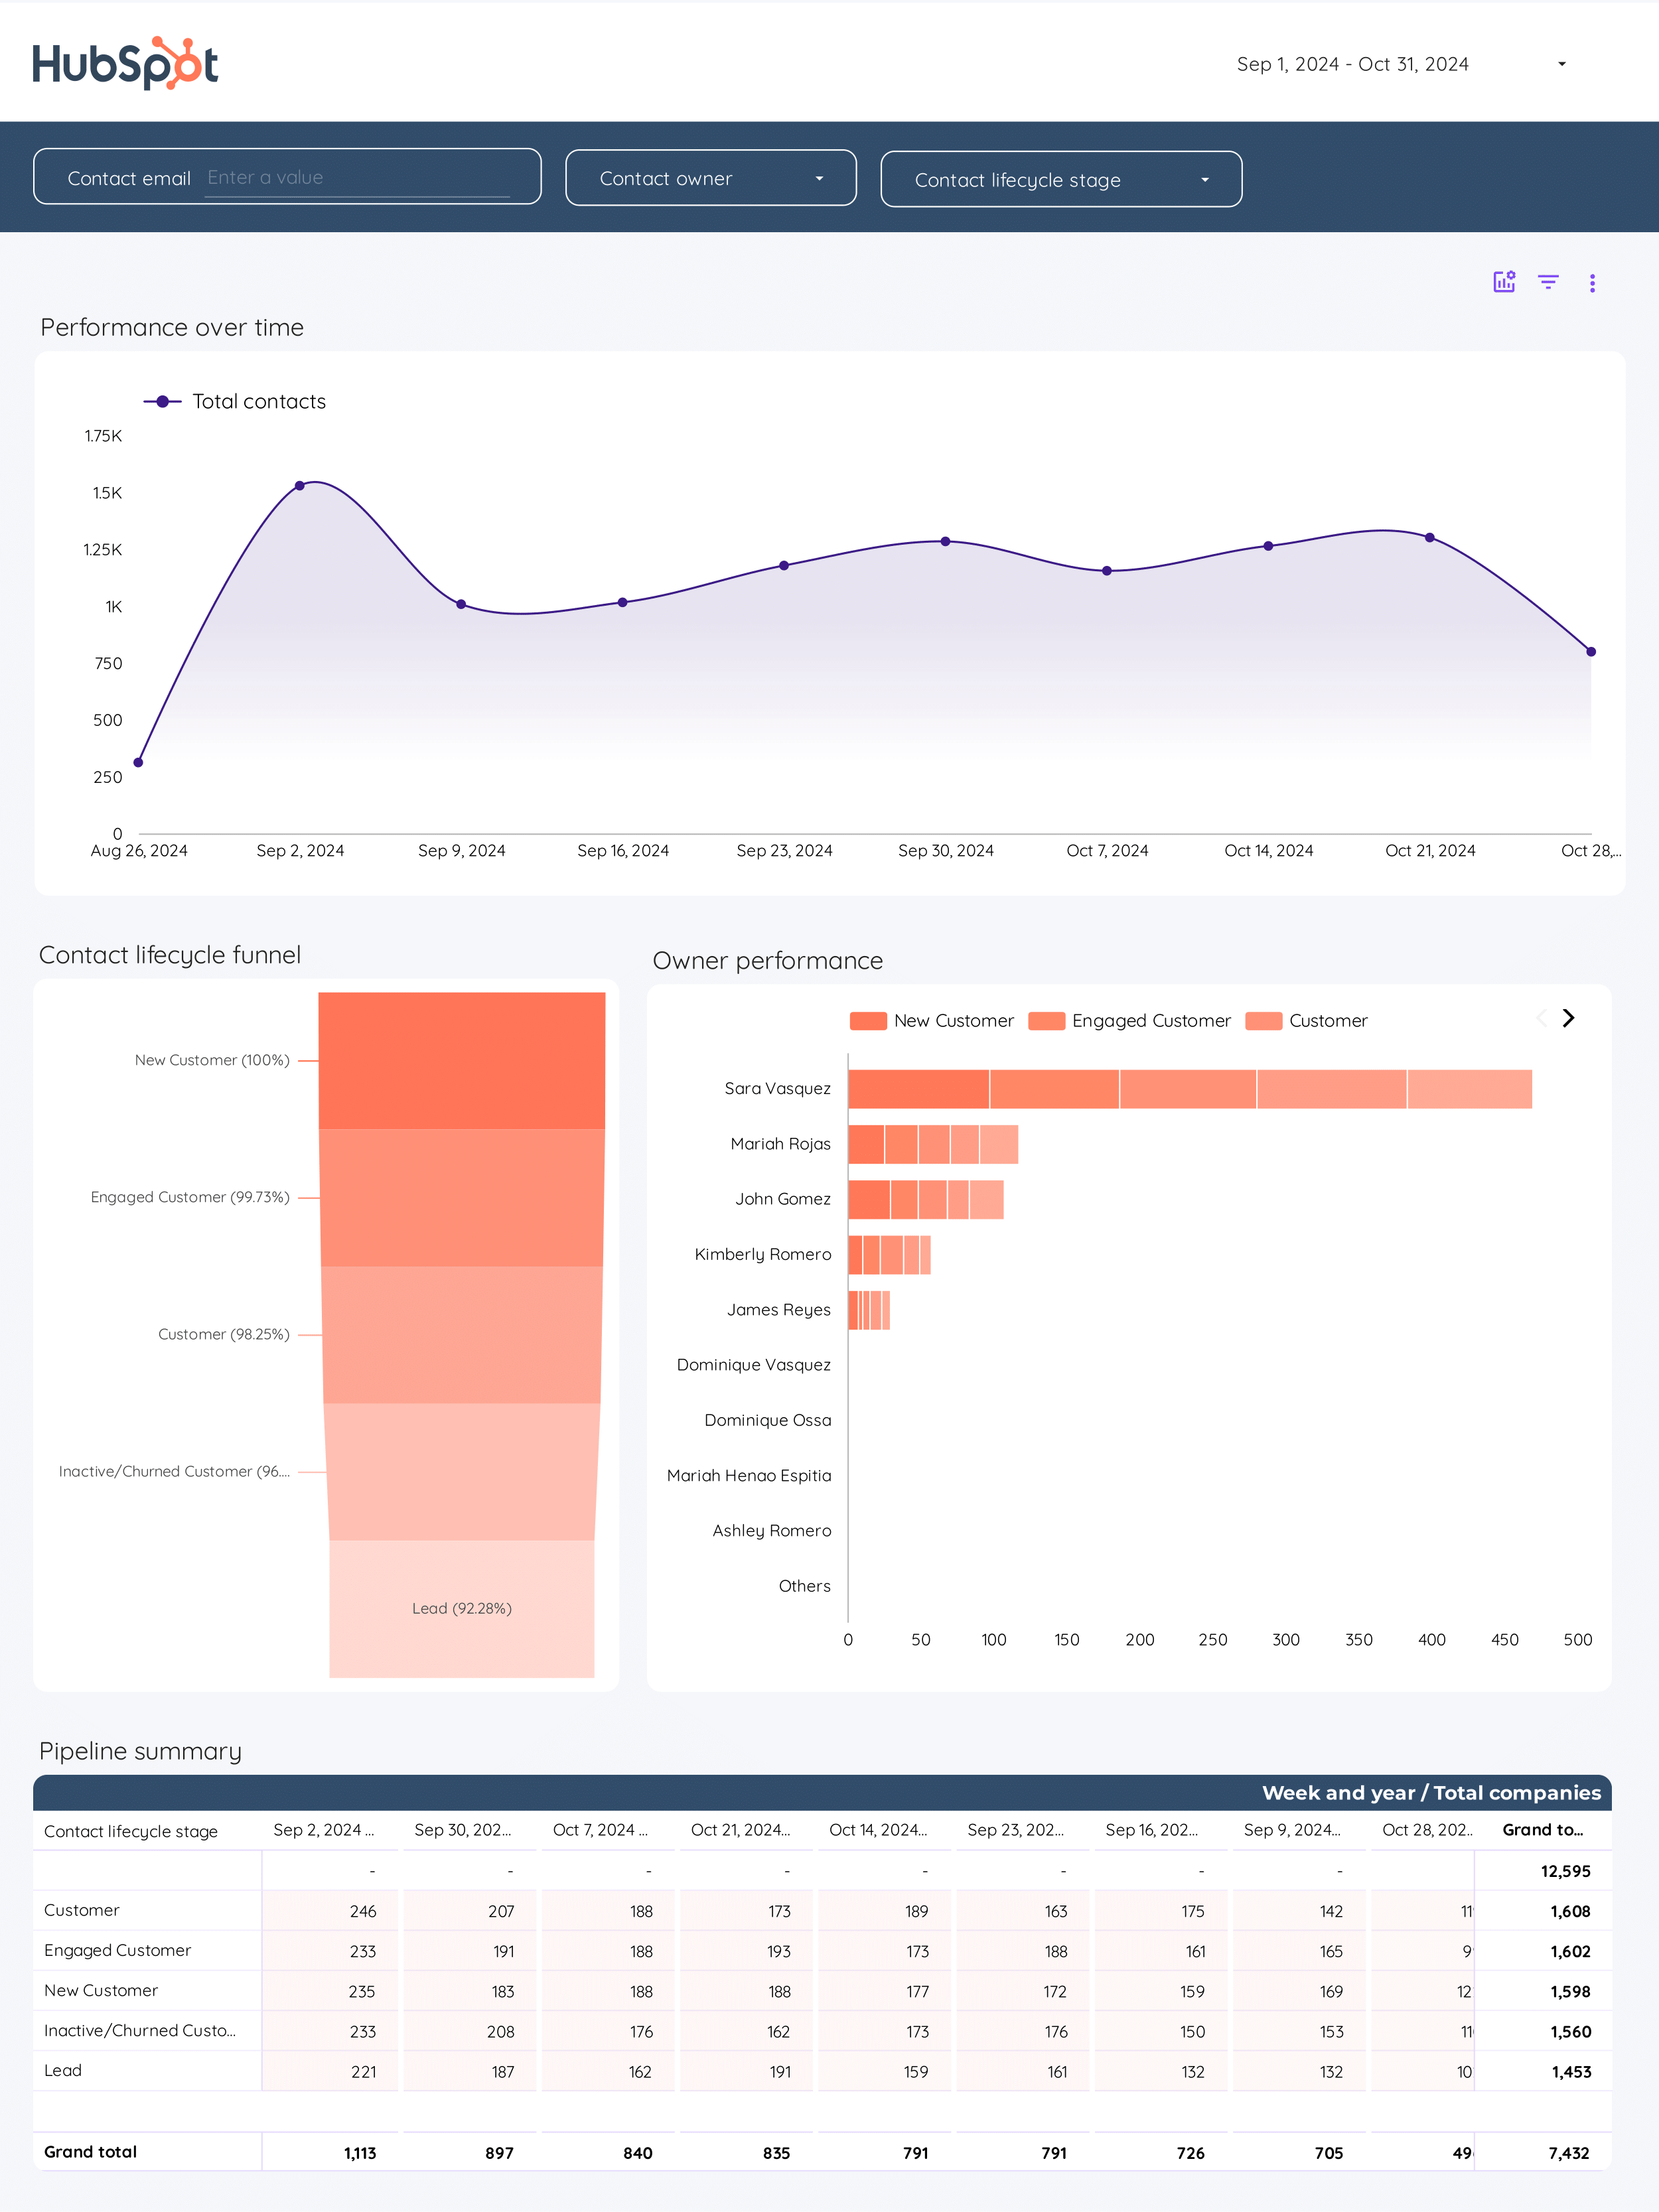
Why Marketers Move HubSpot Data to BigQuery
- Connect any reporting tool: BigQuery connects to Looker Studio, Power BI, Tableau, or any BI tool. One warehouse, every destination.
- Multi-touch attribution: Join HubSpot with raw GA4 event data. Trace the full user path from ad click to conversion.
- Source of truth: Define what “conversion” means for your company. Compare Meta vs. GA4 vs. HubSpot. Pick one source for CAC, ROAS, and CPA. End the “which number is right” debate.
- Company-wide access without platform permissions: Managing permissions across platforms is a pain. With BigQuery, anyone can access marketing data without accounts or roles in each platform. One permission model, all data.
- Make data available for AI: AI needs clean, structured data with context. Every AI tool feels siloed. Integrating sources is complicated. With BigQuery as your universal warehouse, any AI tool can access your marketing data. No custom integrations. No complicated setup.
- Data blending: Combine HubSpot with CRM, GA4, Shopify, Google Ads in one warehouse. Measure real profit, not platform ROAS. Calculate blended CAC across all channels.
What’s Next
Now that your HubSpot data is in BigQuery:
- Connect to BigQuery: learn Google BigQuery for marketers and read tutorials to connect other data sources.
- Connect to Looker Studio: Build dashboards that load in seconds. Use Porter templates or create your own.
- Connect to Google Sheets: Export BigQuery data to Sheets for quick analysis, sharing with clients, or custom calculations.
- Blend data from multiple sources: Add Google Ads, GA4, Shopify, CRM to the same connection. Porter auto-maps equivalent fields. Create cross-channel reports without SQL joins.
- Create AI workflows: Automate alerts and reports with natural language. Example: “Every Monday at 9am, get HubSpot spend for last 7 days, analyze performance with AI, send summary to Slack.”
- Use templates: Start with pre-built Looker Studio templates. Campaign performance, creative analysis, audience breakdowns—ready to connect.
- Explore other destinations: Send HubSpot data to Google Sheets, PostgreSQL, or other warehouses. Same setup process.
Ready to connect HubSpot to BigQuery?
Start your free trial and get your marketing data flowing in minutes.
Book a call →