

Google Looker Studio can be slow because it runs entirely in the browser, queries data sources live on every load, and depends on third-party connectors like Facebook Ads or Shopify that add latency. To make it faster, reduce the number of charts, avoid excessive custom fields and data blending, use the Extract Data connector, use a blended data connector, pre-fetch data through Google Sheets, or connect to BigQuery for the fastest performance.
In this guide, we’ll explain why Looker Studio is slow in detail and walk through each optimization technique step by step.
Why Looker Studio is slow
It’s a browser app, not a desktop tool
Looker Studio is not installed on your computer. It runs inside your browser, like any other website. That means it shares resources with every other tab you have open — Gmail, Slack, Google Docs, everything. The more tabs and extensions you have running, the less room Looker Studio has to work with.
This is the main difference with tools like Power BI or Tableau. Those install on your computer and process data locally, which makes them faster with large amounts of data. Looker Studio does everything — querying, calculating, and rendering charts — inside a single browser tab.
| Feature | Looker Studio | Power BI | Tableau |
|---|---|---|---|
| Where data is processed | Browser tab | Local in-memory model | Dedicated server engine |
| Requires installation | No | Yes | Yes |
| Native caching | No (manual setup needed) | Yes | Yes |
| Performance on large datasets | Slower | Fast | Fast |
| Best for | Shared marketing reports | Complex analytics, internal use | Enterprise analytics |
| Starting cost | Free | From /user/month | From /user/month |
It loads fresh data every time you open a report
Every time someone opens your dashboard, Looker Studio goes to each data source, asks for the data, waits for a response, processes it, and then draws the charts. All of that happens live, right there in your browser.
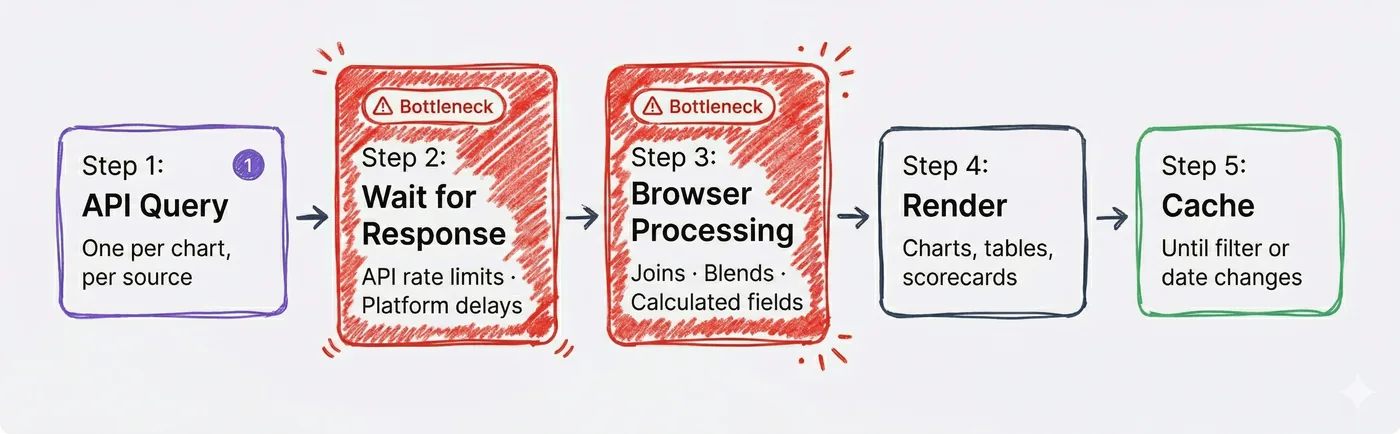
The waiting and processing steps are where most dashboards slow down. The more charts you have, the more times this cycle repeats.
It has no caching by default
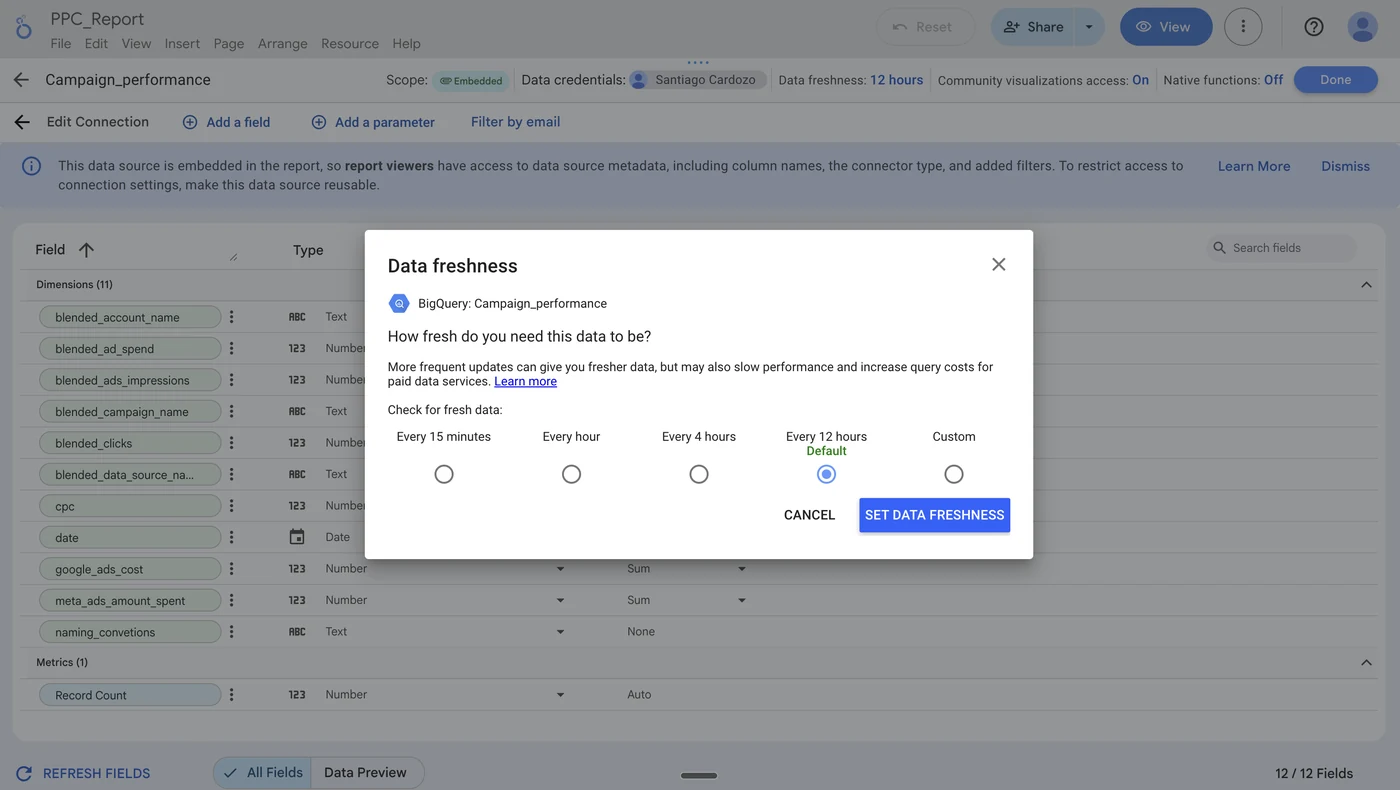
By default, Looker Studio fetches fresh data very frequently. If your data freshness setting is under 12 hours, it skips any saved data and goes straight to the source on every single load. For most marketing reports — daily spend, weekly performance — you don’t need real-time data, and it’s making your dashboard slower for no reason.
It relies on third-party API speed
Looker Studio doesn’t store your data. Every time someone opens your dashboard, it asks each platform — Facebook Ads, Shopify, HubSpot, LinkedIn — for data in real time. How fast your dashboard loads depends largely on how fast those APIs respond.
Google platforms (Google Ads, GA4, Search Console, YouTube) tend to be the fastest in Looker Studio because they have native connectors — Google talking to Google. Ad platforms like Meta Ads, LinkedIn Ads, and TikTok Ads have medium-speed APIs. And platforms like HubSpot and Shopify have more limited APIs that can make dashboards noticeably slow.
| Platform | API Speed |
|---|---|
| Google Ads | Fast (native connector) |
| GA4 | Fast (native connector) |
| Google Search Console | Fast (native connector) |
| YouTube | Fast (native connector) |
| BigQuery | Fastest (native connector) |
| Meta Ads | Medium |
| LinkedIn Ads | Medium |
| TikTok Ads | Medium |
| HubSpot | Limited |
| Shopify | Limited |
For platforms with limited APIs like HubSpot or Shopify, the best way to get fast dashboards is to store the data in BigQuery first and connect Looker Studio to BigQuery instead. Without that intermediate storage layer, those dashboards will always be slow. Google’s native connectors and third-party connectors like Porter Metrics can also make a difference — not all connectors are built the same.
Looker Studio Speed Optimization Checklist
Before diving into each fix, use this checklist to identify which problems are present in your slowest report:
| What to check | Where in Looker | Impact on load time | |
|---|---|---|---|
| Chart and widget count per page. More than 20 to 25 elements is likely your primary issue. Each chart fires its own query on every load. | Count visually on your slowest page | High | |
| Active data blends. Blends with 3 or more sources multiply API calls and add in-browser join processing. | Resource → Manage Blends | High | |
| Calculated fields. CASE WHEN statements, regex, and nested functions run in the browser on every query. | Manage Data Sources → Edit | Medium | |
| Connector types. Third-party connectors for Shopify, HubSpot, TikTok Ads, and LinkedIn Ads are subject to platform API rate limits. | Resource → Manage Data Sources | High | |
| Date range and data volume. Looker has a hard 6-minute query timeout. “Last 12 months” on large datasets causes timeouts. | Report date range selector | Medium | |
| Data freshness setting. If set to less than 12 hours, Looker bypasses the cache and queries the source on every load. | Edit Data Source → Data Freshness | High | |
| Extract Data connector. Caches up to 100MB locally. Reports using extracted sources query local data instead of live APIs. | Add Data → Extract Data | Medium | |
| Google platform status. If your report is well-optimized but still slow at specific times, check for server-side outages. | workspace.google.com/status | Low |
Way 1: Reduce the number of charts and pages
Google’s own documentation warns that dashboards with 25 or more tiles tend to have performance problems. Each chart fires its own query. A page with 40 widgets makes 40 simultaneous requests every time it loads, and each request waits for an API response before the page can fully render.
This is the most common cause of slow Looker Studio reports and the easiest to fix without touching your data architecture.
- Split the report into focused pages by theme: overview, paid media, organic, conversions.
- Merge scorecards from the same source into one table. Combining 3 scorecards into 1 table cuts API calls from that source by up to 66%.
- Disable cross-filtering on charts that do not need it: Chart Setup → Chart Interactions → uncheck Cross-filtering.
- Replace conditional formatting with heatmap formatting on large campaign tables. It renders significantly faster.
Additional quick wins:
- Change the default date range from “Last 12 months” to “Last 30 days” or “Last month.” Fewer rows per query means faster response from every connected source.
- Place charts from the same data source on the same page. Mixing ad platform sources across one page increases simultaneous connections on load.
- Remove calculated fields you are not actively using from your data source settings. They run on every query even if no chart is displaying the field.
- Open reports in an incognito window for editing. No extensions, no cookies, fewer competing browser resources.
Way 2: Reduce custom fields and data blending
Data blending is the most commonly cited cause of slow marketing dashboards after chart count. When you blend two sources in Looker Studio, here is what happens in the browser:
-
1
Looker fires a separate API query for each blended source
-
2
It waits for all responses to come back
-
3
It executes the join logic in-browser on the combined result sets
-
4
Only then can it render the chart
This process runs on every page load, every filter change, every date range update. Blending three marketing sources does not triple the load time. It makes it unpredictable, because it depends on whichever platform API is slowest at that moment.
Calculated fields compound the problem. Go to Resource → Manage Added Data Sources → Edit and count your calculated fields. Complex logic such as CASE WHEN statements, regex, and nested functions runs on every query, on every chart that uses it. Common marketing metrics like blended ROAS, CAC, and CPL are often calculated this way.
The fix is not to remove blending. It is to do the blend before the data reaches Looker. Pre-join your marketing sources in BigQuery or Google Sheets, feed one clean unified table to Looker, and let Looker do what it was designed for: display the data.
| Source combination | What you unify |
|---|---|
| Meta Ads + Google Ads | Cross-channel spend and ROAS in one view |
| Google Ads + GA4 | Campaign-level conversion data |
| Shopify + Meta Ads | True revenue attribution |
| Google Search Console + GA4 | Organic traffic quality and intent |
| HubSpot + Google Ads | Lead-to-close attribution |
Porter Metrics writes all of these combinations into a single normalized BigQuery or Google Sheets table automatically.
Way 3: Use the Extract Data connector
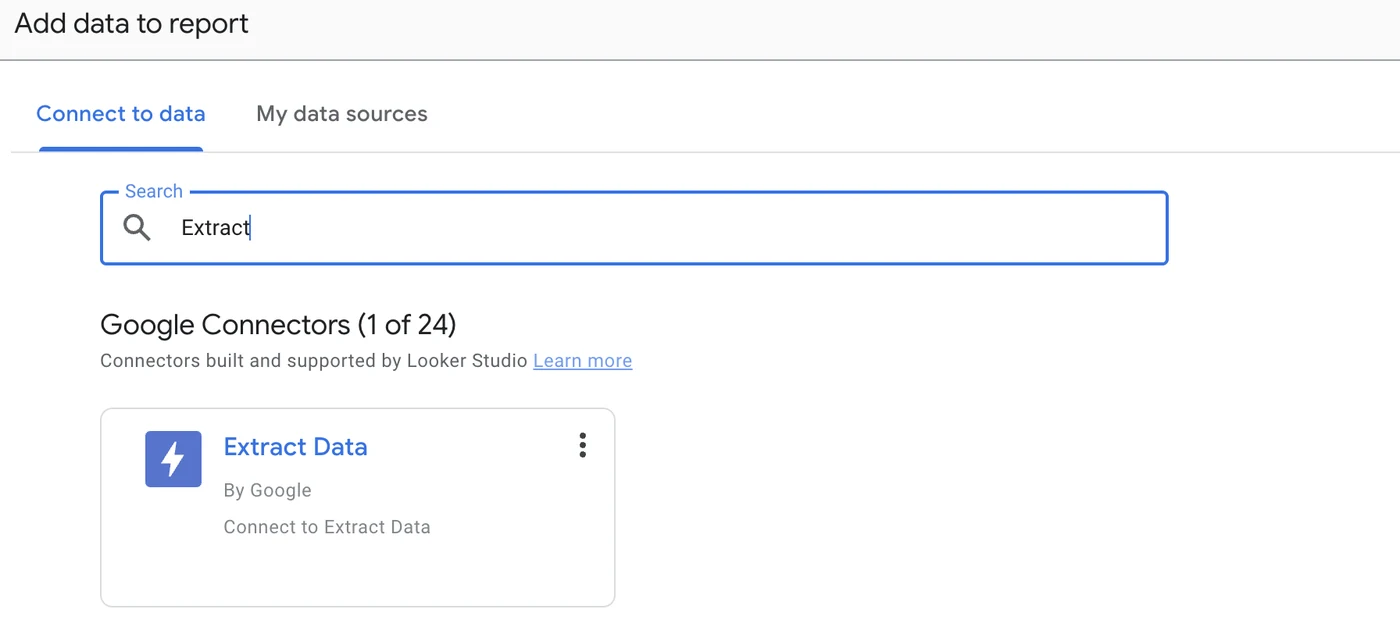
Looker Studio’s built-in Extract Data connector is a free, native caching solution that most users overlook. It stores a snapshot of your data, up to 100MB, directly inside Looker Studio itself, with scheduled refreshes you control. Reports using extracted sources query local data instead of live marketing APIs, which dramatically reduces load time.
Because the extracted data lives inside Looker’s own infrastructure, it is not subject to API rate limits, third-party connector performance variability, or platform outages. The report loads the cached snapshot, period. For standard marketing dashboards with a relatively fixed KPI set, this alone can cut load times by 60 to 80 percent.
Setting it up takes a few minutes: in Looker Studio, go to Add Data → Extract Data, select your existing data source, choose the fields you need, and set the refresh schedule. Looker handles the rest.
Limitation: The 100MB cap is a hard limit. For large ad accounts with years of daily data, multi-client agency dashboards, or any report requiring more than a few months of granular data, you will hit the ceiling quickly. In those cases, Google Sheets or BigQuery are the right next step.
Way 4: Use Blended Data Connectors
A typical Looker Studio setup uses one connector per data source: one for Meta Ads, one for Shopify, one for HubSpot, and so on. Each connector means a separate API call, separate processing, and more load on your browser. If you need to combine data across platforms, you also end up creating custom fields and blends inside Looker Studio, which slows things down even more.
A blended data connector solves this by combining multiple data sources into a single connection. Instead of Looker Studio doing the heavy lifting of merging tables, the connector does it before the data even reaches your dashboard. Fewer connections, fewer custom fields, less processing in the browser.
Porter Metrics has a built-in Data Blending feature that automatically matches and combines related data across your marketing platforms. For example:
- Campaign performance across all your ad platforms (Meta, Google, TikTok) in one view
- Social media posts and images combined across channels
- Ad impressions, spend, and conversions unified across all platforms
- UTM tracking data already matched to the right campaigns
All that data transformation that you would normally have to do manually — matching campaign names, combining spend across platforms, aligning UTMs — Porter already handles it at the connector level. Your dashboard just receives clean, combined data ready to visualize.
Think of this as the ideal middle ground: you get the benefits of combined, pre-processed data without having to migrate to BigQuery or do anything technical. It is the step between using basic connectors and setting up a full data warehouse.
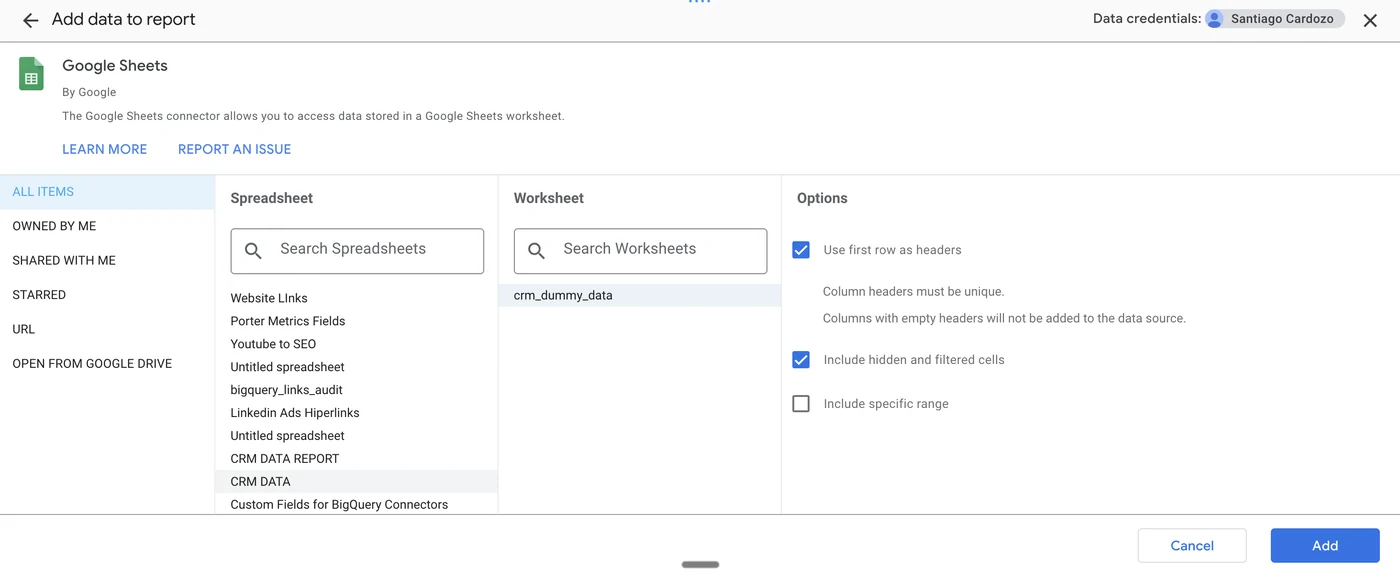
Way 5: Connect to Google Sheets
Google Sheets as a pre-fetched data layer
Instead of connecting Looker directly to Meta Ads or Shopify, you pull your marketing data into a Google Sheet on a schedule, and connect Looker to the Sheet instead. Because Google Sheets returns pre-fetched, static data, there is no API latency and no connector overhead on each load.
Porter Metrics has a native integration with Google Sheets — directly from the Porter platform, you can send your marketing data from Meta Ads, Google Ads, TikTok Ads, GA4, HubSpot, Shopify, and 15+ other platforms into a Google Sheet on a daily schedule. No manual exports, no extensions, no copy-pasting. See our tutorial: How to connect your marketing data to Google Sheets with Porter Metrics.
Tradeoff: Google Sheets has a 10 million cell limit and each sheet is a fixed table. If you need new fields, you update the Porter Metrics connection. Watch for sheets that grow very large and themselves become slow to load. That is when BigQuery becomes the right destination.
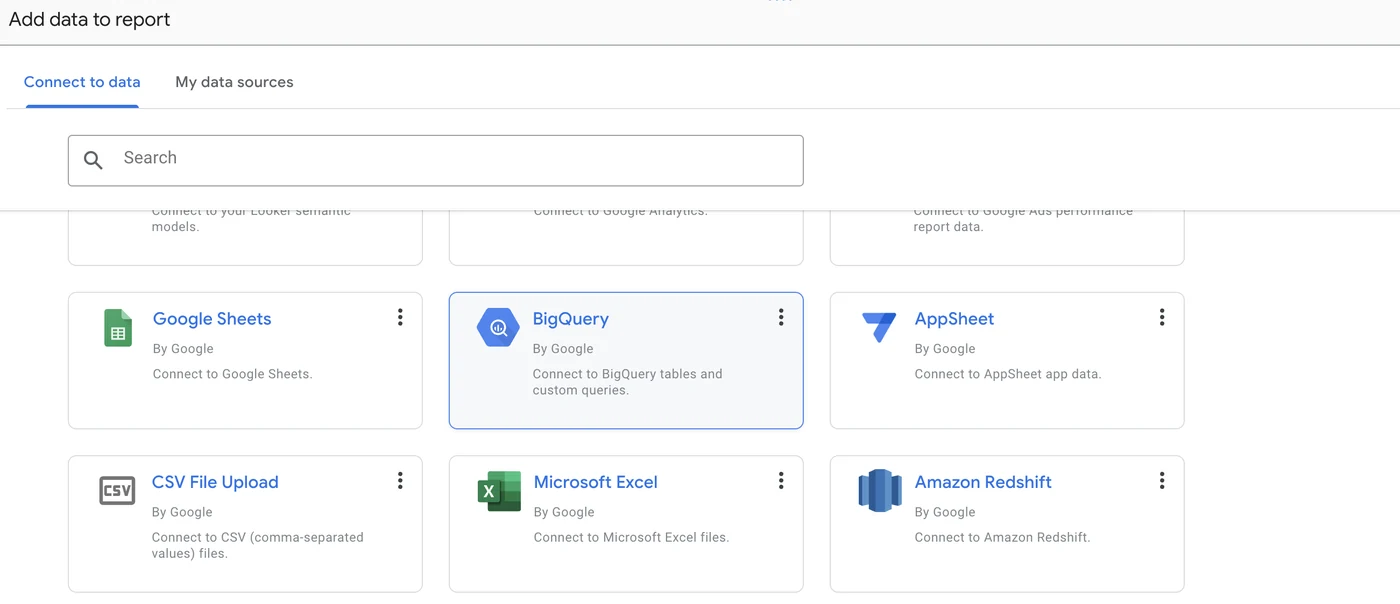
Way 6: Connect to BigQuery
BigQuery native connection: the fastest Looker Studio architecture
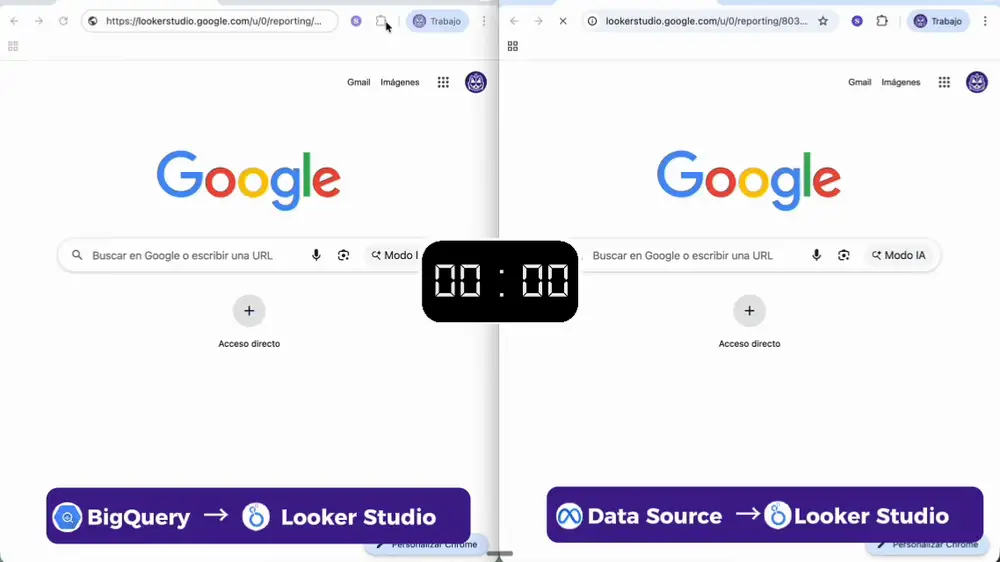
BigQuery is Google’s data warehouse, and its integration with Looker Studio is native. Both are Google products, and Google gives its own connector preferential performance. When you connect Looker to BigQuery natively, reports load in 1 to 2 seconds regardless of data volume.
BigQuery scales to millions of rows without degradation. For marketing agencies monitoring 30 to 40 client accounts in a single report, BigQuery is not optional. It is the only architecture that makes it feasible. Learn more: Porter Metrics BigQuery connector.
We had clients with more than 30 ad accounts connected via direct Looker Studio connectors. Load times exceeded two minutes. After migrating to BigQuery using Porter Metrics, the same report loaded in 1 to 2 seconds. The data structure that Porter creates in BigQuery is already normalized across platforms, so you do not need to clean anything before connecting Looker. — Juan José Bello, Founder, Porter Metrics
Porter Metrics connects your marketing platforms directly to BigQuery, including Meta Ads, Google Ads, TikTok Ads, LinkedIn Ads, GA4, Shopify, HubSpot, Google Search Console, and more, with normalized field names across all sources. Your BigQuery tables are analysis-ready and Looker-ready from the moment they land. Browse all our BigQuery tutorials to get started.
When you need it: Large ad accounts, GA4 properties with millions of sessions, multi-brand or multi-region reporting, agencies with many clients in a single dashboard.
Make your Looker Studio Dashboards Load Faster
Every optimization we covered in this guide — reducing charts, using Extract Data, blending data sources, connecting to Google Sheets, or moving to BigQuery — you can do all of them with Porter Metrics.
With Porter, you can:
- Connect your marketing data directly to Google Sheets as a pre-fetched data layer
- Connect to Google BigQuery for the fastest possible dashboard performance
- Use Blended Data Connectors that combine and pre-process data from multiple platforms automatically
- Access 50+ marketing connectors for platforms like Meta Ads, Google Ads, TikTok, HubSpot, Shopify, and more
- Follow our tutorials and guides to learn dashboard design techniques — filters, dropdowns, and layout best practices that keep your reports fast