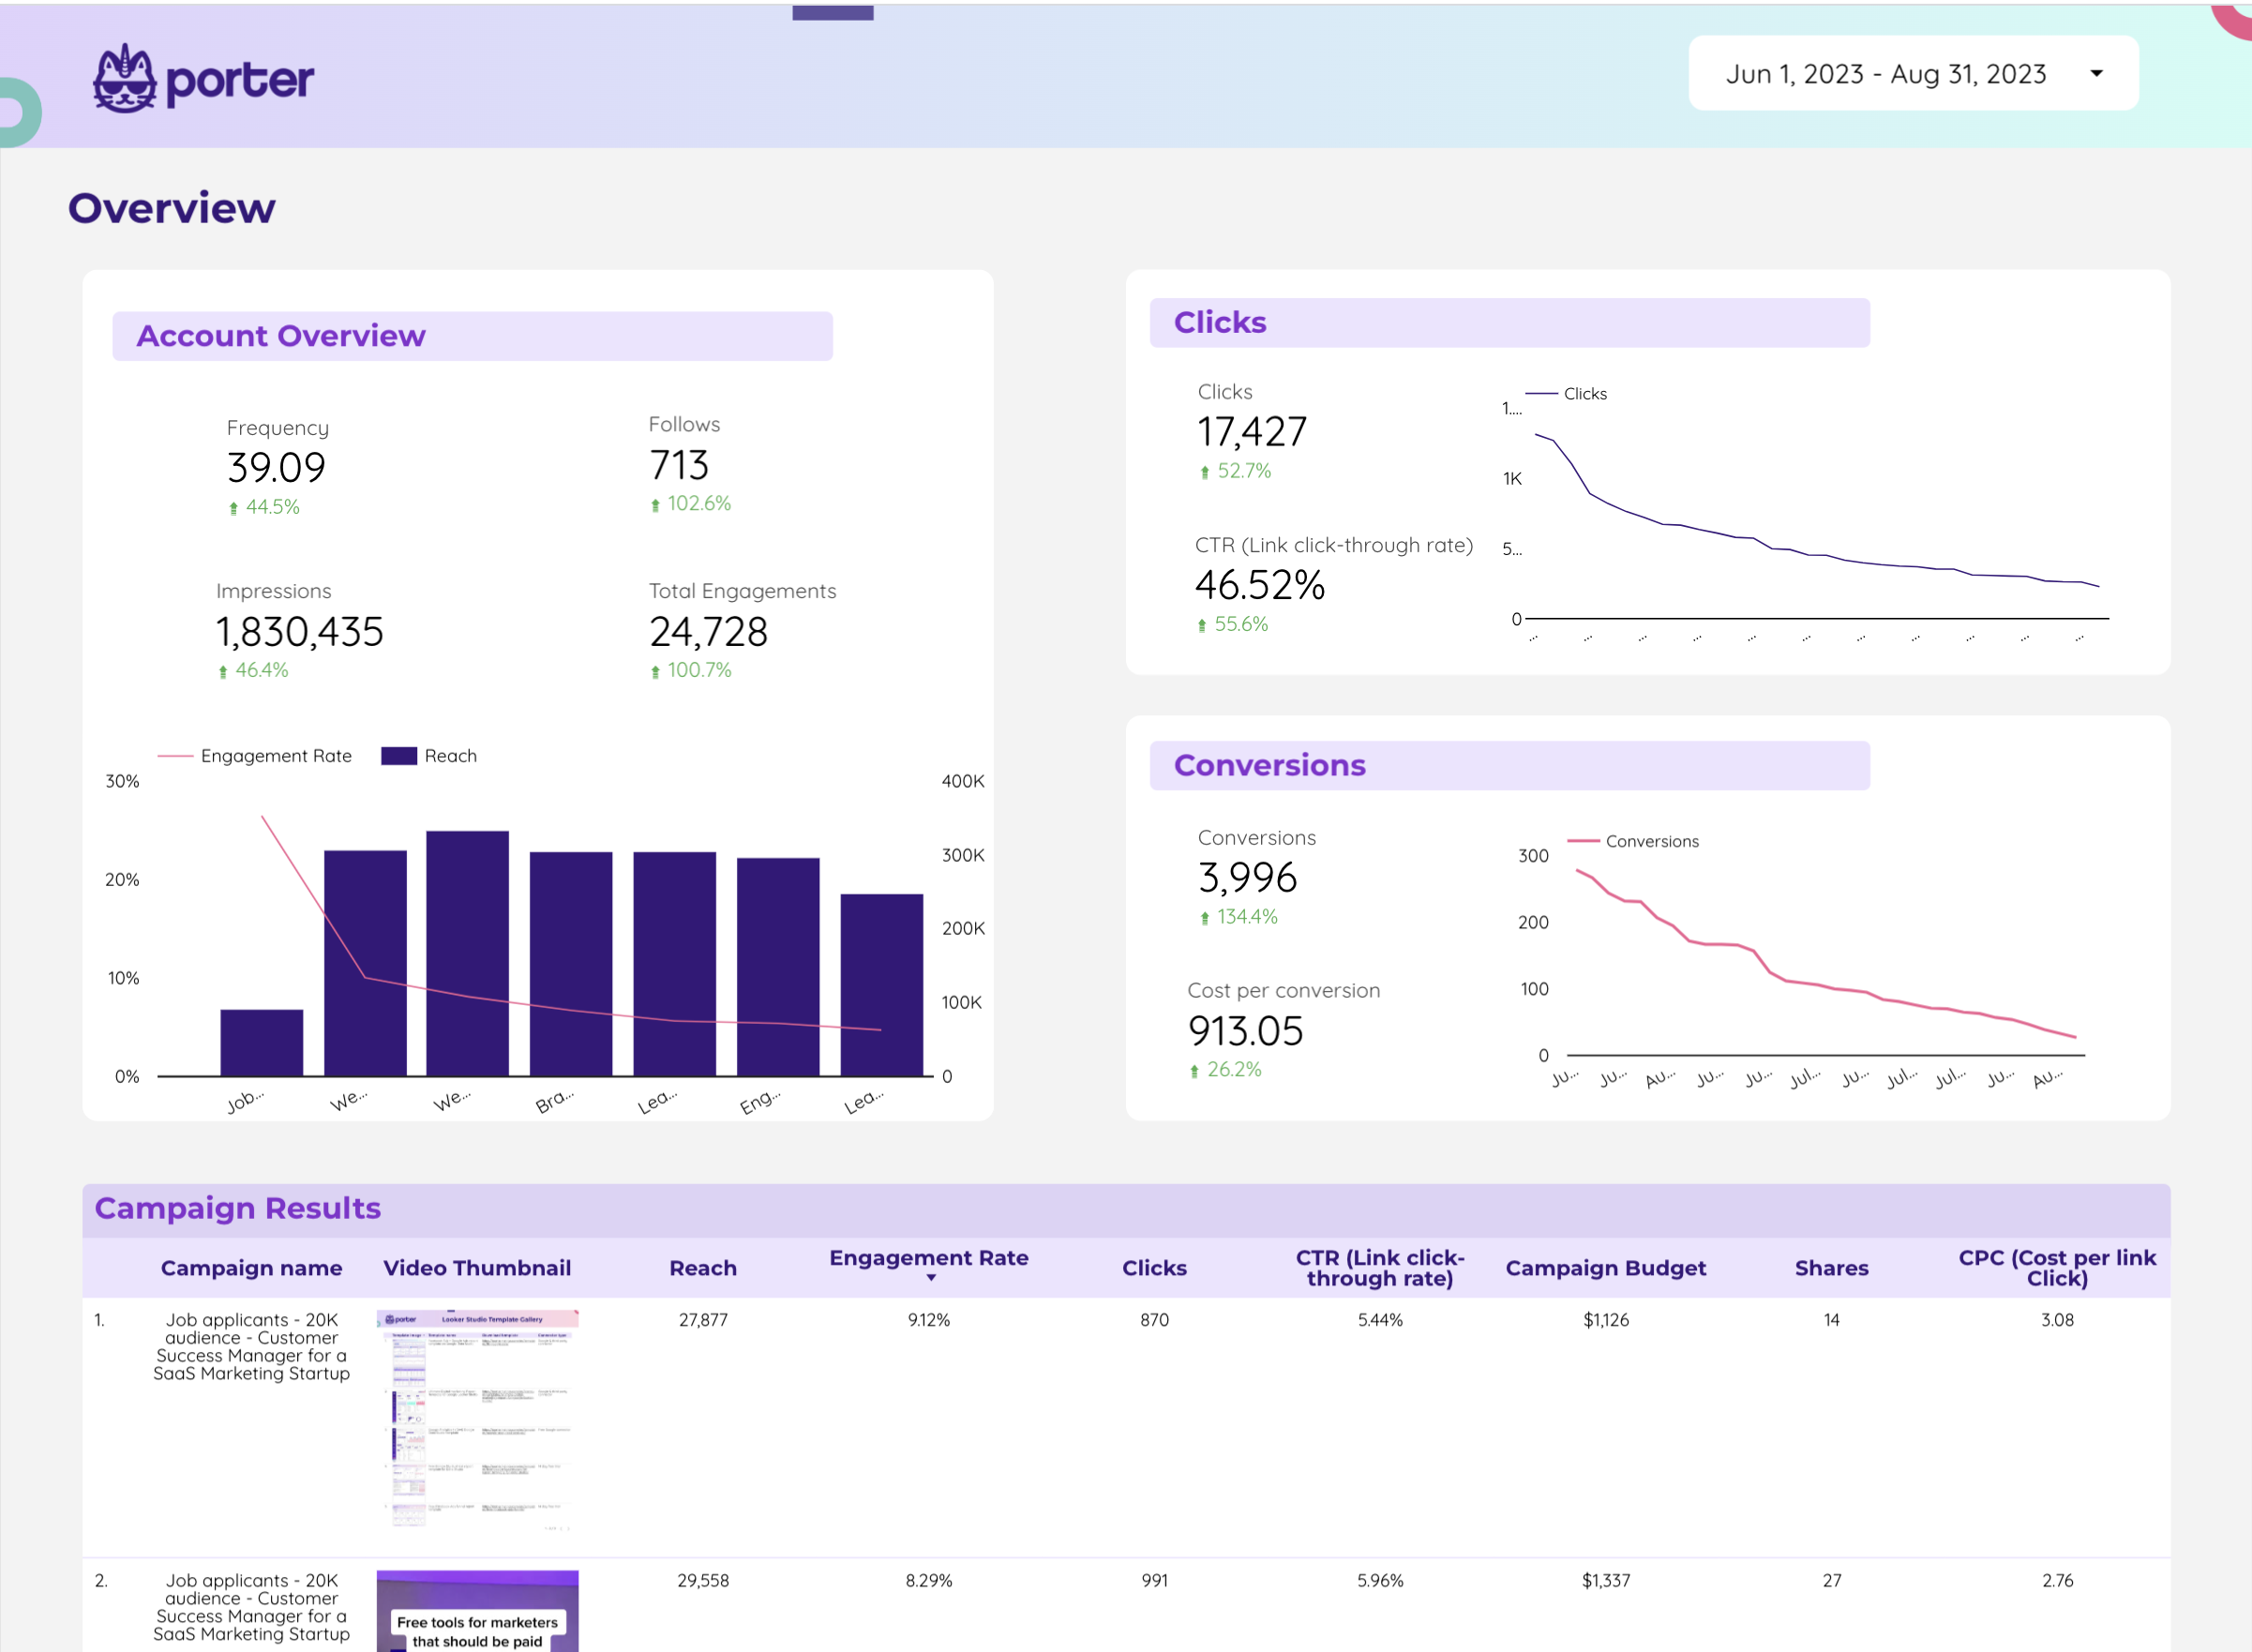
A LinkedIn Ads report should include: Visibility metrics like impressions, reach, and click-through rate. Engagement metrics such as likes, comments, and shares. Conversion metrics like leads generated, conversion rate, and cost per conversion. Data should be segmented by campaign, channel, audience, content, objective, and date to get insights. For example, analyze which campaign drove the highest conversion rate, or compare the performance of different audiences in terms of engagement metrics.
To build a LinkedIn Ads dashboard, 1) connect your LinkedIn Ads account and any other relevant data sources. 2) Choose metrics such as click-through rate, impressions, and conversions to monitor performance. 3) Segment your data by campaign, channel, audience, product, customer content, objective, and date for a detailed analysis. 4) Add filters or buttons for interactivity, such as filtering by date range or campaign type. 5) Share your dashboard via PDF, scheduled emails, or links for easy access and review.
Yes, Looker Studio allows you to download your report as a PDF. To do it, follow these steps:
Before downloading your report choose the date range you want to visualize on your report.
Click on the “File” menu at the top left corner of the screen.
Select “Download as” from the drop-down menu and choose “PDF.”
You can choose which pages you want to download, and also you can add a password to protect the report and add a link back to the online report.
Click on “Download” to save the report on your device.