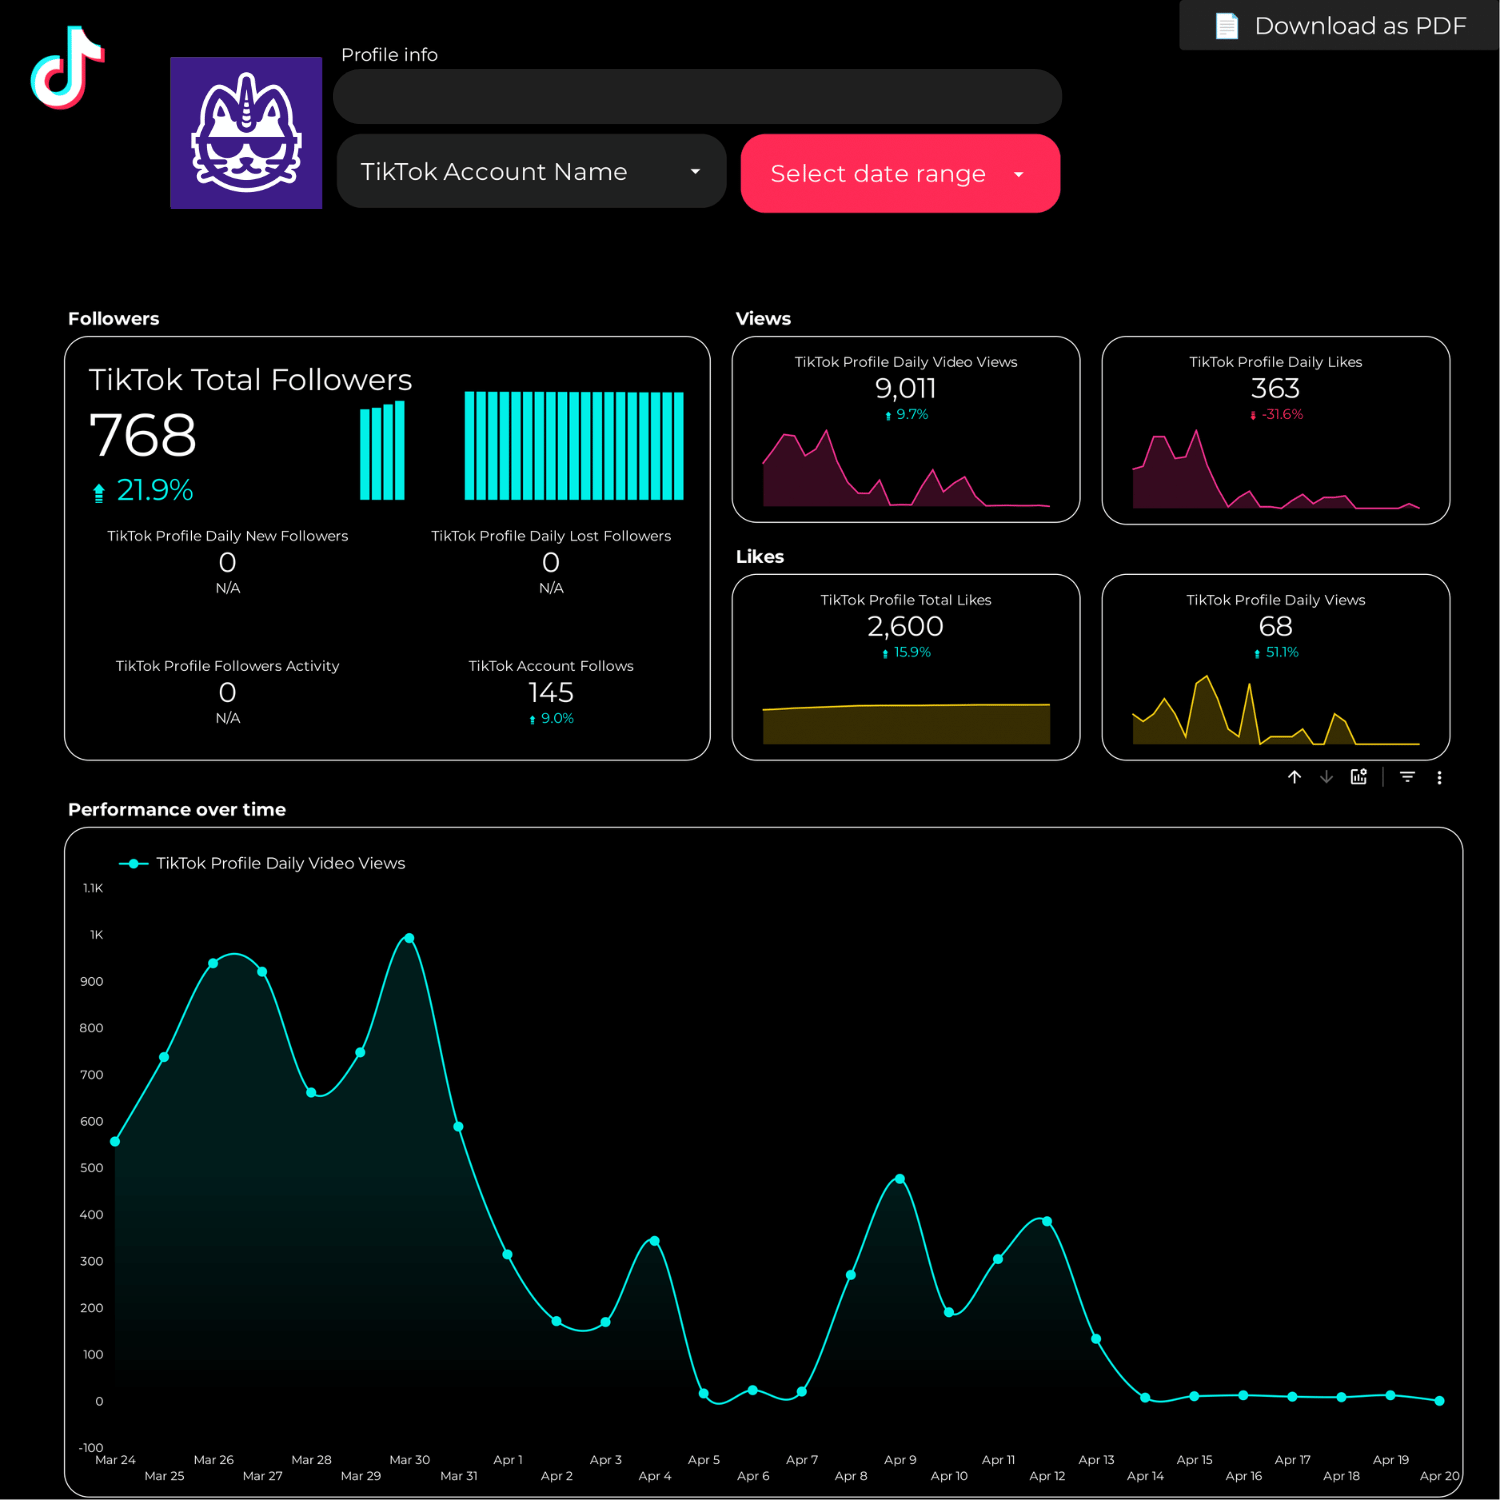
A TikTok report should include the following elements:
1. Impressions
2. Clicks
3. Ad Spend
4. Engagement Rate
5. Video Views
6. Followers
7. Likes
8. Shares
9. Comments
10. Campaign Name
11. Date
12. Ad ID
13. Ad Name
14. Ad Group Name
15. Ad Group ID
16. Campaign ID
17. Region
18. Device Type
19. Age Group
These metrics provide a comprehensive overview of the performance and reach of TikTok campaigns.
To analyze TikTok data, focus on key metrics such as impressions, clicks, ad spend, engagement rate, video views, followers, likes, shares, and comments. Evaluate these metrics to understand audience interaction and campaign performance. Additionally, consider campaign-specific details like campaign name, date, ad ID, ad name, ad group name, ad group ID, campaign ID, region, device type, and age group to gain insights into demographic and regional performance. Use this data to optimize content and advertising strategies on TikTok.
To build a TikTok dashboard, follow these steps:
1. **Define Objectives**: Determine what you want to achieve with the dashboard, such as tracking engagement, ad performance, or audience growth.
2. **Select Metrics**: Choose relevant metrics like Impressions, Clicks, Ad Spend, Engagement Rate, Video Views, Followers, Likes, Shares, and Comments.
3. **Data Collection**: Use TikTok’s API or third-party tools to gather data on the selected metrics.
4. **Data Organization**: Structure the data by Campaign Name, Date, Ad ID, Ad Name, Ad Group Name, Ad Group ID, Campaign ID, Region, Device Type, and Age Group.
5. **Visualization Tools**: Use tools like Tableau, Power BI, or Google Data Studio to create visual representations of the data.
6. **Design the Dashboard**: Arrange the visualizations in a user-friendly layout, ensuring key metrics are easily accessible.
7. **Test and Iterate**: Test the dashboard for accuracy and usability, and make necessary adjustments based on feedback.
8. **Regular Updates**: Ensure the dashboard is updated regularly to reflect the latest data and insights.
A TikTok dashboard is a tool used to track and analyze various metrics related to TikTok performance. It typically includes data on impressions, clicks, ad spend, engagement rate, video views, followers, likes, shares, and comments. Additionally, it may provide insights into campaign details such as campaign name, date, ad ID, ad name, ad group name, ad group ID, campaign ID, region, device type, and age group. This dashboard helps users understand the effectiveness of their TikTok content and advertising efforts.
Can I download this template in PDF?


 Impressions
 Ad Spend