A Meta Ads report should include the following elements:
1. Campaign Name
2. Campaign ID
3. Ad Set Name
4. Ad Set ID
5. Ad Name
6. Ad ID
7. Date
8. Objective
9. Placement
10. Impressions
11. Reach
12. Frequency
13. Clicks
14. CTR (Click-Through Rate)
15. CPC (Cost Per Click)
16. CPM (Cost Per Thousand Impressions)
17. Ad Spend
18. Conversions
19. Conversion Rate
These metrics provide a comprehensive overview of the performance and effectiveness of your Meta Ads campaigns.
To analyze Meta Ads data, focus on key metrics:
1. **Impressions**: Measure how often your ads are shown.
2. **Clicks**: Track the number of times users click on your ads.
3. **Ad Spend**: Monitor the total amount spent on ads.
4. **CTR (Click-Through Rate)**: Calculate by dividing clicks by impressions to assess ad effectiveness.
5. **CPC (Cost Per Click)**: Determine the cost for each click.
6. **CPM (Cost Per Mille)**: Calculate the cost per 1,000 impressions.
7. **Reach**: Count the number of unique users who see your ads.
8. **Frequency**: Measure how often the same user sees your ad.
9. **Conversions**: Track actions taken by users after clicking your ad.
10. **Conversion Rate**: Calculate by dividing conversions by clicks to evaluate ad performance.
Analyze these metrics over time and across different campaigns, ad sets, and ads to identify trends, optimize performance, and achieve your advertising objectives.
To build a Meta Ads dashboard, follow these steps:
1. **Data Collection**: Use Meta’s Ads Manager or API to collect data on key metrics such as Impressions, Clicks, Ad Spend, CTR, CPC, CPM, Reach, Frequency, Conversions, and Conversion Rate.
2. **Data Organization**: Organize the data by Campaign Name, Ad Set Name, Ad Name, and their respective IDs. Include additional fields like Date, Objective, and Placement for detailed analysis.
3. **Visualization Tool**: Choose a visualization tool like Google Data Studio, Tableau, or Power BI to create the dashboard.
4. **Dashboard Design**: Design the dashboard to display key metrics and trends. Use charts and graphs to visualize data such as:
– Line charts for trends over time (e.g., Impressions, Clicks).
– Bar charts for comparing performance across campaigns or ad sets.
– Pie charts for distribution of ad spend or conversions by objective.
5. **Interactivity**: Add filters and interactive elements to allow users to drill down into specific campaigns, ad sets, or time periods.
6. **Regular Updates**: Ensure the dashboard is updated regularly with the latest data to provide accurate insights.
By following these steps, you can create a comprehensive Meta Ads dashboard to monitor and optimize your advertising performance.
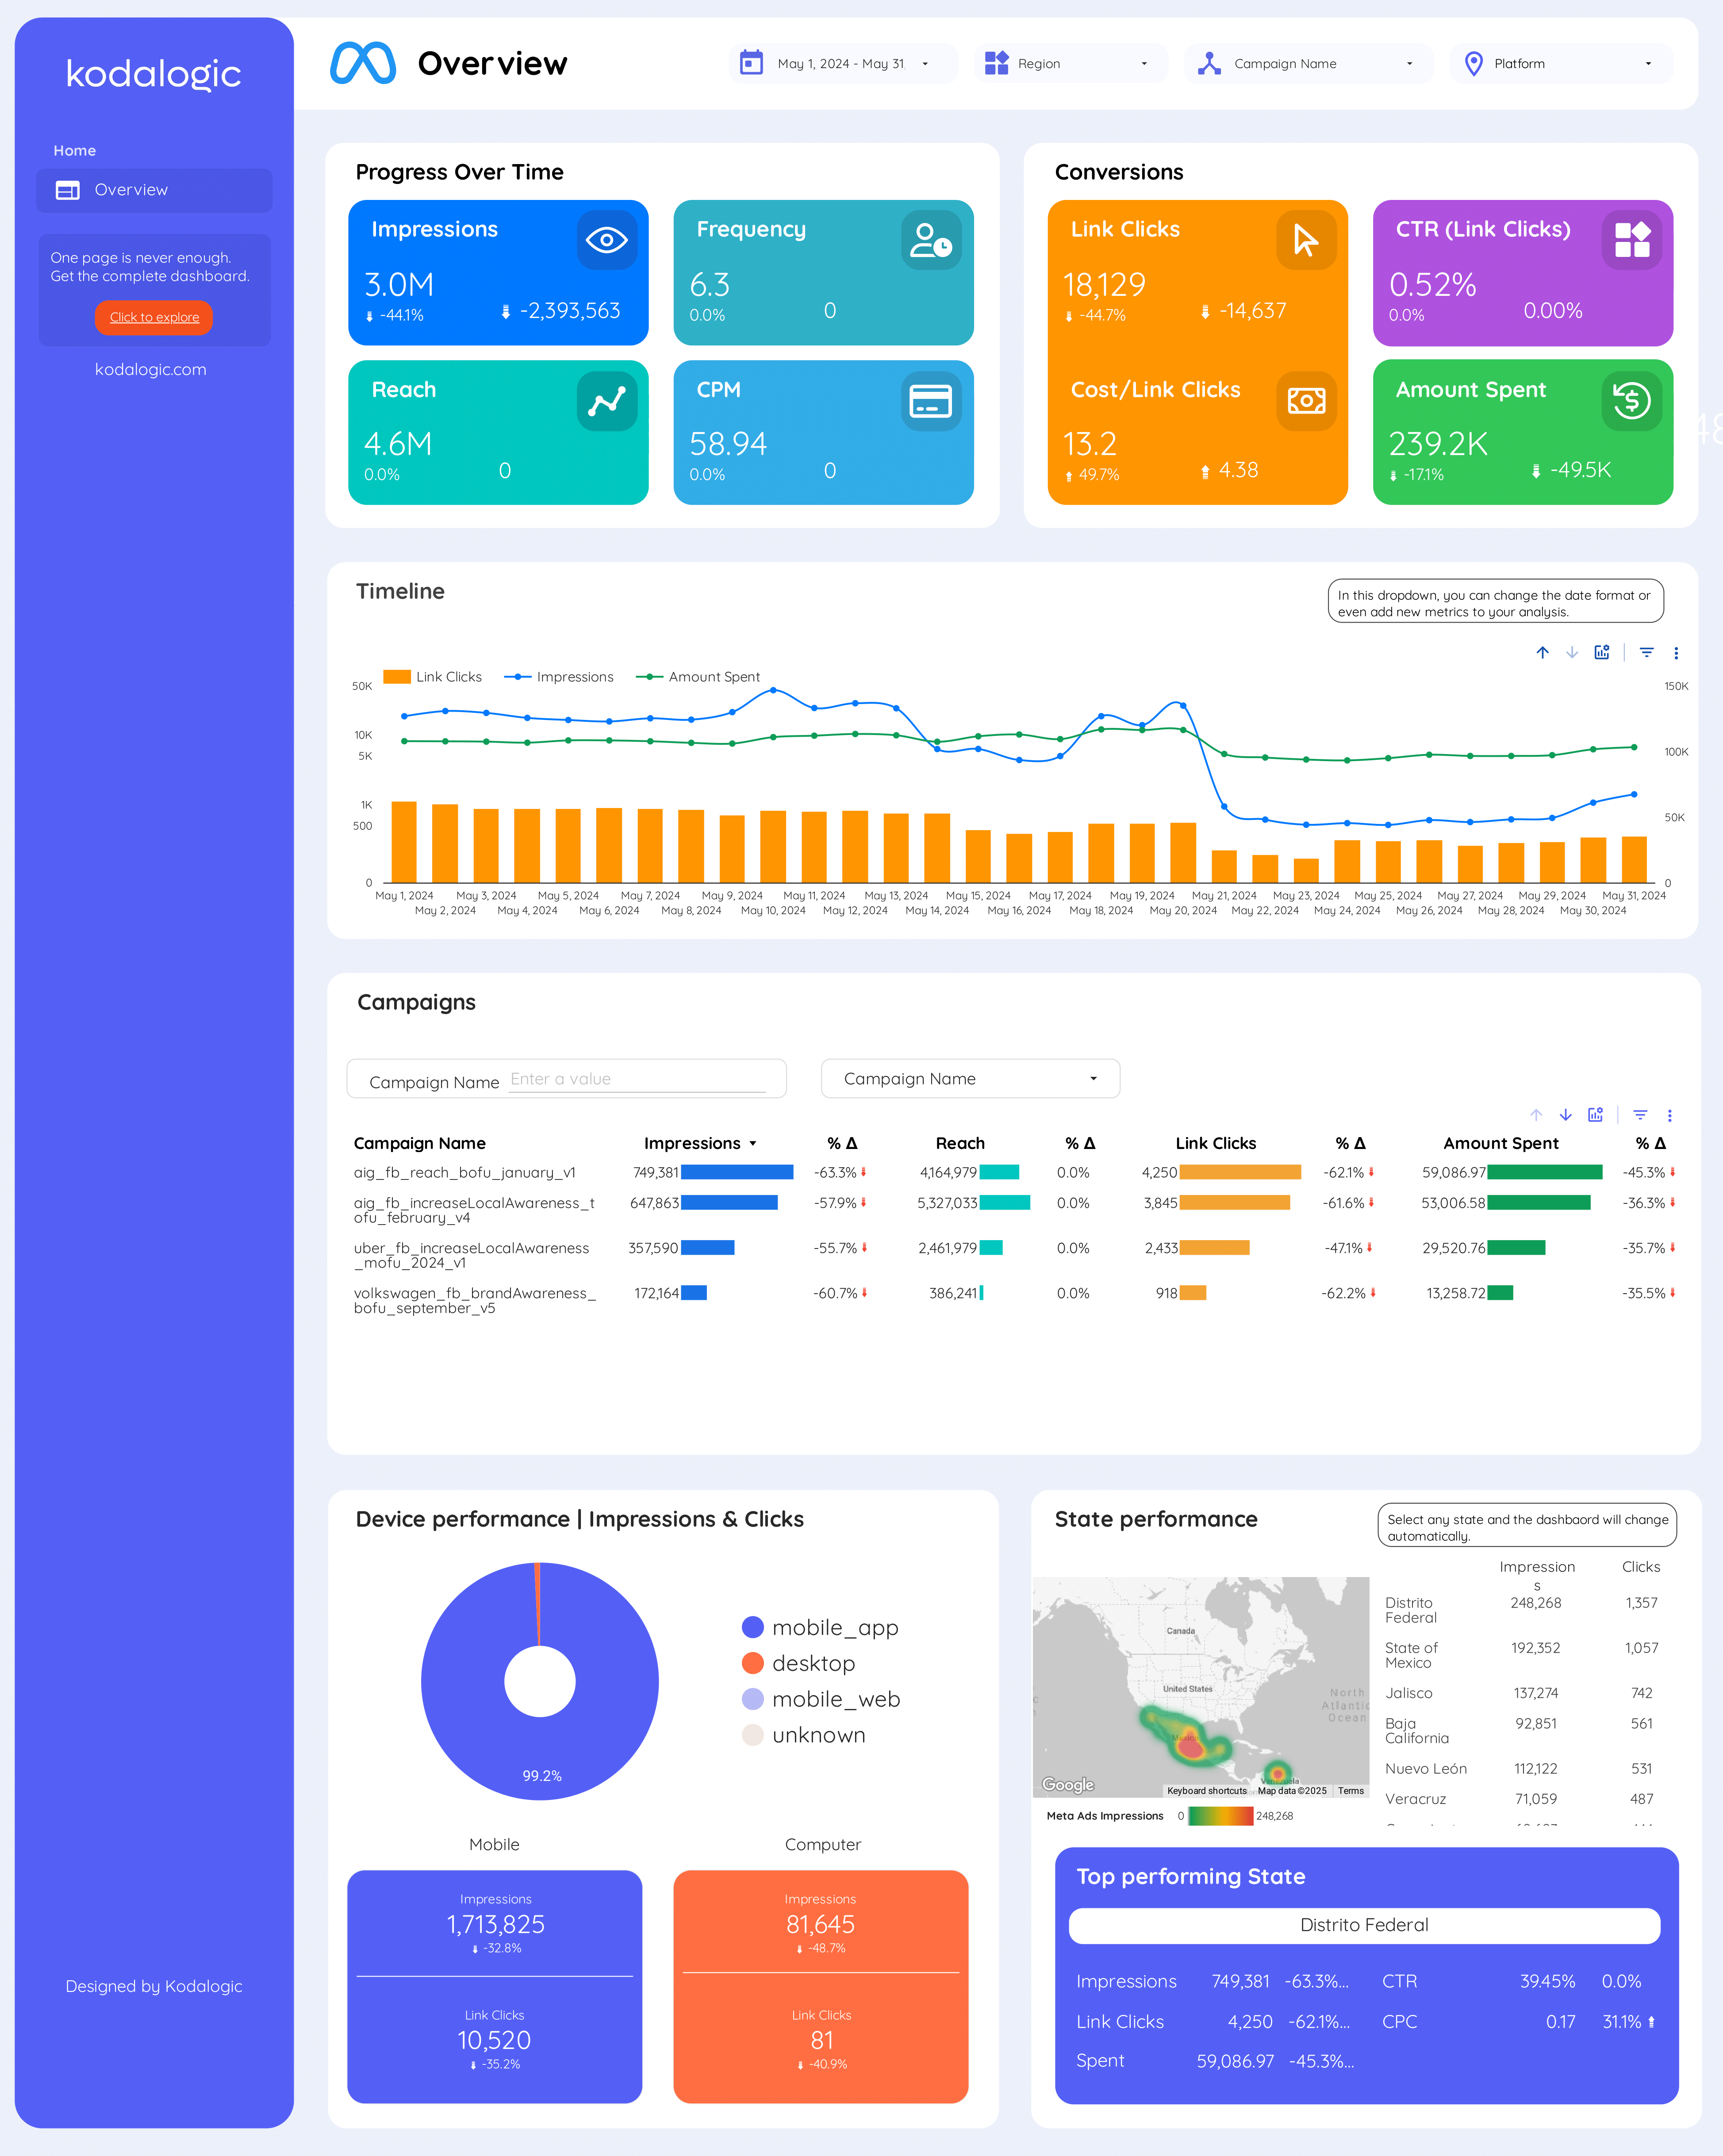
A Meta Ads dashboard is a tool used to track and analyze the performance of advertising campaigns on Meta platforms, such as Facebook. It provides key metrics like impressions, clicks, ad spend, click-through rate (CTR), cost per click (CPC), cost per thousand impressions (CPM), reach, frequency, conversions, and conversion rate. The dashboard helps advertisers monitor and optimize their campaigns by offering insights into campaign names, ad IDs, ad set names, campaign objectives, and placements.
Can I download this template in PDF?


 Impressions
 Ad Spend