A Facebook Ads report should include a breakdown of metrics by visibility, such as impressions and reach, engagement metrics like likes, comments, and shares, and conversion metrics such as click-through rate and conversion rate. The data should be segmented by campaign, channel, audience, content, objective, and date. For example, provide information on the performance of a specific campaign targeting a specific audience on a specific channel, with metrics for each objective and content variation, measured over a specific timeframe.
To analyze Facebook Ads data, first choose metrics such as reach, impressions, click-through rates (visibility), likes, comments, shares (engagement), and conversions (conversion metrics). Break them down into these three categories. Add context by comparing costs, date ranges, and goals. Compare rates with industry benchmarks. Segment data by campaign (e.g. ad campaign A vs. B), channel (e.g. Facebook vs. Instagram), audience (e.g. age groups), content (e.g. image vs. video), objective (e.g. brand awareness vs. lead generation), and date. For example, compare the reach of campaign A on Facebook vs. Instagram to identify which channel performs better in terms of visibility.
To build a Facebook Ads dashboard, 1) connect your Facebook Ads account and any other relevant data sources. 2) Select metrics such as click-through rate, cost per click, and conversion rate to monitor performance. 3) Segment your data by campaign, channel, audience, product, customer content, objective, and date to gain a comprehensive understanding. 4) Add filters or buttons for metrics like age, gender, or location to make your report interactive. 5) Share your dashboard via PDF, scheduled emails, or links for easy access and review.
A Facebook Ads dashboard is a tool that visually displays key performance metrics related to Facebook advertising campaigns. It is significant for businesses as it helps them track their ad performance, optimize strategies, and make data-driven decisions. Tools like Looker Studio are commonly used to create such dashboards, which typically include elements like cost per click, click-through rate, conversion rate, and return on ad spend. Real-time data monitoring is crucial as it allows businesses to respond quickly to changes and trends. For learning how to create a marketing dashboard using Looker Studio, you can refer to our YouTube channel: https://www.youtube.com/@porter.metrics.
Can I download this template in PDF?


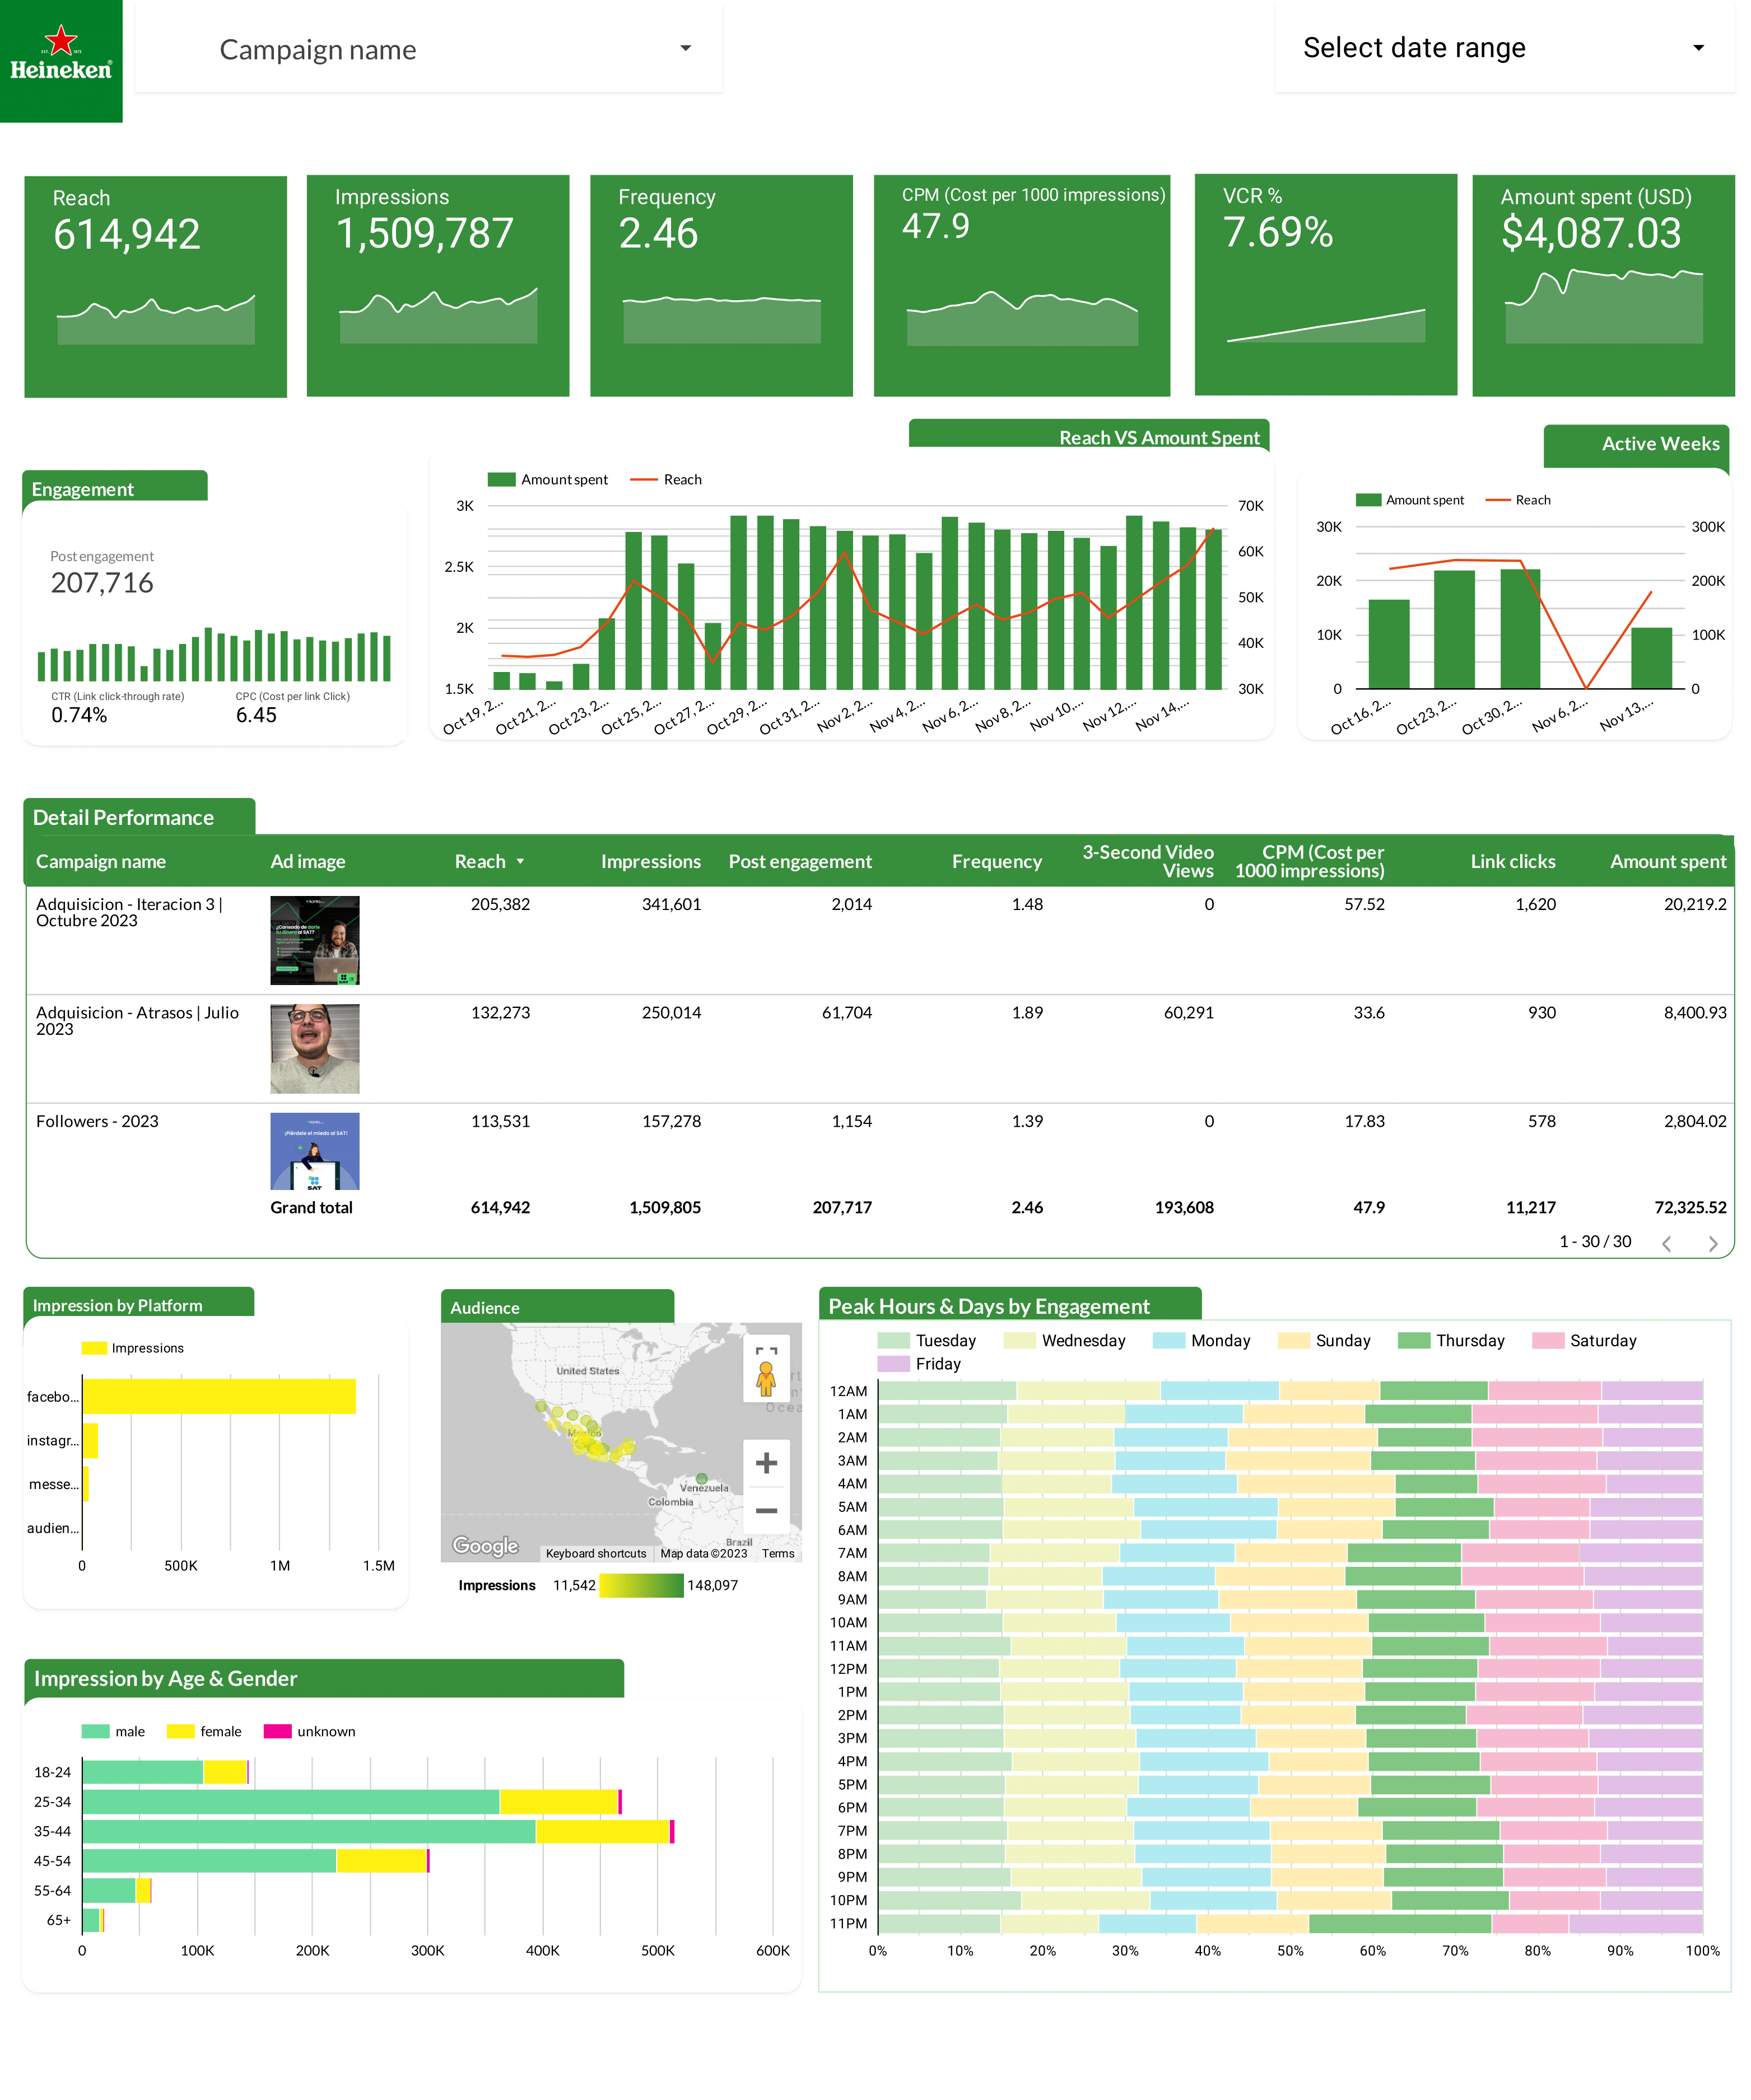
 Impressions
 Ad Spend