Shopify customer & cohort analysis dashboard template for Google Sheets

Understand your customers with metrics like new vs. returning customers, customer lifetime value, and average order value. Get insights with a cohort analysis to track customer retention and purchasing patterns over time.

By Porter

This template is built by the same marketers behind all our tutorials, support, and our template gallery.

Data sources included

+40,000 marketers have downloaded our dashboards

Questions you can answer using this Shopify dashboard template

  • What are the total sales for first-time vs. returning customers?
  • How many total orders came from first-time vs. returning customers?
  • What is the average order value (AOV) for first-time and returning customers?
  • What are the total net sales for the period?
  • How have sales and orders trended month-to-month?
  • How has the AOV fluctuated by month?
  • What is the breakdown of first-time vs. returning customer sales and orders over time?
  • Which months saw the highest and lowest sales?
  • How does customer retention look based on cohort analysis?
  • How many customers from each cohort (based on sign-up month) placed orders in subsequent months?
  • Which cohort of customers has the highest repeat purchase rate?

How to set up this Google Sheets template?

Copy the Shopify customer & cohort analysis dashboard template for Google Sheets in one click and automate your reporting

Follow these steps:


  • Step 1: Make a copy of the template.

  • Step 2: Download the extension and authorize your profile.

  • Step 3: Choose the accounts you want to pull data from.

  • Step 4: Use our prebuilt queries or build one from scratch to automate your data collection. Alternatively, you can input data manually.

  • Step 5: Set up automatic refresh to keep your dashboard updated.


Metrics and dimensions included

Customize the template’s metrics and dimensions as you like. See all available Shopify fields

Metrics

  • Sales

    • Total Sales
    • Net Sales
    • Gross Sales
    • Average Order Value (AOV)

  • Customizable charts

    • Total orders
    • AOV

Dimensions

  • Date

    • Order creation date
    • Customer creation date

  • Customer type

    • New customer
    • Returning customer

  • Customer information

    • Customer ID
    • Customer email

Features

You can customize your marketing reports directly in Google Sheets with your logo, colors, and branding.
Set up email alerts using conditional notifications when a cell value changes.
Edit all charts and change style values, and then paste them on your Google Slides so they can auto sync.

Utilize functions like SUMIF, VLOOKUP, IF, and ARRAYFORMULA to calculate key metrics like CPA, ROAS, and CTR, automating calculations and combining data fields.

Pull your historical marketing data automatically using our Google Sheets marketing extension.

Filter by date, campaign, channel, and more to get the insights you need.
Set, track, and achieve marketing goals with real-time updates.
Set sync intervals to match your reporting needs, whether daily, weekly, or monthly.
Connect Google Analytics, Facebook Ads, Instagram, LinkedIn, and more to create a unified view of your marketing performance.

FAQs

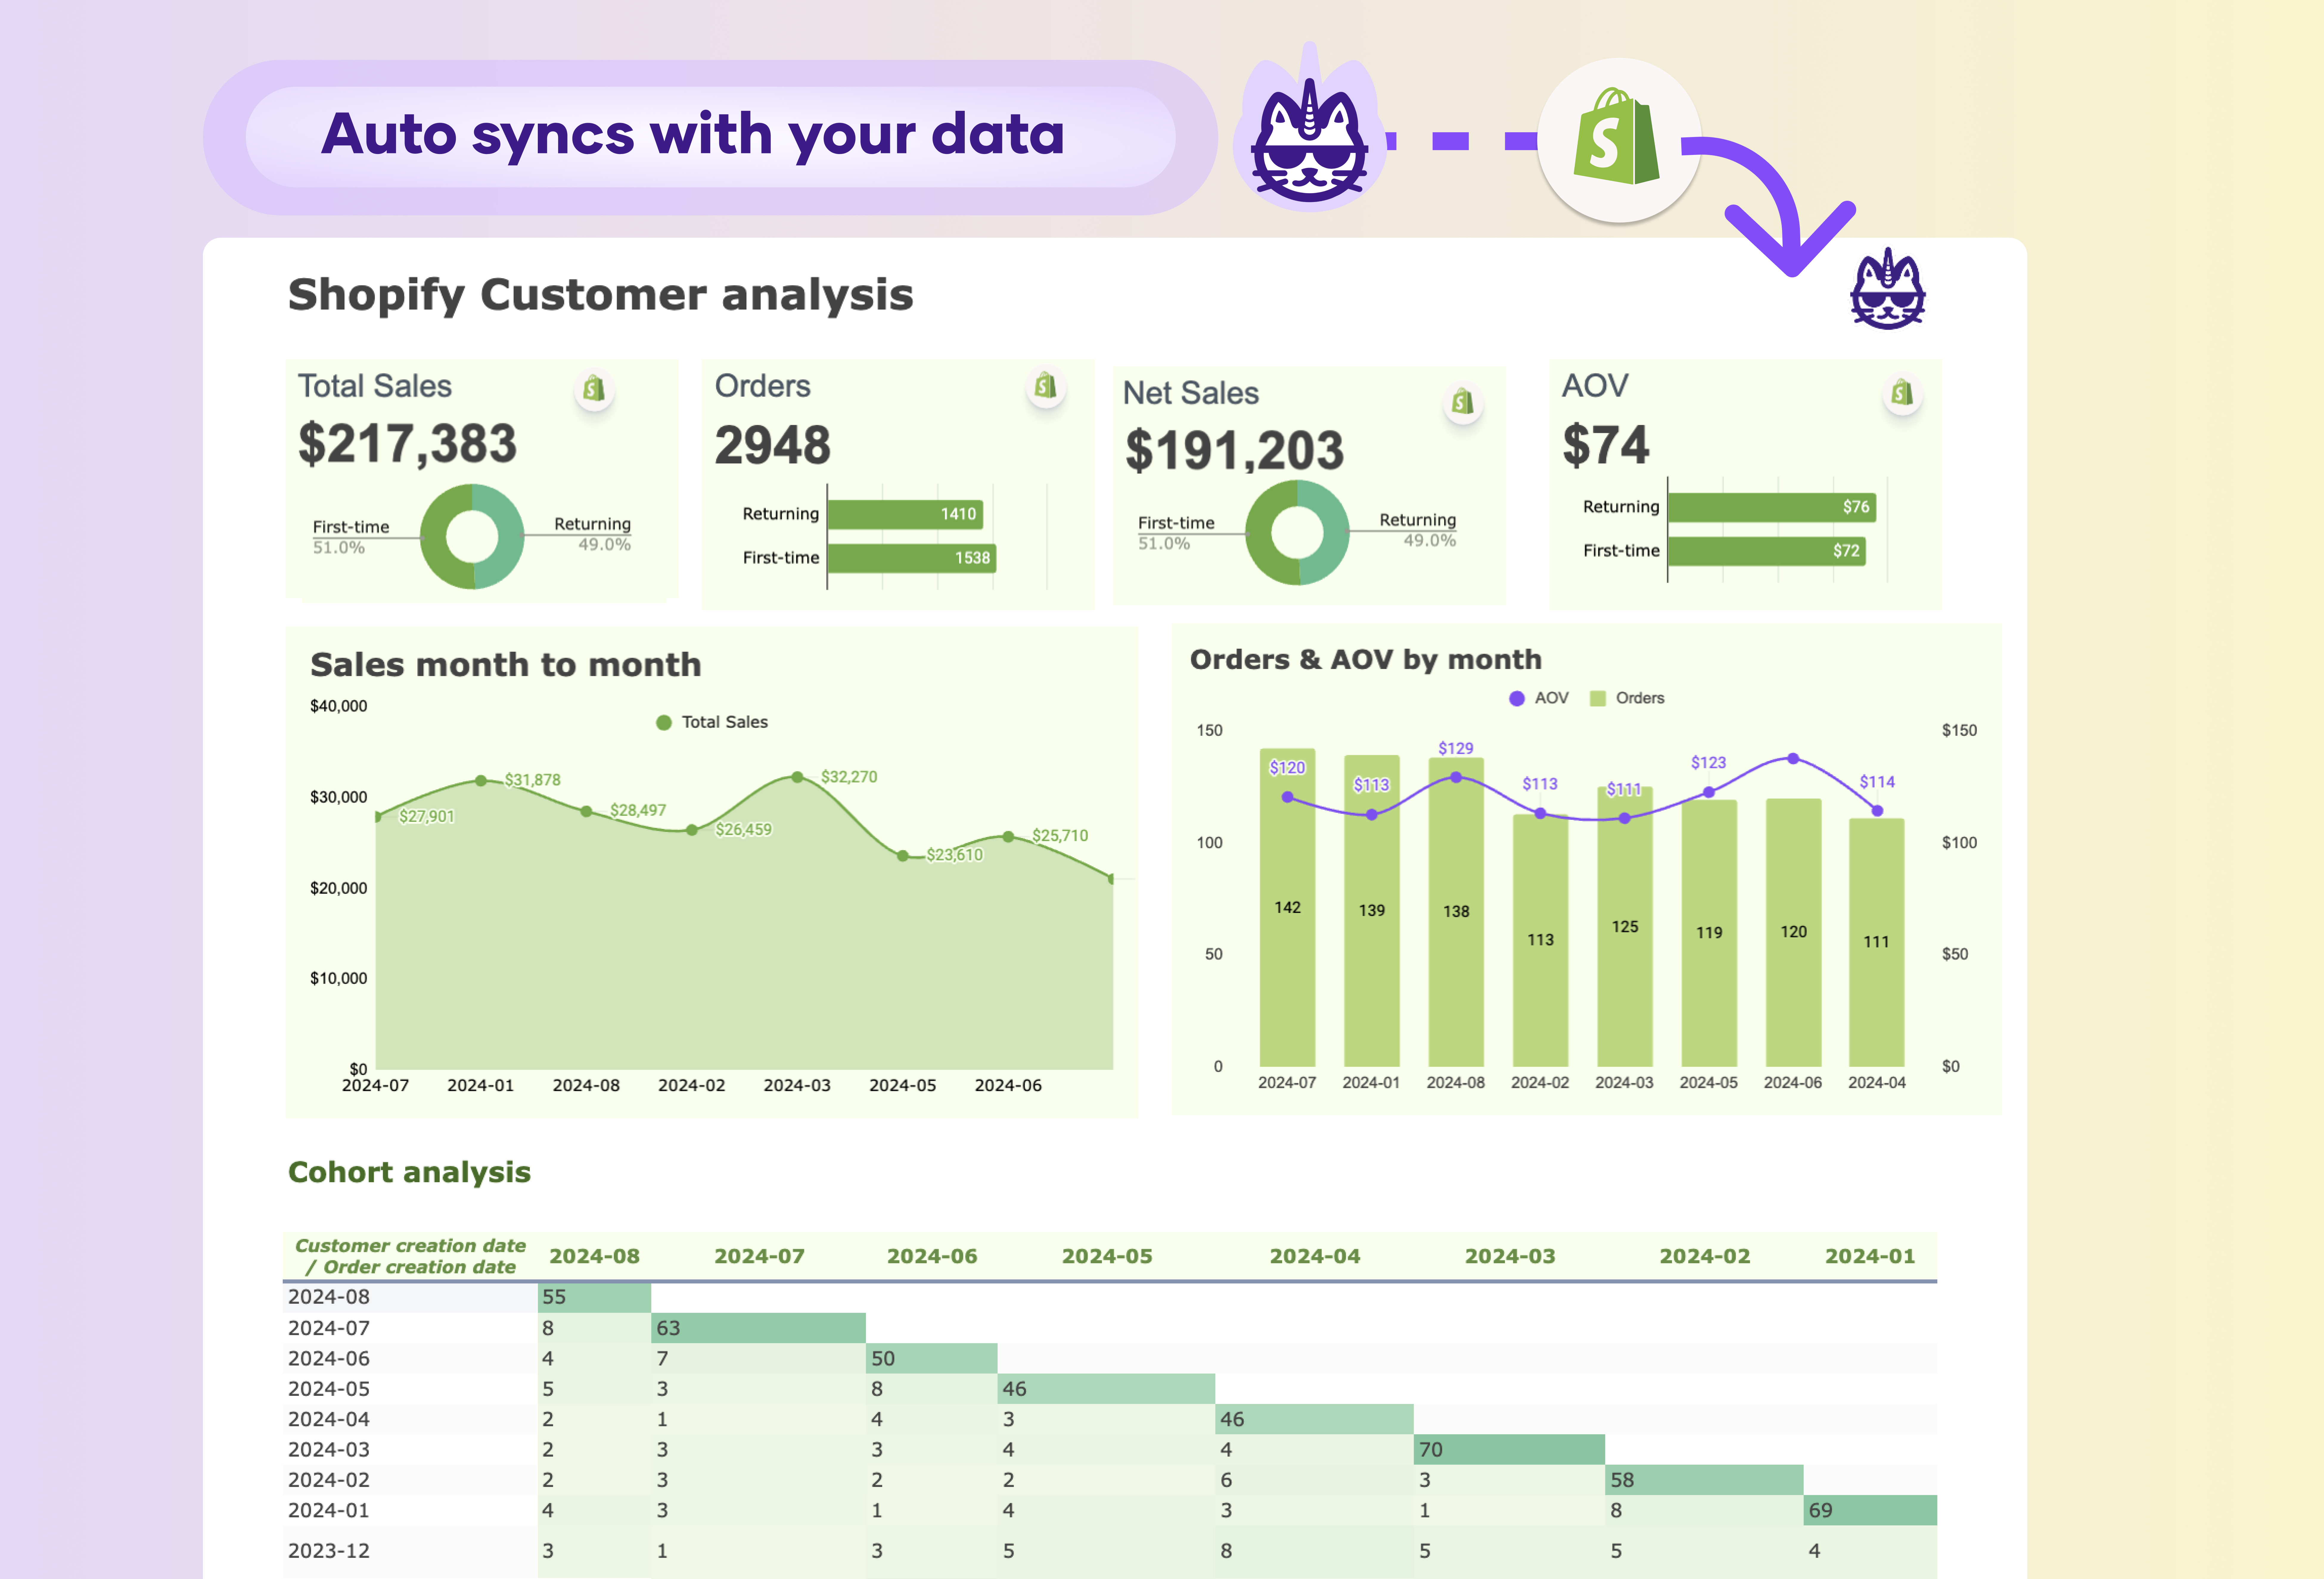
A Shopify customer & cohort analysis dashboard report should include key metrics such as Total Customers, New Customers, and Returning Customers to provide insights into customer acquisition and retention. Metrics like Customer Lifetime Value (CLTV) and Average Order Value (AOV) for first-time vs. returning customers are essential for understanding the long-term value of different customer segments. Cohort analysis, which groups customers by the time of their first purchase and tracks their purchasing behavior over time, is crucial for identifying trends in customer retention and repeat purchases.

Additionally, the dashboard should feature metrics like Customer Retention Rate and Churn Rate to measure the effectiveness of your retention strategies. Visualizations like cohort behavior charts and month-over-month customer trends help track changes in customer activity over time.

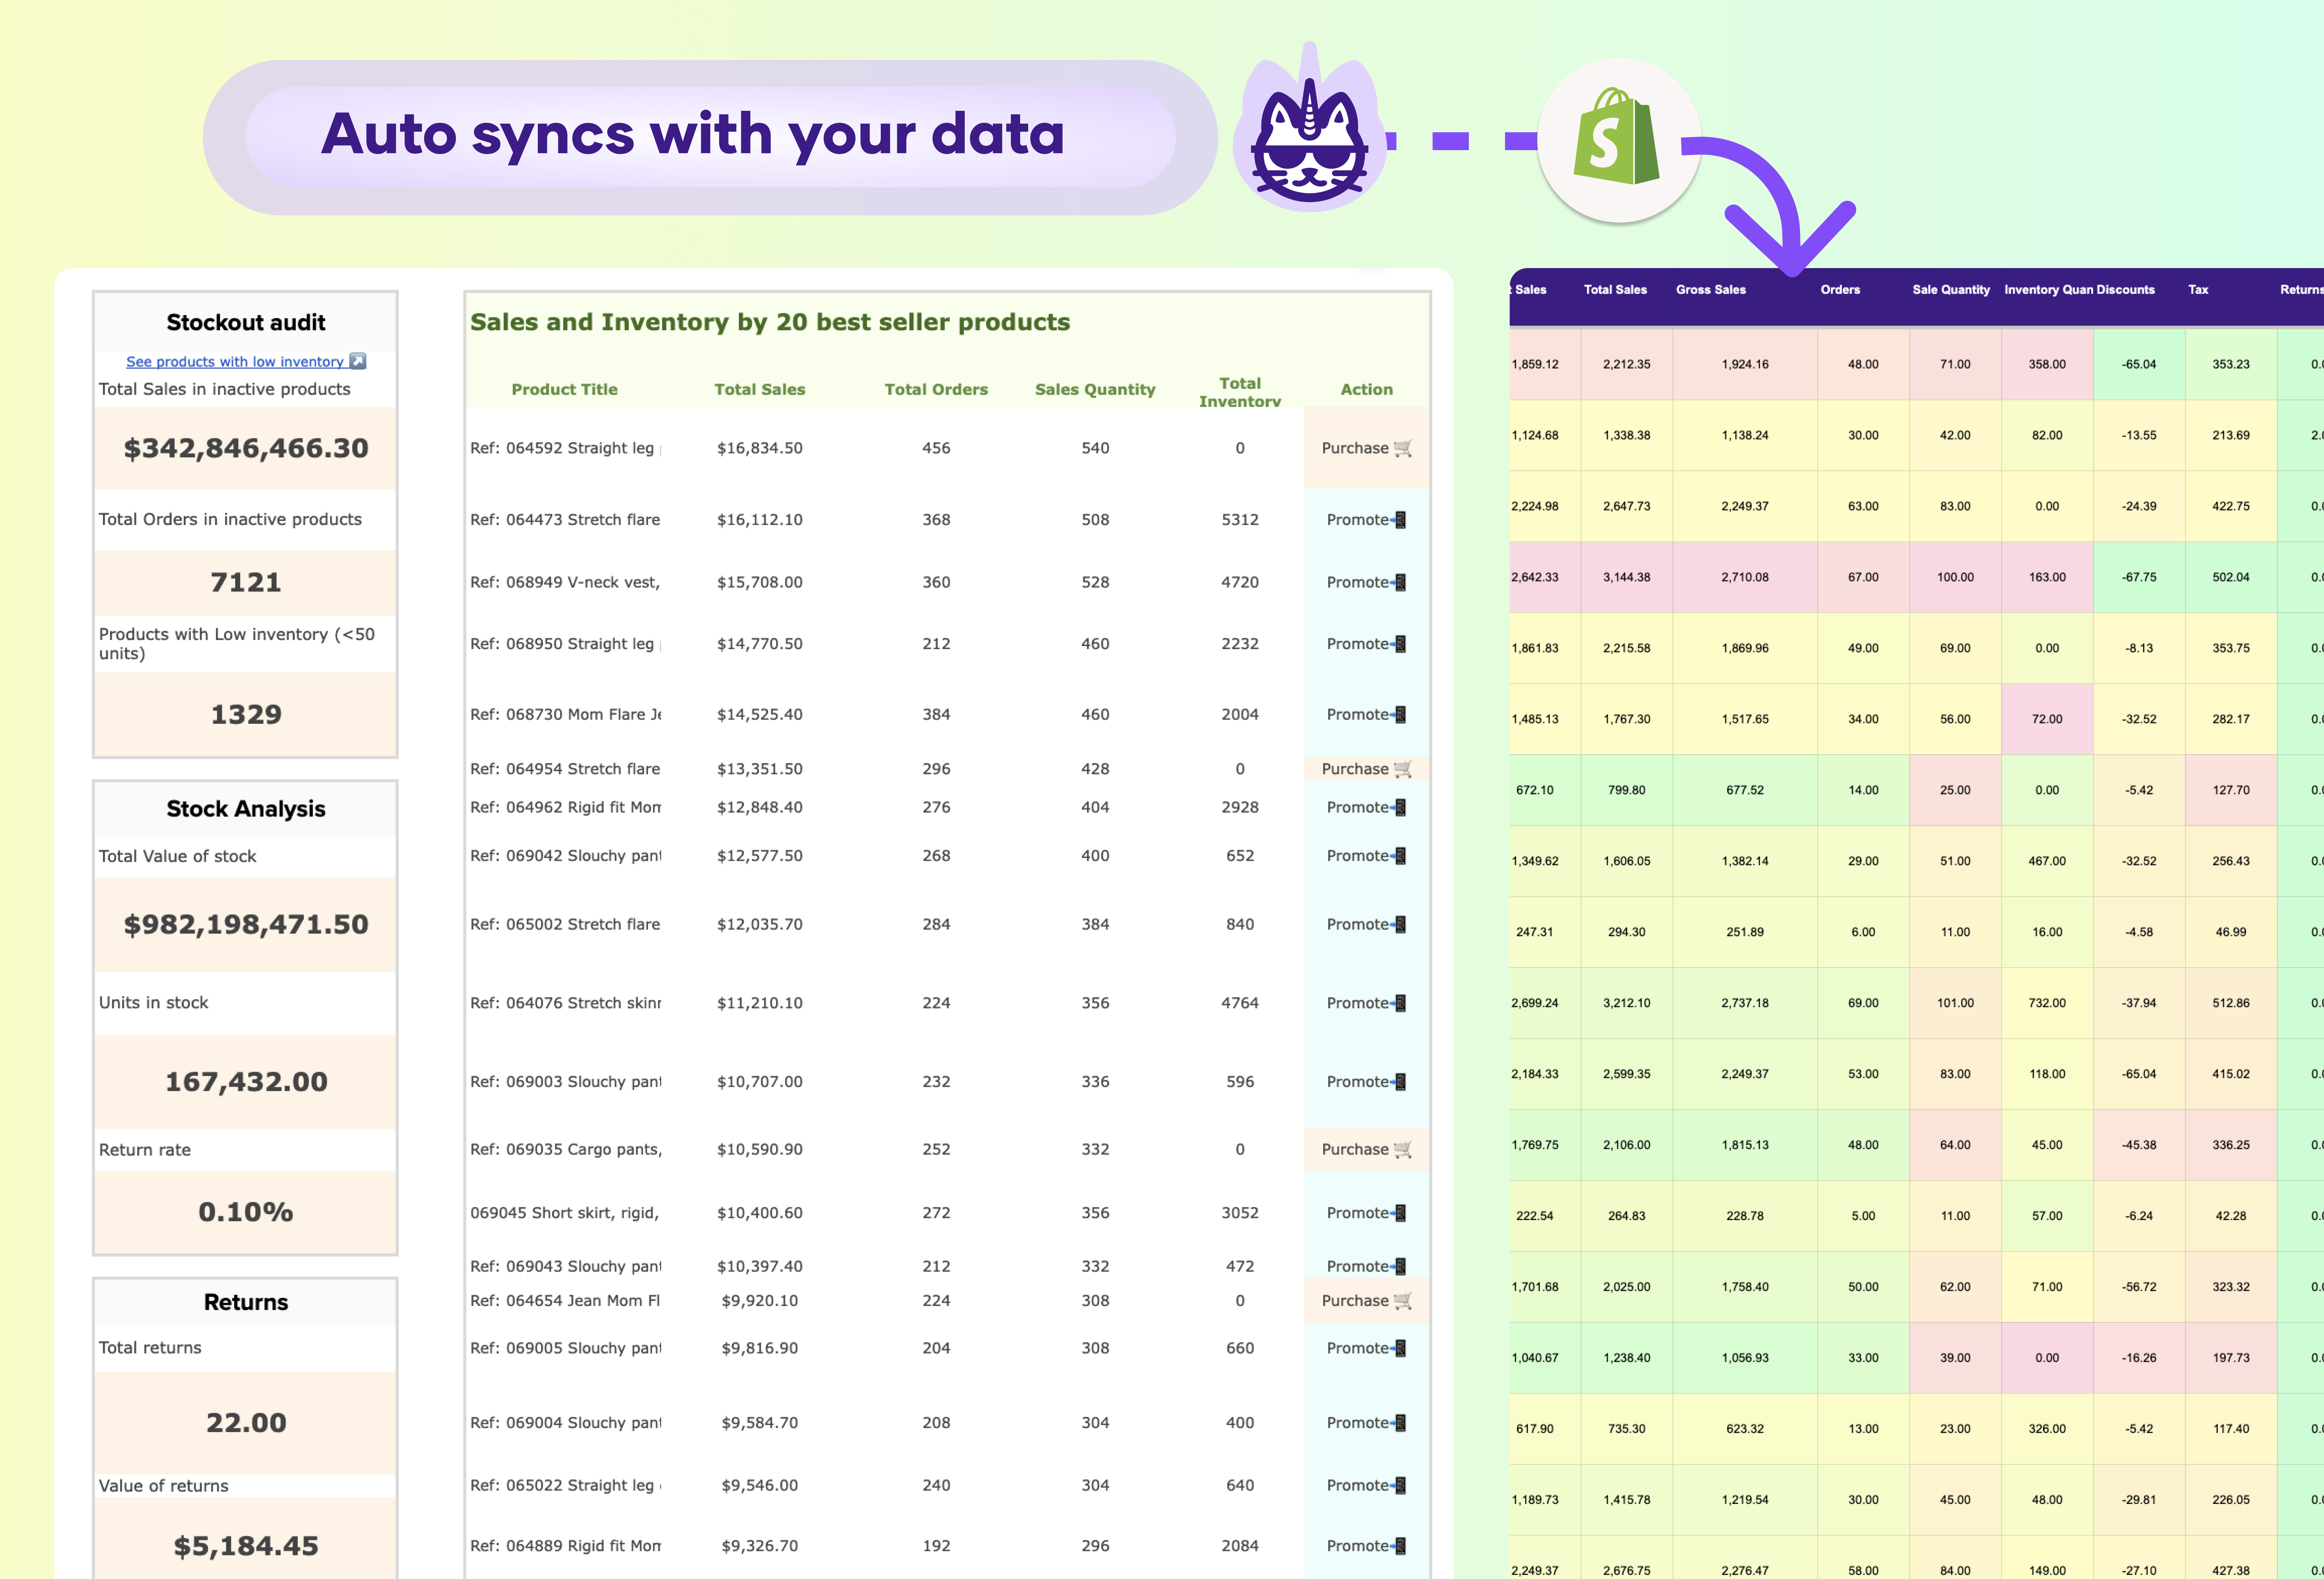
Also, include an auto-sync feature for real-time data updates from Shopify using Porter Metrics Google Sheets extension.

While this template is designed specifically for Shopify you can use Google Sheets’ multichannel connectors such as LinkedIn Ads, GA4 to integrate data from other marketing platforms. By combining insights from different sources, you can create a unified view of your overall marketing performance.

To set up email alerts, use the built-in notifications feature in Google Sheets. You can create custom rules to trigger email alerts based on specific conditions, such as when your actual spend exceeds the budget or when pacing percentages hit certain thresholds.

Yes, you can fully customize the charts in the dashboard. You can choose different chart types, adjust colors, fonts, and styles, add data labels, legends, and trendlines, and customize axes and gridlines to match your reporting needs.