A Inbound marketing report should include visibility metrics such as website traffic, engagement metrics like bounce rate and time on page, and conversion metrics such as lead generation and sales. Data should be segmented by campaign (e.g. PPC, email), channel (e.g. social media, organic search), audience (e.g. age, location), content (e.g. blog post, video), objective (e.g. brand awareness, lead generation), and date. For example, a report could show the number of leads generated from a specific email campaign targeting a particular audience segment.
To analyze inbound marketing data, 1) choose visibility metrics such as website traffic, social media reach, and email open rates; engagement metrics like time on site, social media comments, and email click-through rates; and conversion metrics including lead generation, sales, and customer acquisition. 2) Compare these metrics against the cost per acquisition, date range performance, campaign-specific goals, industry benchmark rates, and conversion rates. 3) Segment the data by campaign performance, channel effectiveness, audience engagement, content performance, specific objectives, and date-based trends. For example, compare the email open rates for different content types, or evaluate the website traffic by referral channel.
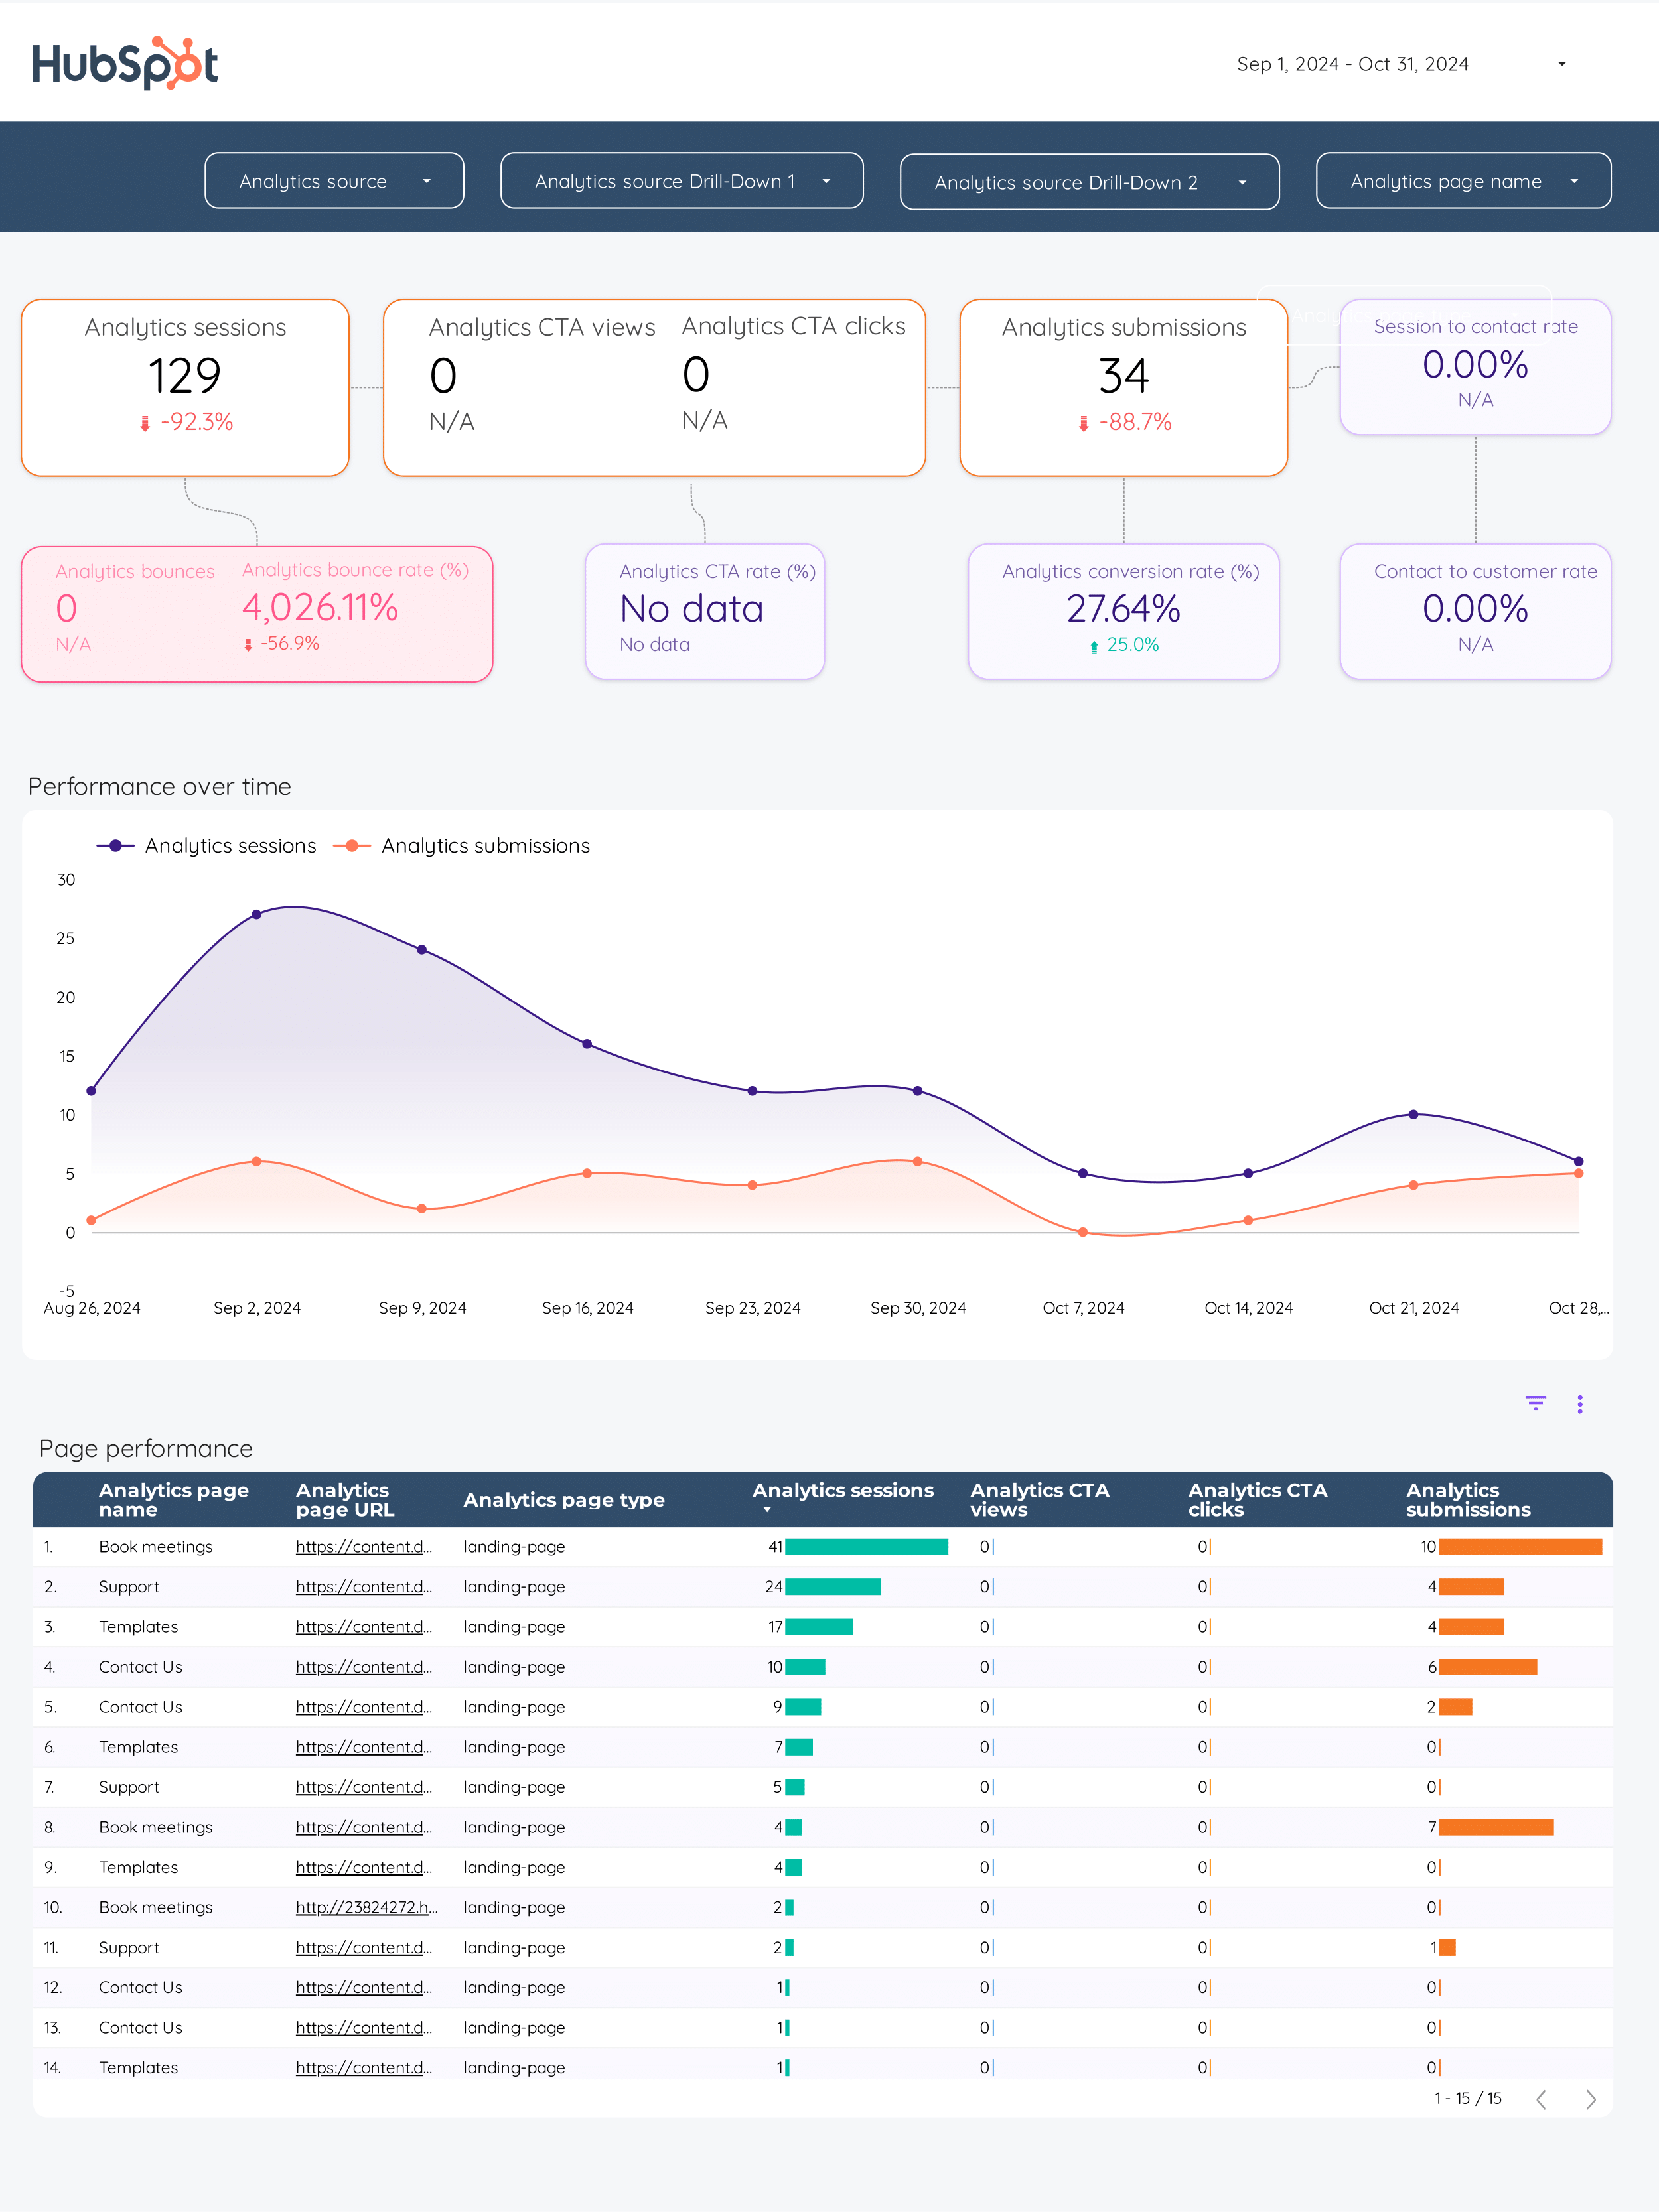
To build an inbound marketing dashboard, 1) connect your data and accounts such as Google Analytics, social media platforms, and CRM software. 2) Select metrics like website traffic, lead generation, conversion rates, and customer acquisition costs. 3) Segment data by campaign, channel (SEO, email, social media), audience demographics, product, customer content, objective, and date. 4) Add filters or buttons for real-time data manipulation and interactivity. 5) Share your dashboard via PDF, scheduled emails, or links for easy access and review.
An inbound marketing dashboard is a visual tool that displays key marketing metrics to track the performance of inbound marketing efforts. It is significant for businesses as it helps in making data-driven decisions, improving strategies, and measuring ROI. Tools like Looker Studio are commonly used to create these dashboards, which typically include elements like website traffic, lead conversion rates, SEO performance, and social media engagement. Real-time data monitoring is crucial as it allows for immediate response to trends or issues. For a detailed guide on creating a marketing dashboard using Looker Studio, visit our YouTube channel: https://www.youtube.com/@porter.metrics.


 HubSpot
 Impressions
 Conversion Rate
 CTR
CTR ROAS
ROAS Engagement Rate
 Followers
 Post Reach
 SEO Score