+40,000 marketers have downloaded our dashboards
100% custom charts
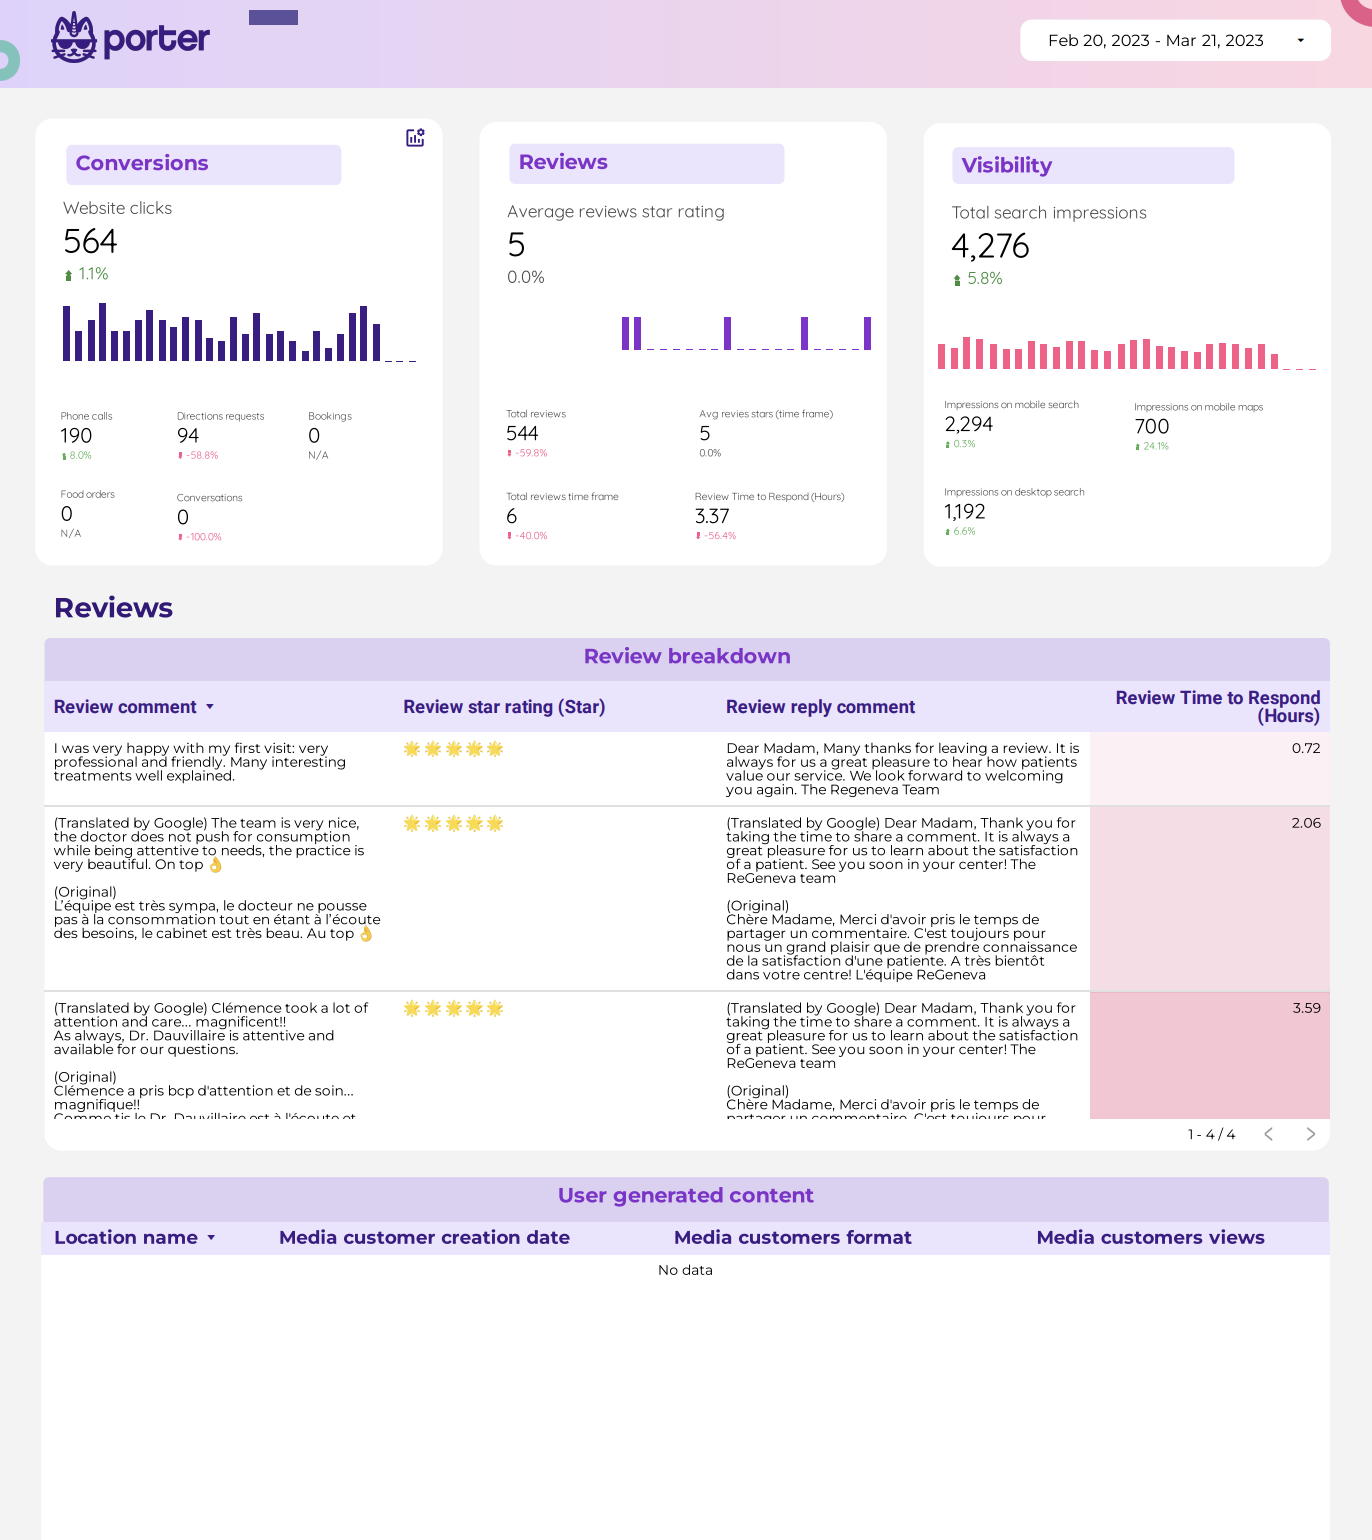
White-label
Custom metrics
All-time historical data
Schedule email alerts
Filters
Interactive
Goals
Data blending
To analyze data for a Content Marketing report, 1) choose visibility metrics like organic search traffic, impressions, and social media reach. Break engagement metrics down by user comments, shares, and time spent on page. For conversion metrics, consider lead generation, newsletter sign-ups, and sales. 2) add context by comparing against previous cost per click, date range, goals achieved, conversion rates, and industry benchmarks. For example, compare current cost per click to the past month or year. 3) Segment data by campaign (e.g., email campaign, social media campaign), channel (e.g., Facebook, Twitter), audience (e.g., age, gender), content type (e.g., blog post, video), objective (e.g., brand awareness, lead generation), and date.
A Content Marketing Dashboard is a visual tool that displays key metrics and data related to a company’s content marketing efforts. It is significant for businesses as it helps in tracking performance, identifying trends, and making data-driven decisions. Tools like Looker Studio are commonly used to create these dashboards, which typically include elements like traffic sources, engagement metrics, conversion rates, and ROI. Real-time data monitoring is crucial as it allows for immediate response to changes and trends. For learning how to create a marketing dashboard using Looker Studio, visit our YouTube channel: https://www.youtube.com/@porter.metrics.

