A Google Analytics 4 acquisition report should include metrics such as conversion metrics like Conversions, Conversion rate, and User conversion rate; engagement metrics like Engaged sessions, Engagement rate, and Average engagement time per session; and visibility metrics like Sessions, Users, and New users.
Then, segment and filter this data by dimensions like Campaign ID, Campaign Name, Campaign Source, Session default channel group, Session medium, and Session source platform. Additionally, segment by time dimensions such as by hour, day, week, month, quarter, or year.
Once the data is ready, make sure to add buttons and filters to make your reports interactive, use custom colors and logos to make it white-label, and share via link, PDF, or email so your teams or clients can access it.
To analyze Google Analytics 4 acquisition data, follow these steps:
1) Define your use case: Determine if the analysis is for a client presentation, performance monitoring, or an ad hoc analysis.
2) Define your metrics: Choose relevant metrics such as revenue, cost, and funnel metrics like visibility (e.g., impressions, sessions), engagement (e.g., bounce rate, session duration), and conversion metrics (e.g., conversion rate, goal completions).
3) Add context: Compare these metrics over time, against objectives, or in relation to cost (efficiency metrics) and initial input (effectiveness metrics). For example, analyze how conversion rates have changed over the past quarter and compare them to your set goals.
4) Segment your data: Break down the data by channel (e.g., organic search, paid search), objective (e.g., lead generation, sales), campaign (e.g., summer sale, new product launch), product, and time (e.g., monthly, quarterly).
For instance, if you are analyzing the performance of a Google Ads campaign, you might look at the visibility metrics like impressions and clicks, engagement metrics such as click-through rate, and conversion metrics like the number of purchases. Add context by comparing these metrics to the campaign’s cost and objectives over the last month. Segment the data by different ad groups or keywords to identify which are performing best.
To build a Google Analytics 4 acquisition dashboard, start by connecting your Google Analytics 4 data to platforms like Google Sheets or Google Looker Studio. Then, choose metrics such as Conversions, Conversion rate, User conversion rate, Engaged sessions, Engagement rate, Average engagement time per session, Sessions, Users, and New users to fully map your funnel. Segment and break down your data by channel, campaign, audience, product, or objective, using dimensions such as Campaign ID, Campaign Name, Campaign Source, Session default channel group, Session medium, and Session source platform. The combination of these metrics and segmentation will help you spot trends and identify areas for optimization. Share your dashboard via PDF, scheduled emails, or links for easy access.
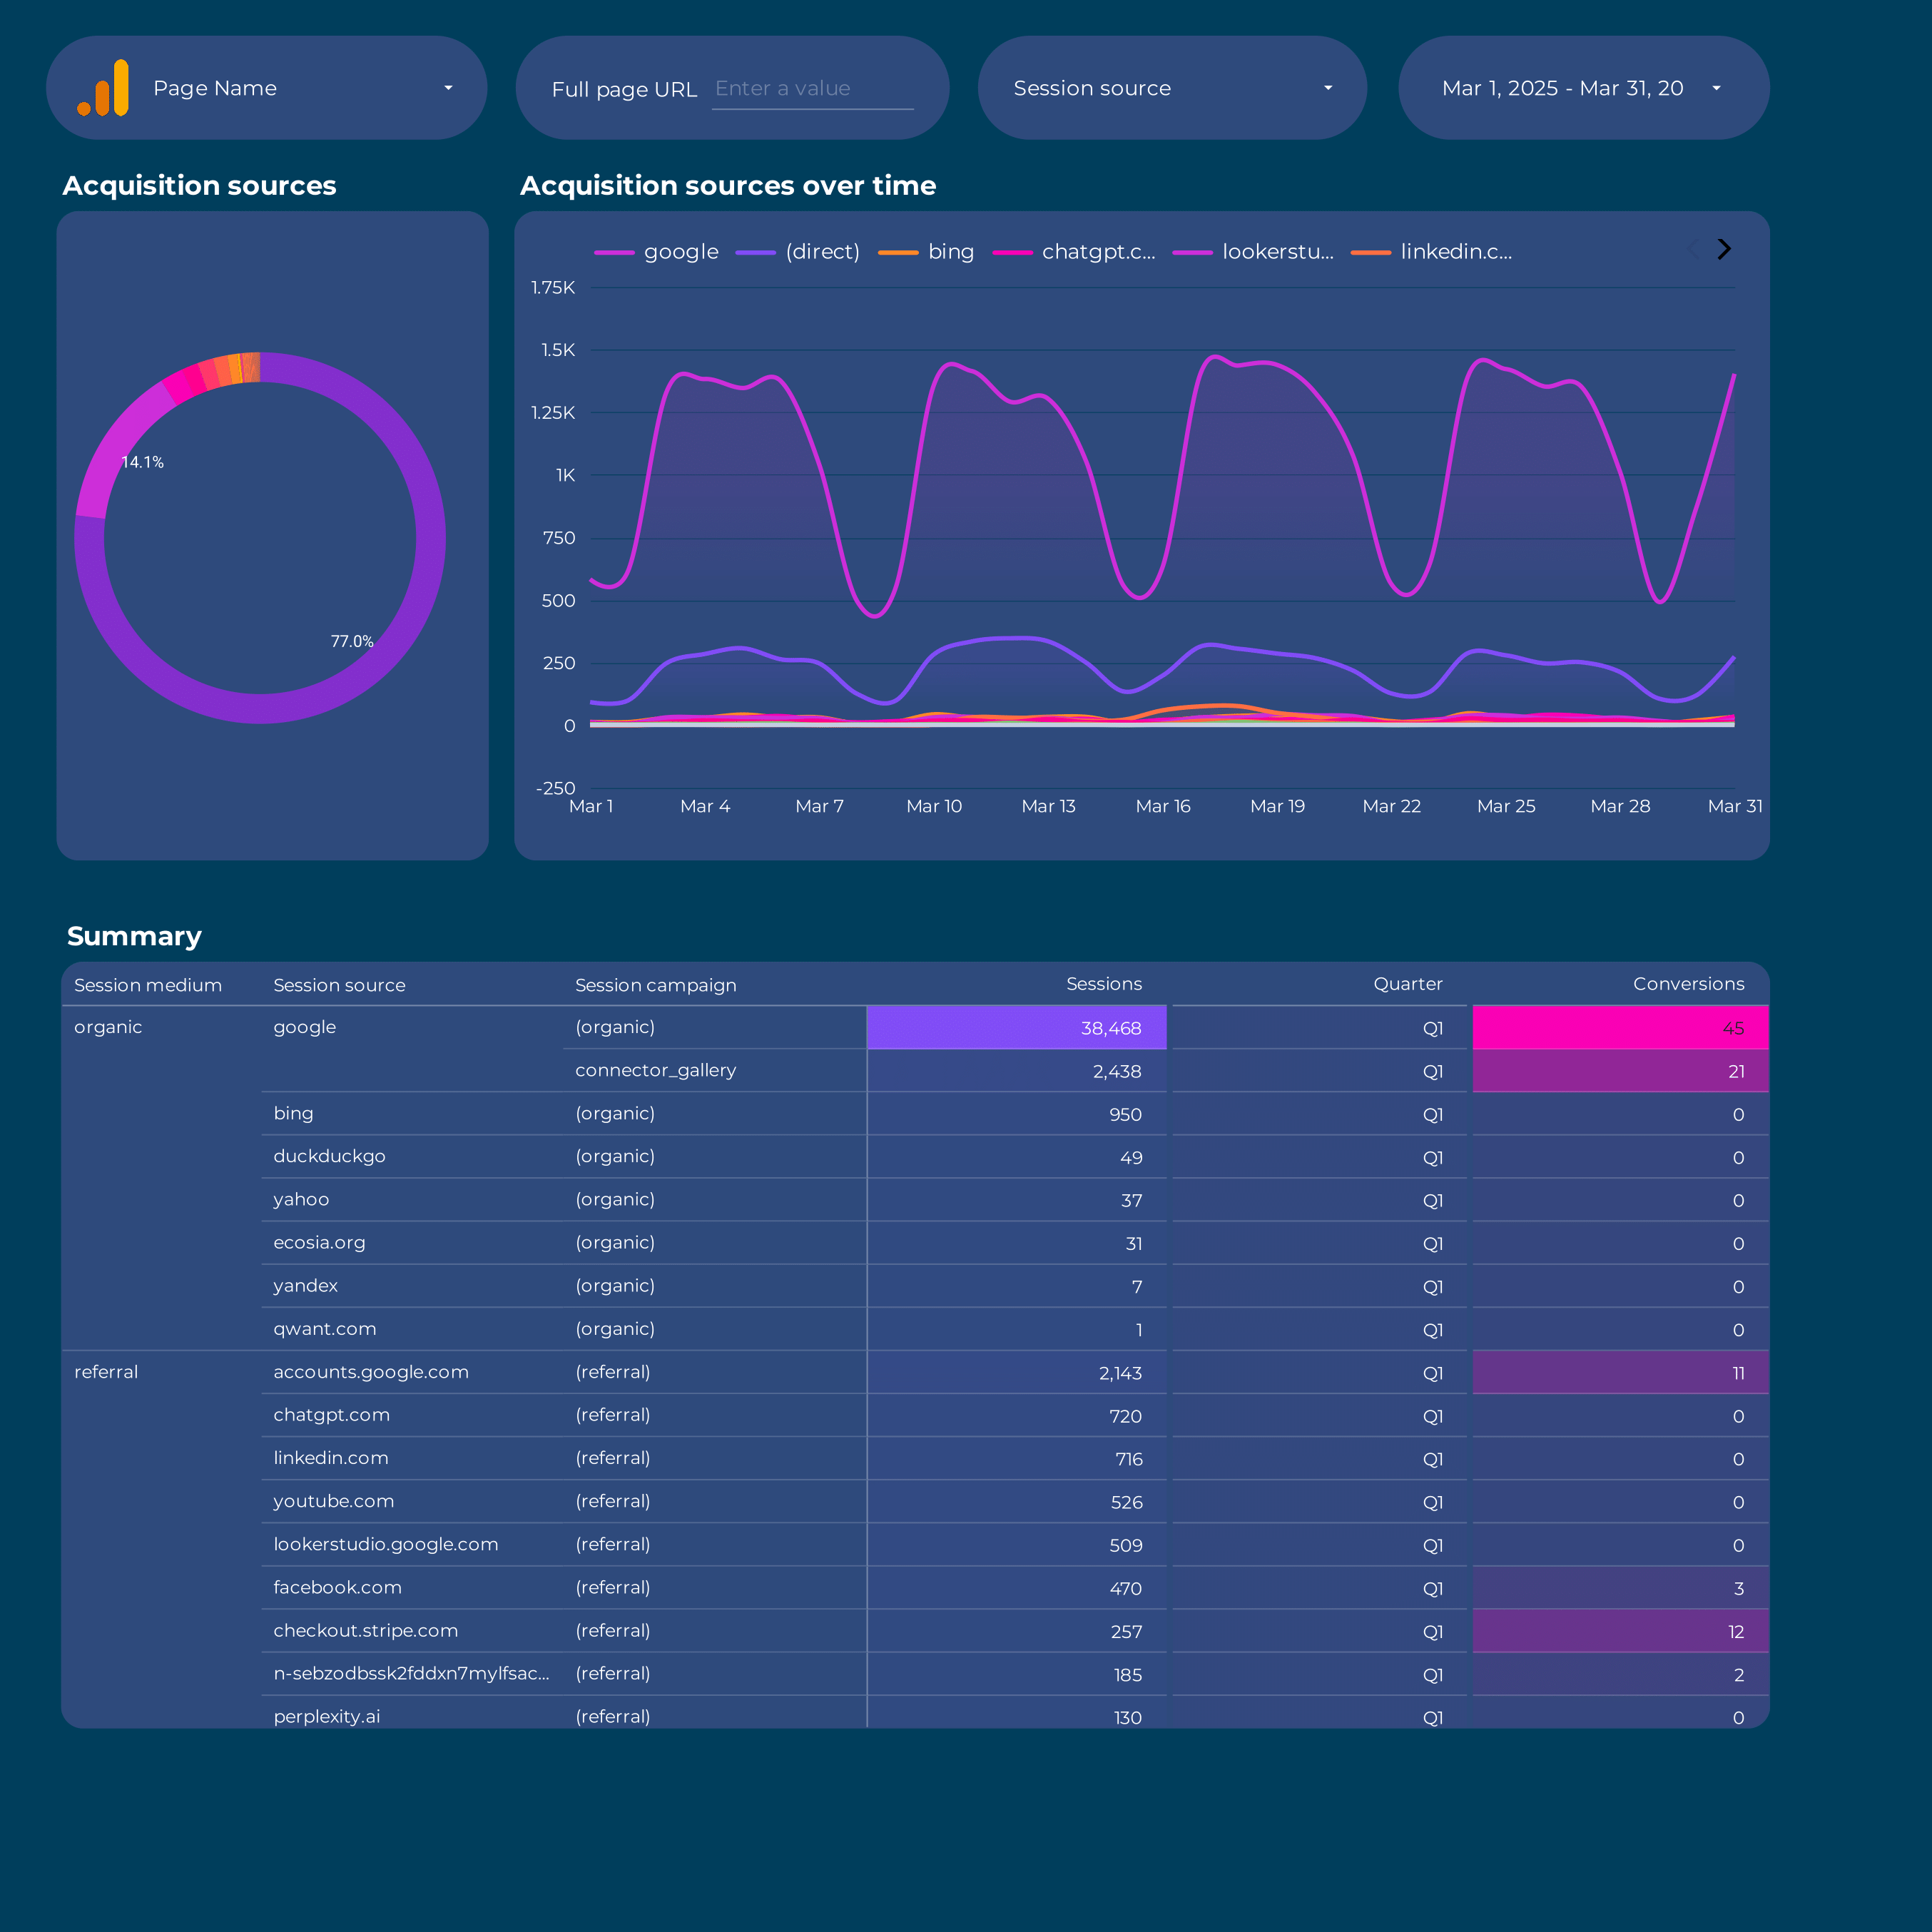
A Google Analytics 4 acquisition dashboard is a tool that visualizes key metrics related to how users are acquired on a website or app. It includes metrics such as conversions, conversion rates, engaged sessions, and user counts. The dashboard segments data by dimensions like campaign, channel, and source, helping identify trends and areas for optimization. It can be shared via PDF, email, or links for easy access.


 Google Analytics 4
 Ad Spend