Youtube report template for Looker Studio by Porter

Get the actual Youtube on Looker Studio template used by Porter to monitor Social Media performance.

Meet the creator

Porter

This template is built by the same marketers behind all our tutorials, support, and our template gallery.

+40,000 marketers have downloaded our dashboards

Template setup

Copy-paste the same dashboards that other teams and agencies use to monitor their Social Media performance

Youtube report template overview

With this YouTube dashboard template, you can effortlessly monitor specific metrics to track the performance of your channel. For example, easily keep an eye on the number of views, likes, and comments your videos receive to gauge audience engagement. Additionally, you can segment the data by video category or geographic location to identify trends and target specific demographics effectively. To influence teams or clients, share the insights gained from this dashboard via PDF, link, or email. Showcase the growth in subscriber count over time or the increase in watch time to demonstrate the success of your YouTube channel. Provide concrete evidence and data-driven reports that can be easily communicated to stakeholders for effective decision-making. Unlock valuable insights by utilizing this template to answer important questions related to your YouTube performance. Identify which videos generate the most traffic or which keywords contribute to a higher search ranking. Determine the peak viewing hours or days to optimize publishing schedules. Make data-informed choices that impact your content strategy, marketing efforts, and overall channel growth. Take charge of your YouTube journey with this comprehensive report template, and empower yourself with the insights to drive success and reach your goals.

Metrics and dimensions included

Customize the template’s metrics and dimensions as you like. See all available fields.

Metrics

Conversion metrics

– Click-through rate (CTR) – Conversion rate – Cost per acquisition (CPA)

Engagement metrics

– Number of likes – Number of comments – Number of shares

Visibility metrics

– Number of views – Watch time – Subscribers

Dimensions

Campaign

– Target audience – Advertising platforms – Performance metrics

Audience

– Demographic
– Geographic
– Psychographic

Time

By hour, day, week, month, quarter, or year

Features

100% custom charts

White-label

Custom metrics​

All-time historical data

Schedule email alerts​

Filters

Interactive

Goals​

Data blending

FAQs

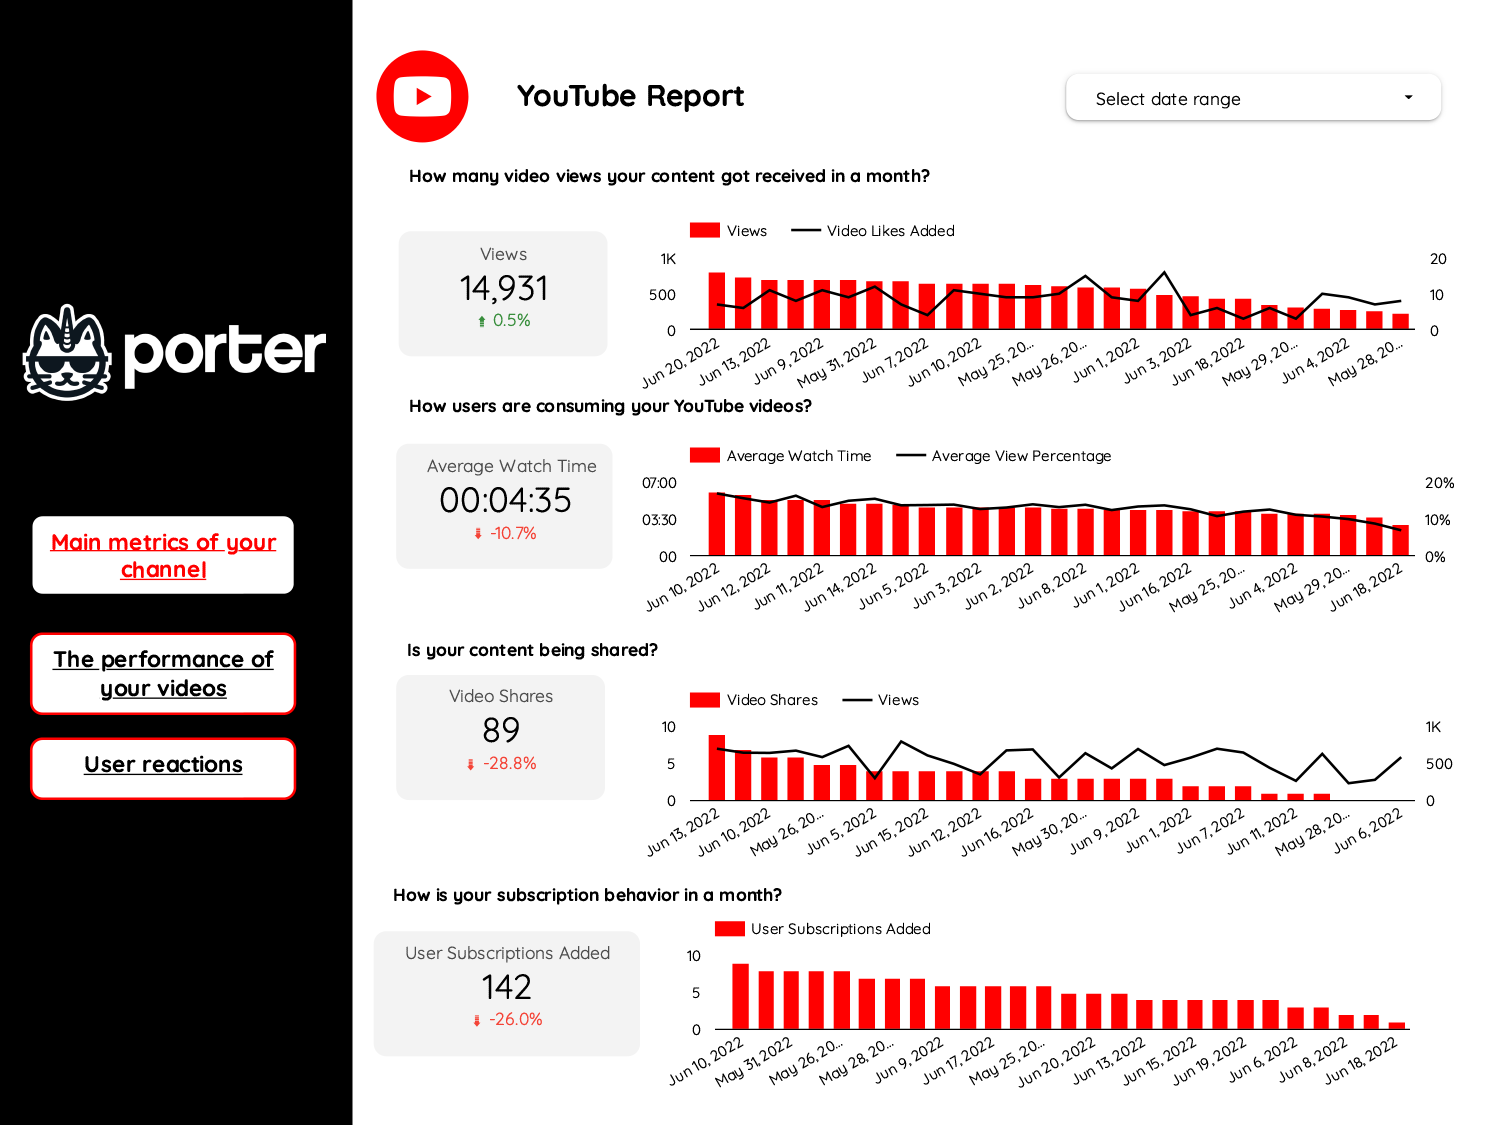
A Youtube report should include visibility metrics such as views, impressions, and reach, engagement metrics like likes, comments, and shares, and conversion metrics including click-through rate and conversion rate. Data should be segmented by campaign (e.g., ad campaigns), channel (e.g., specific Youtube channels), audience (e.g., demographics or interests), content (e.g., video titles or categories), objective (e.g., brand awareness or lead generation), and date (e.g., weekly or monthly). For example, an analysis of a specific campaign’s reach within different audience segments or the engagement performance of a particular channel’s videos can be included.

To analyze LinkedIn Pages data, 1) choose visibility metrics such as impressions and reach, engagement metrics like likes and comments, and conversion metrics including click-through rates. Break them down to assess the performance of each category. 2) Add context by comparing the data against cost and date range to determine ROI, goals achieved, and benchmark against industry rates. For example, compare the click-through rate against the average rate for similar campaigns. 3) Segment the data by campaign, channel, audience, content, objective, and date to identify trends and insights. For instance, examine performance by audience segment or analyze the impact of different content types on engagement.

To build a YouTube dashboard, 1) connect your YouTube account and data to your dashboard tool. 2) Select metrics such as views, likes, shares, comments, and watch time to monitor performance. 3) Segment data by campaign, channel, audience, video content, objective, and date. For example, you can break down views by video or audience demographics. 4) Add filters or buttons to make your report interactive, such as a filter for specific time periods. 5) Share your dashboard via PDF, scheduled emails, or links.

A LinkedIn Pages dashboard is a tool that visually displays key metrics and data related to a company’s LinkedIn Page to monitor performance and inform decision-making. It is significant for businesses as it helps them understand their audience engagement, content performance, and overall LinkedIn marketing strategy effectiveness. Tools like Looker Studio can be used to create such a dashboard, which typically includes elements like follower growth, post engagement, visitor demographics, and more. Real-time data monitoring is crucial as it allows businesses to react quickly to changes and optimize their strategies. For learning how to create a marketing dashboard using Looker Studio, visit our YouTube channel: https://www.youtube.com/@porter.metrics.

Yes, Looker Studio allows you to download your report as a PDF. To do it, follow these steps: Before downloading your report choose the date range you want to visualize on your report. Click on the “File” menu at the top left corner of the screen. Select “Download as” from the drop-down menu and choose “PDF.” You can choose which pages you want to download, and also you can add a password to protect the report and add a link back to the online report. Click on “Download” to save the report on your device.