Facebook Ads Funnel report template for Looker Studio by Porter

Get the actual Facebook Ads Funnelon Looker Studio template used by Porter to monitor PPC performance.

Meet the creator

Porter

This template is built by the same marketers behind all our tutorials, support, and our template gallery.

+40,000 marketers have downloaded our dashboards

Template setup

Copy-paste the same dashboards that other teams and agencies use to monitor their PPC performance

Facebook Ads Funnel report template overview

With this Facebook Ads funnel report template, monitor specific metrics such as click-through rate (CTR), conversion rate, cost per acquisition (CPA), return on ad spend (ROAS), and impressions. Segment data by demographics, device type, ad placement, and time of day to gain insights into your Facebook Ads Funnel and PPC performance. Share the report through a link, PDF, or email to influence your team or customers. Answer questions such as: – What is the conversion rate for each ad set? – How does the cost per acquisition vary by demographic? – Which ad placements are generating the highest return on ad spend? – What time of day yields the most impressions and clicks? – How do different device types impact click-through rates? This template is designed for marketers focused on PPC and Facebook Ads, providing a comprehensive view of your advertising funnel performance.

Metrics and dimensions included

Customize the template’s metrics and dimensions as you like. See all available fields.

Metrics

Conversion metrics

– Click-through rate (CTR) – Conversion rate – Cost per acquisition (CPA)

Engagement metrics

– Click-Through Rate (CTR) – Conversion Rate – Social Shares

Visibility metrics

– Impressions – Reach – Organic search traffic

Dimensions

Campaign

– Audience targeting – Ad creative – Placement strategy

Audience

Time

By hour, day, week, month, quarter, or year

Features

100% custom charts

White-label

Custom metrics​

All-time historical data

Schedule email alerts​

Filters

Goals​

Data blending

FAQs

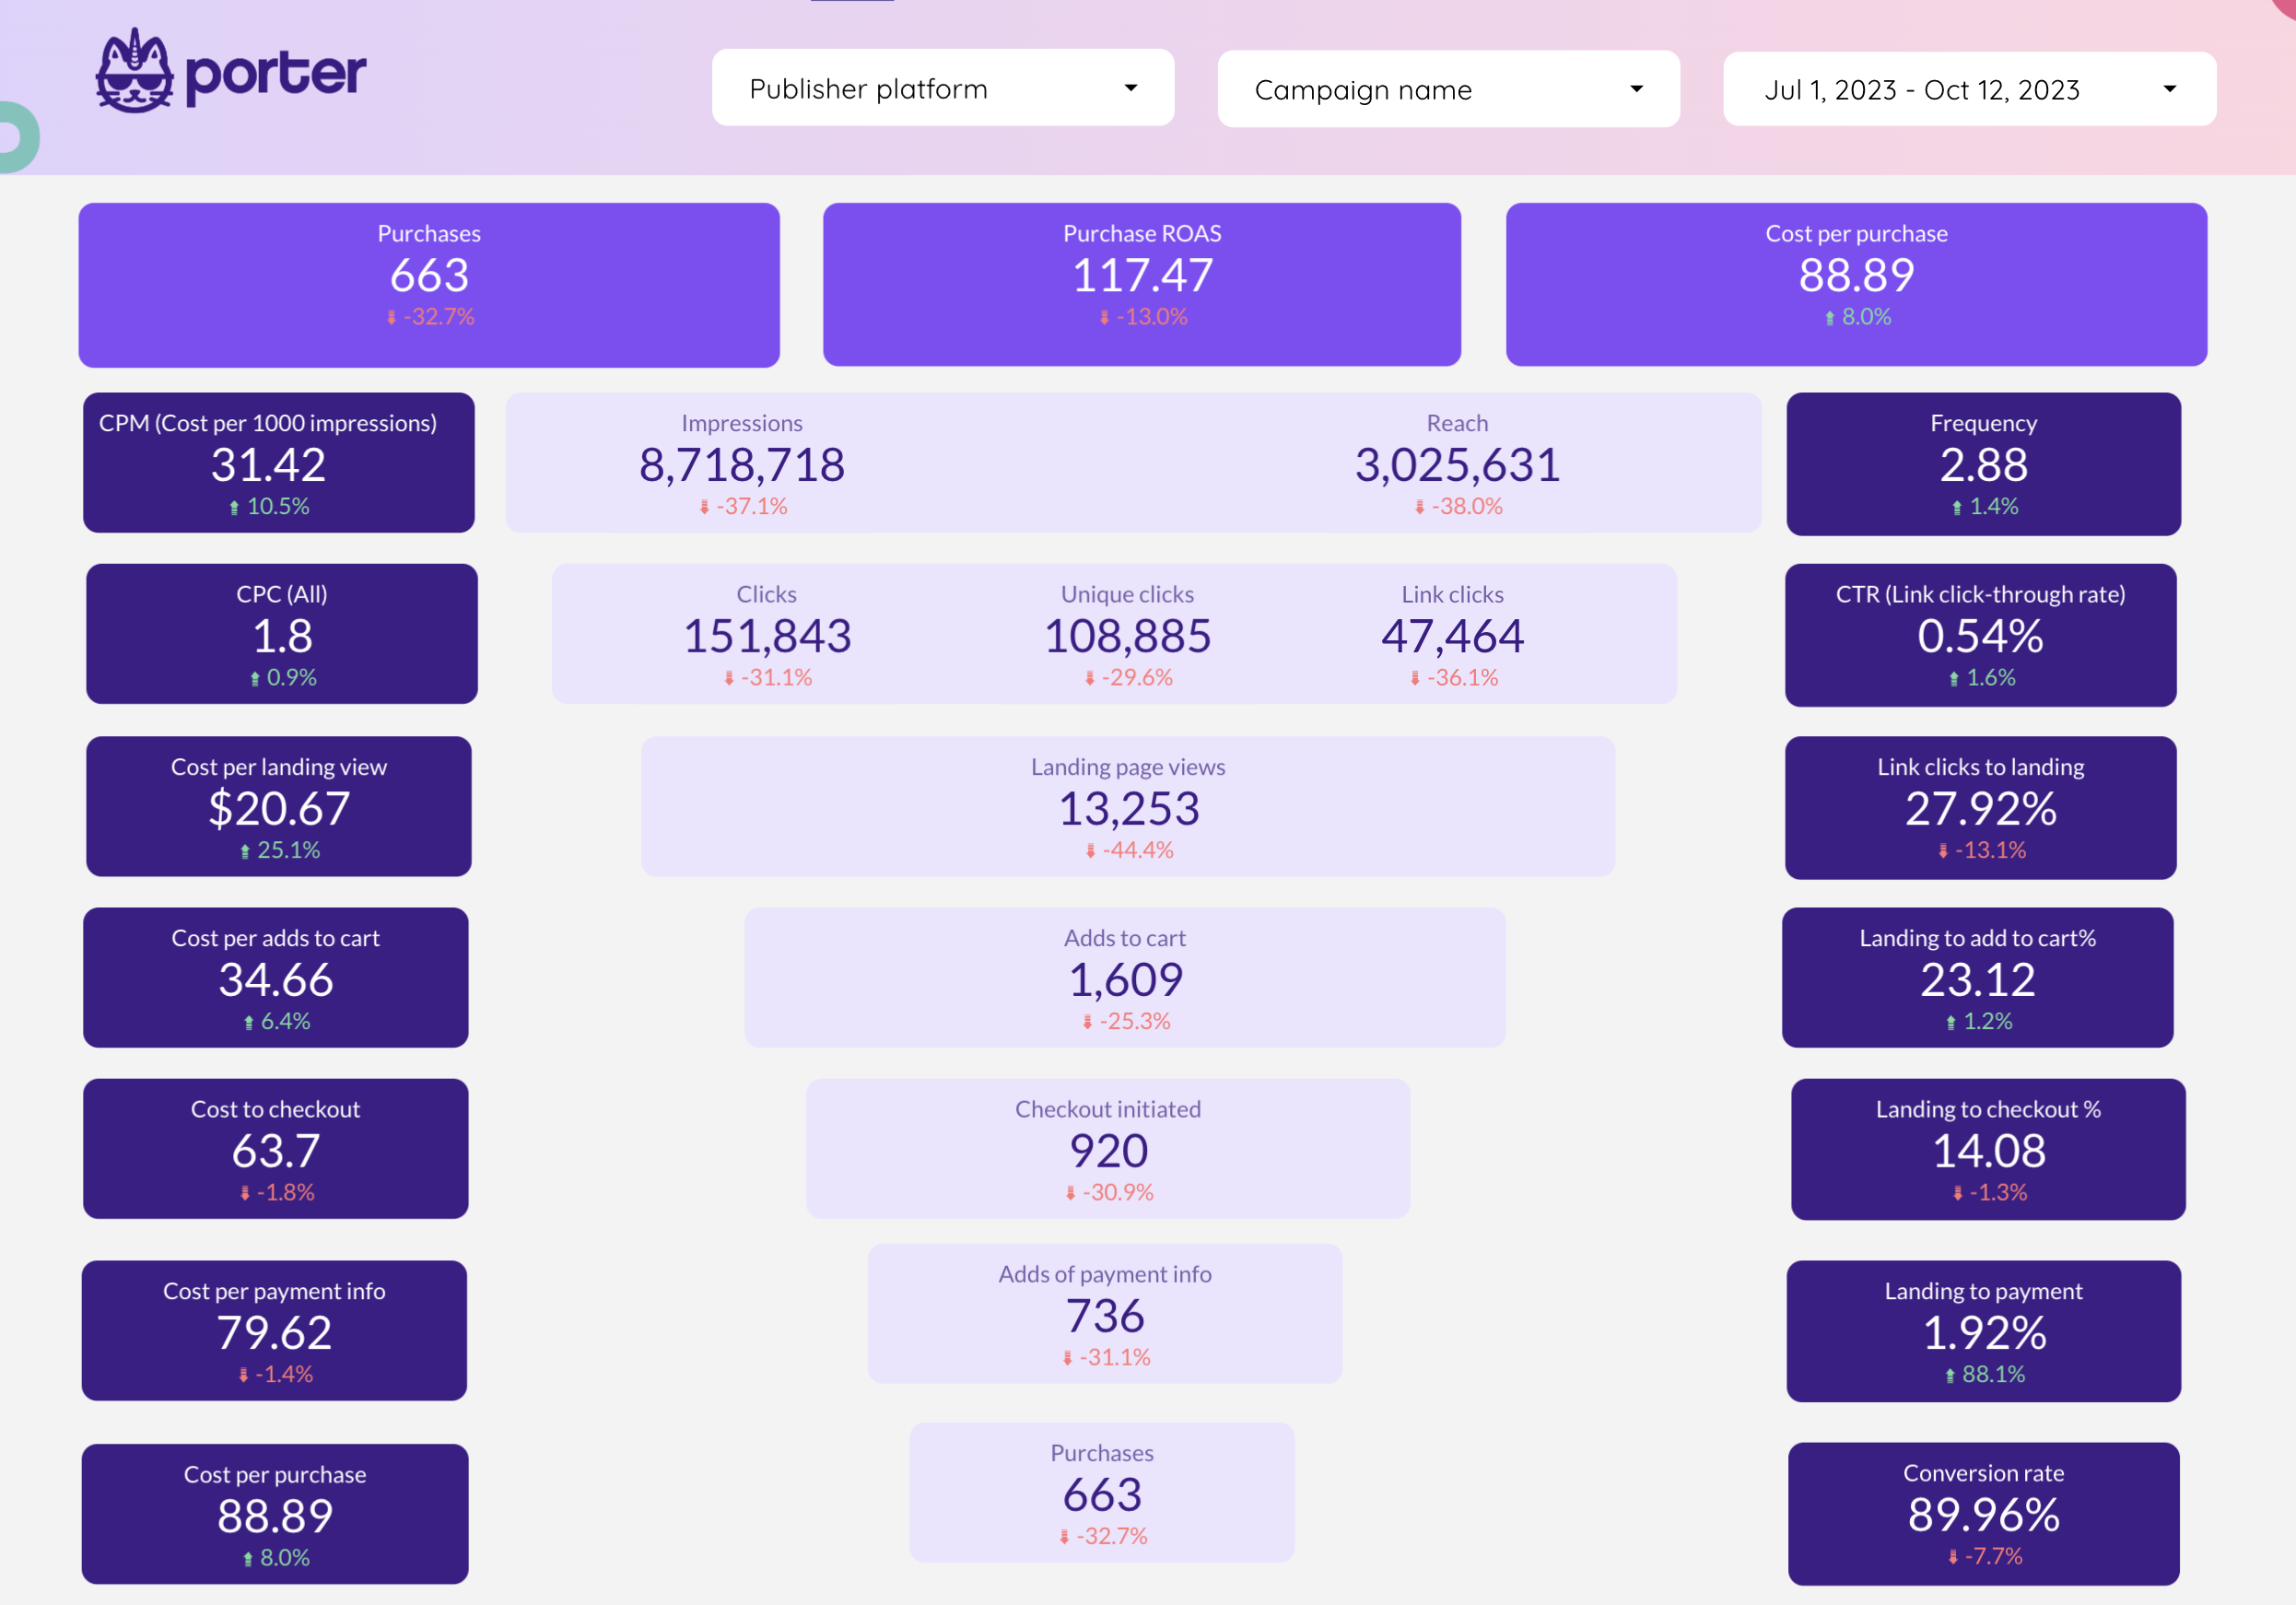
A Facebook Ads funnel report should include visibility metrics such as reach and impressions, engagement metrics like likes, comments, and shares, and conversion metrics including click-through rates and conversion rates. Data should be segmented by campaign, channel, audience, content, objective, and date for detailed insights. For example, highlight the performance of a specific campaign targeting a particular audience segment and compare it with other campaigns to identify best practices.
To build a Facebook Ads funnel dashboard, 1) connect your Facebook Ads account and any other relevant data sources. 2) Select metrics such as click-through rates, conversion rates, and cost per action to monitor performance. 3) Segment your data by campaign, channel, audience, product, customer content, objective, and date to gain a comprehensive understanding. 4) Add filters or buttons for metrics like age, gender, or location to make your report interactive. 5) Share your dashboard via PDF, scheduled emails, or links for easy access and review.
Yes, Looker Studio allows you to download your report as a PDF. To do it, follow these steps: Before downloading your report choose the date range you want to visualize on your report. Click on the “File” menu at the top left corner of the screen. Select “Download as” from the drop-down menu and choose “PDF.” You can choose which pages you want to download, and also you can add a password to protect the report and add a link back to the online report. Click on “Download” to save the report on your device.