Facebook Ads Creative performance report template for Looker Studio by Porter

Get the actual Facebook Ads Creative performanceon Looker Studio template used by Porter to monitor PPC performance.

Meet the creator

Porter

This template is built by the same marketers behind all our tutorials, support, and our template gallery.

+40,000 marketers have downloaded our dashboards

Template setup

Copy-paste the same dashboards that other teams and agencies use to monitor their PPC performance

Facebook Ads Creative performance report template overview

With this Facebook Ads creative analysis report template, monitor specific metrics such as click-through rate (CTR), conversion rate, cost per click (CPC), engagement rate, and return on ad spend (ROAS). Segment data by demographics, ad placement, device type, and time of day to gain insights into Facebook Ads Creative performance and PPC strategies. Share the report through a link, PDF, or email to influence your team or clients. Answer questions such as: – How is the click-through rate varying across different demographics? – What is the conversion rate for each ad placement? – How does the cost per click differ by device type? – What time of day yields the highest engagement rate? – How is the return on ad spend impacted by different creative elements? This template is designed for marketers focusing on PPC and Facebook Ads to optimize their advertising strategies.

Metrics and dimensions included

Customize the template’s metrics and dimensions as you like. See all available fields.

Metrics

Conversion metrics

– Click-through rate (CTR) – Conversion rate – Cost per acquisition (CPA)

Engagement metrics

– Number of likes – Number of comments – Number of shares

Visibility metrics

– Impressions – Reach – Click through rate

Dimensions

Campaign

– Target audience – Content message – Distribution channels

Audience

– Demographic breakdown
– Geographic breakdown
– Psychographic breakdown

Time

By hour, day, week, month, quarter, or year

Features

100% custom charts

White-label

Custom metrics​

All-time historical data

Schedule email alerts​

Filters

Interactive

Goals​

Data blending

FAQs

A creatives analysis report should include breaking down metrics by visibility, engagement, and conversion metrics. It should segment data by campaign, channel, audience, content, objective, and date. For example, providing the number of impressions, click-through rates, and conversions for each campaign, channel, or audience helps identify the performance of creatives at different stages. Additionally, analyzing engagement metrics like likes, shares, and comments provides insights into the effectiveness of different types of content. Lastly, conversion metrics such as lead generation or sales can highlight the impact of creatives.
  1. To analyze Facebook Ads e-commerce data, choose metrics like reach, impressions, and clicks for visibility; likes, comments, and shares for engagement; and add-to-cart, purchases, and conversion rate for conversion metrics.
  2. Compare these metrics against the cost per click, cost per conversion, return on ad spend, and average order value. Also, analyze the data across different date ranges, campaign goals, industry benchmarks, and conversion rates.
  3. Segment the data by campaign type, ad channel, target audience, ad content, campaign objective, and date. For example, compare the engagement metrics of video ads vs. image ads, or the conversion rate of campaigns targeting different audience segments.
To build a Facebook Ads creative analysis dashboard, 1) connect your Facebook Ads account and any other relevant data sources. 2) Select metrics such as click-through rate, conversion rate, and cost per action to monitor performance. 3) Segment your data by campaign, channel, audience, ad creative, objective, and date to gain a comprehensive understanding. 4) Add filters or buttons for metrics like ad spend or impressions to make your report interactive. 5) Share your dashboard via PDF, scheduled emails, or links for easy access and review.

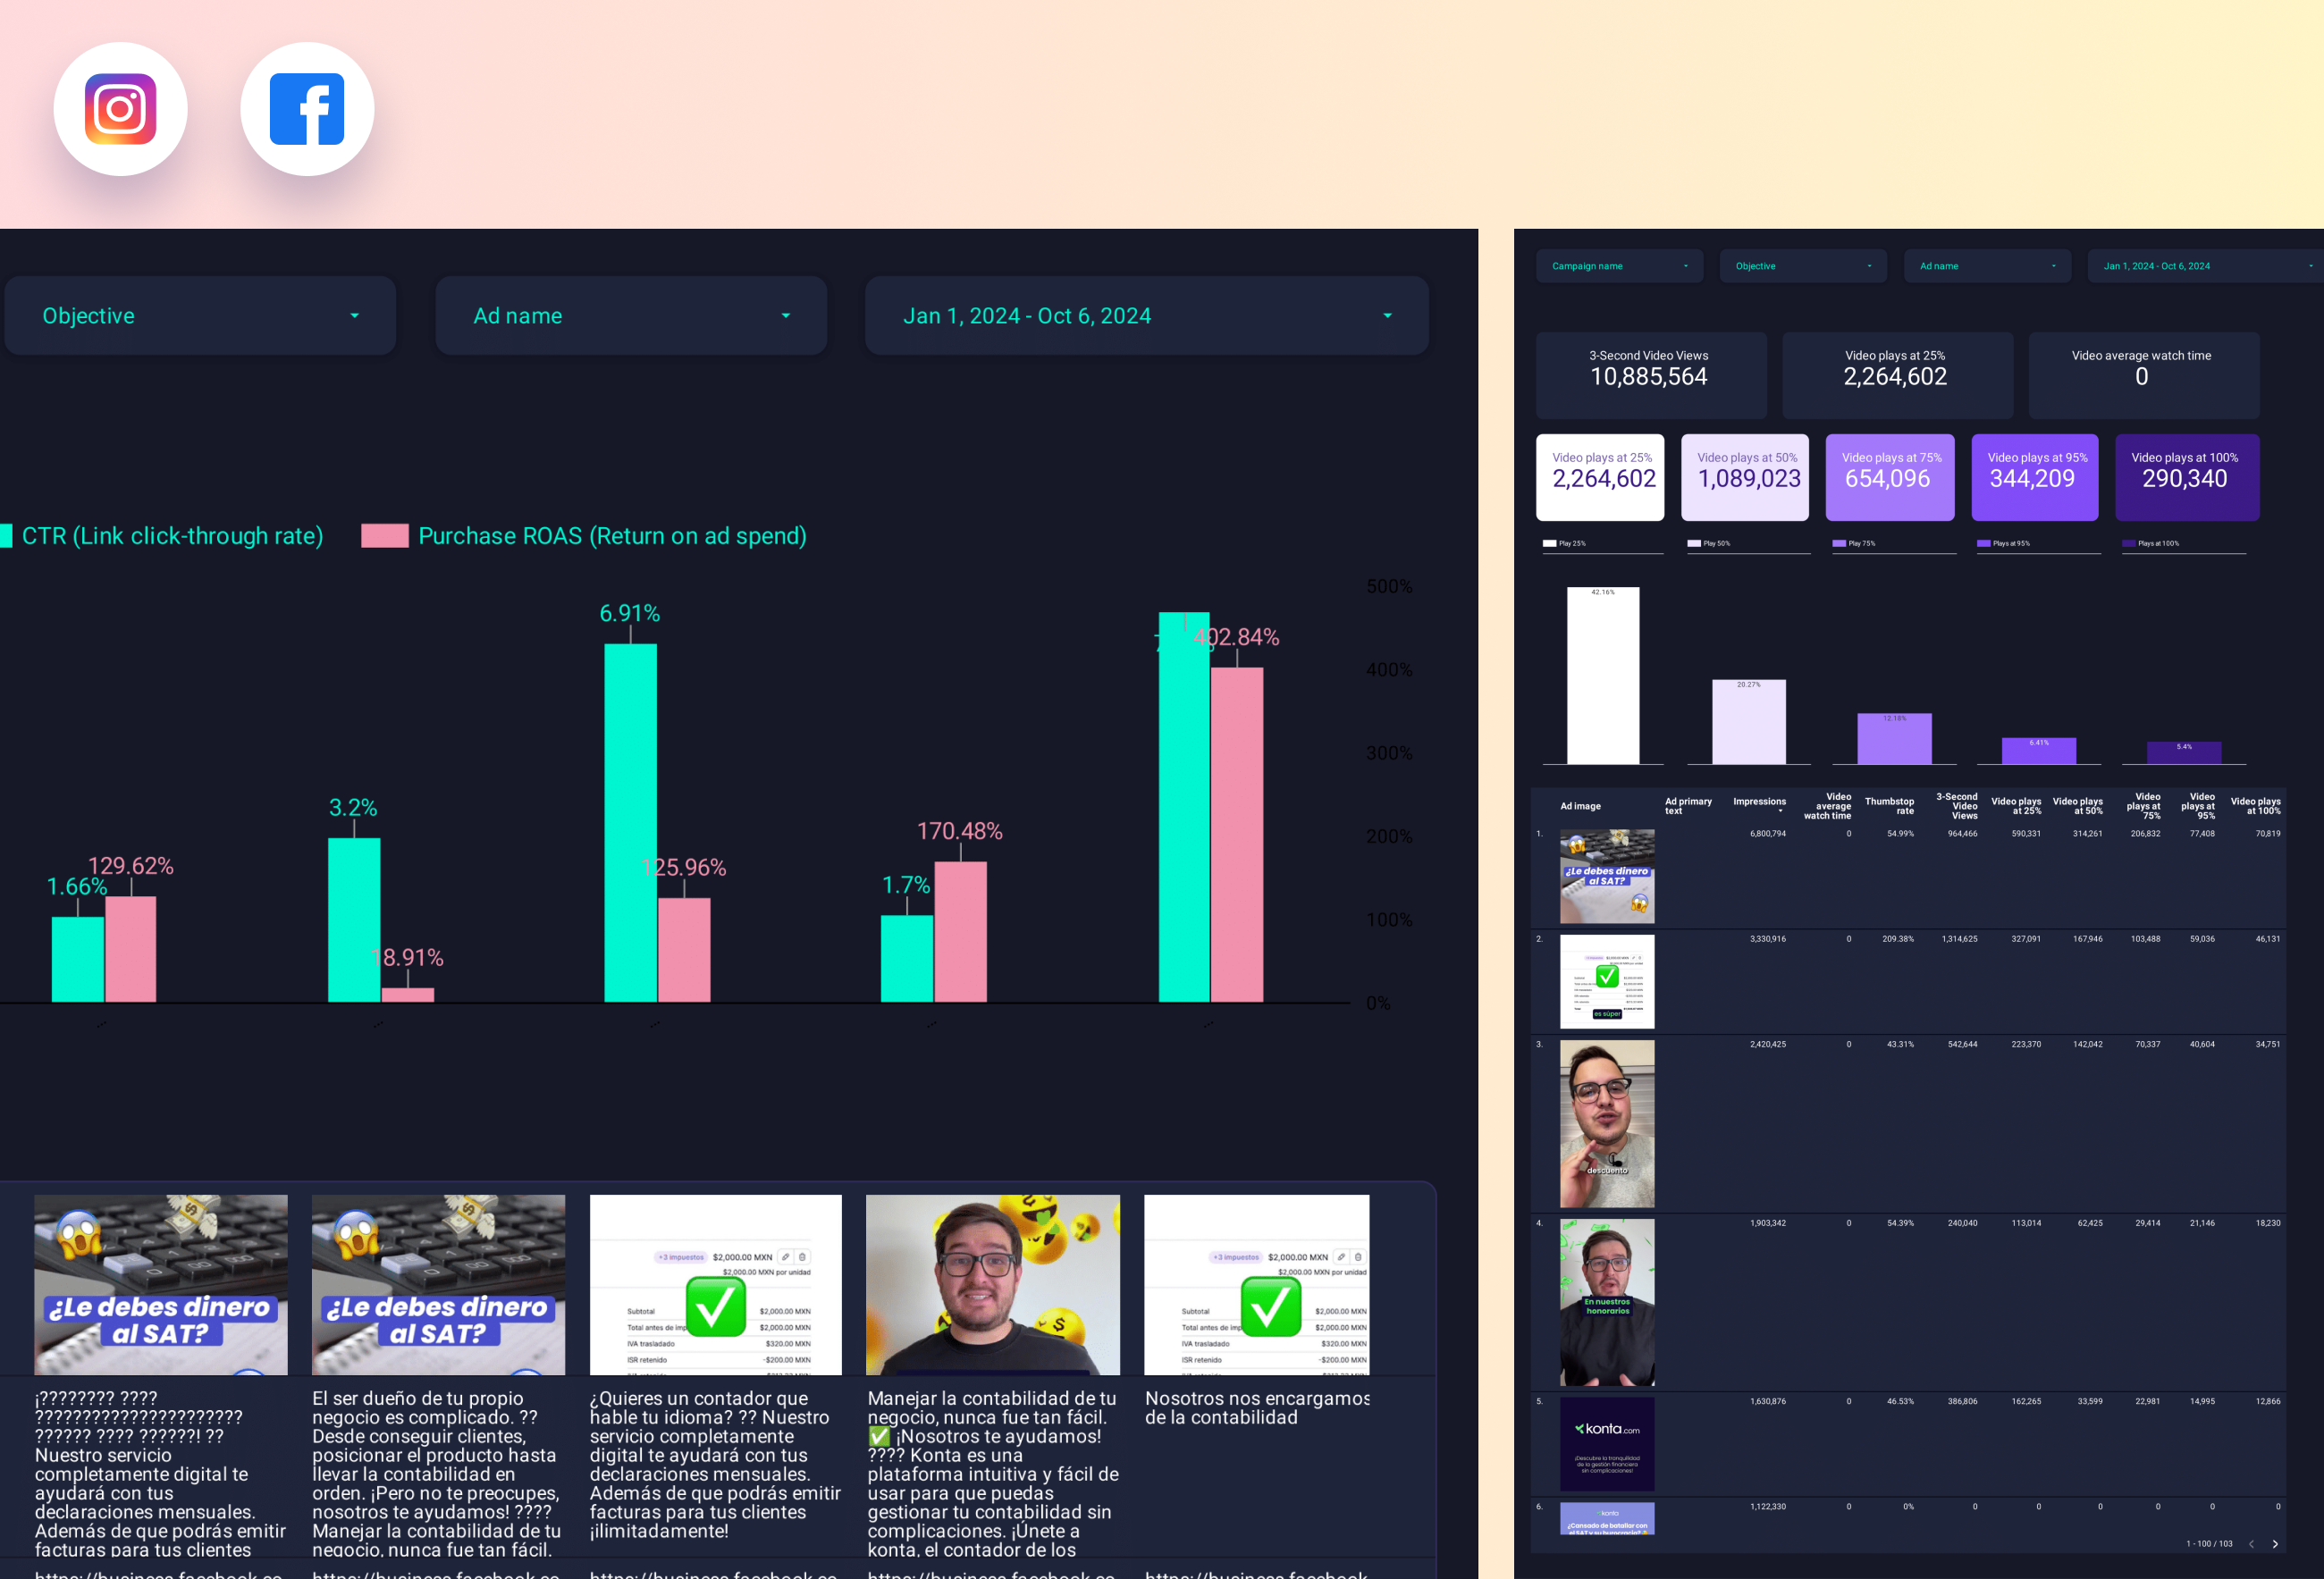
A Facebook Ads e-commerce dashboard is a visual tool that displays key performance indicators (KPIs) related to Facebook advertising campaigns for e-commerce businesses. It is significant for businesses as it helps them track and measure the effectiveness of their Facebook Ads, enabling them to make data-driven decisions. Common tools used to create such a dashboard include Looker Studio, Tableau, and Power BI, and key elements typically included are ad spend, click-through rates, conversion rates, and return on ad spend. Real-time data monitoring is crucial as it allows businesses to quickly adjust their strategies based on current performance. For learning how to create a marketing dashboard using Looker Studio, you can refer to our YouTube channel: https://www.youtube.com/@porter.metrics.

Yes, Looker Studio allows you to download your report as a PDF. To do it, follow these steps: Before downloading your report choose the date range you want to visualize on your report. Click on the “File” menu at the top left corner of the screen. Select “Download as” from the drop-down menu and choose “PDF.” You can choose which pages you want to download, and also you can add a password to protect the report and add a link back to the online report. Click on “Download” to save the report on your device.