A Google Ads funnel report should include metrics such as conversion metrics like Conversion Rate, Cost Per Conversion, and Conversion Value; engagement metrics like Click-through Rate (CTR), Engagement Rate, and Conversion Rate; and visibility metrics. Such data should be segmented and filtered by campaign dimensions like Campaign, Ad Sets, and Devices; audience dimensions like Audience Type, Campaign, and Ad Group; and time dimensions like by hour, day, week, month, quarter, or year. Once data is ready, make sure to add buttons and filters to make your reports interactive, custom colors and logos to make it white-label, and share via link, PDF, or email so your teams or clients can access it.
To build a Google Ads funnel report, start by connecting your PPC accounts, such as Google Ads, to platforms like Google Sheets or Google Looker Studio. This connection allows you to import and organize your advertising data efficiently, providing a solid foundation for your report.
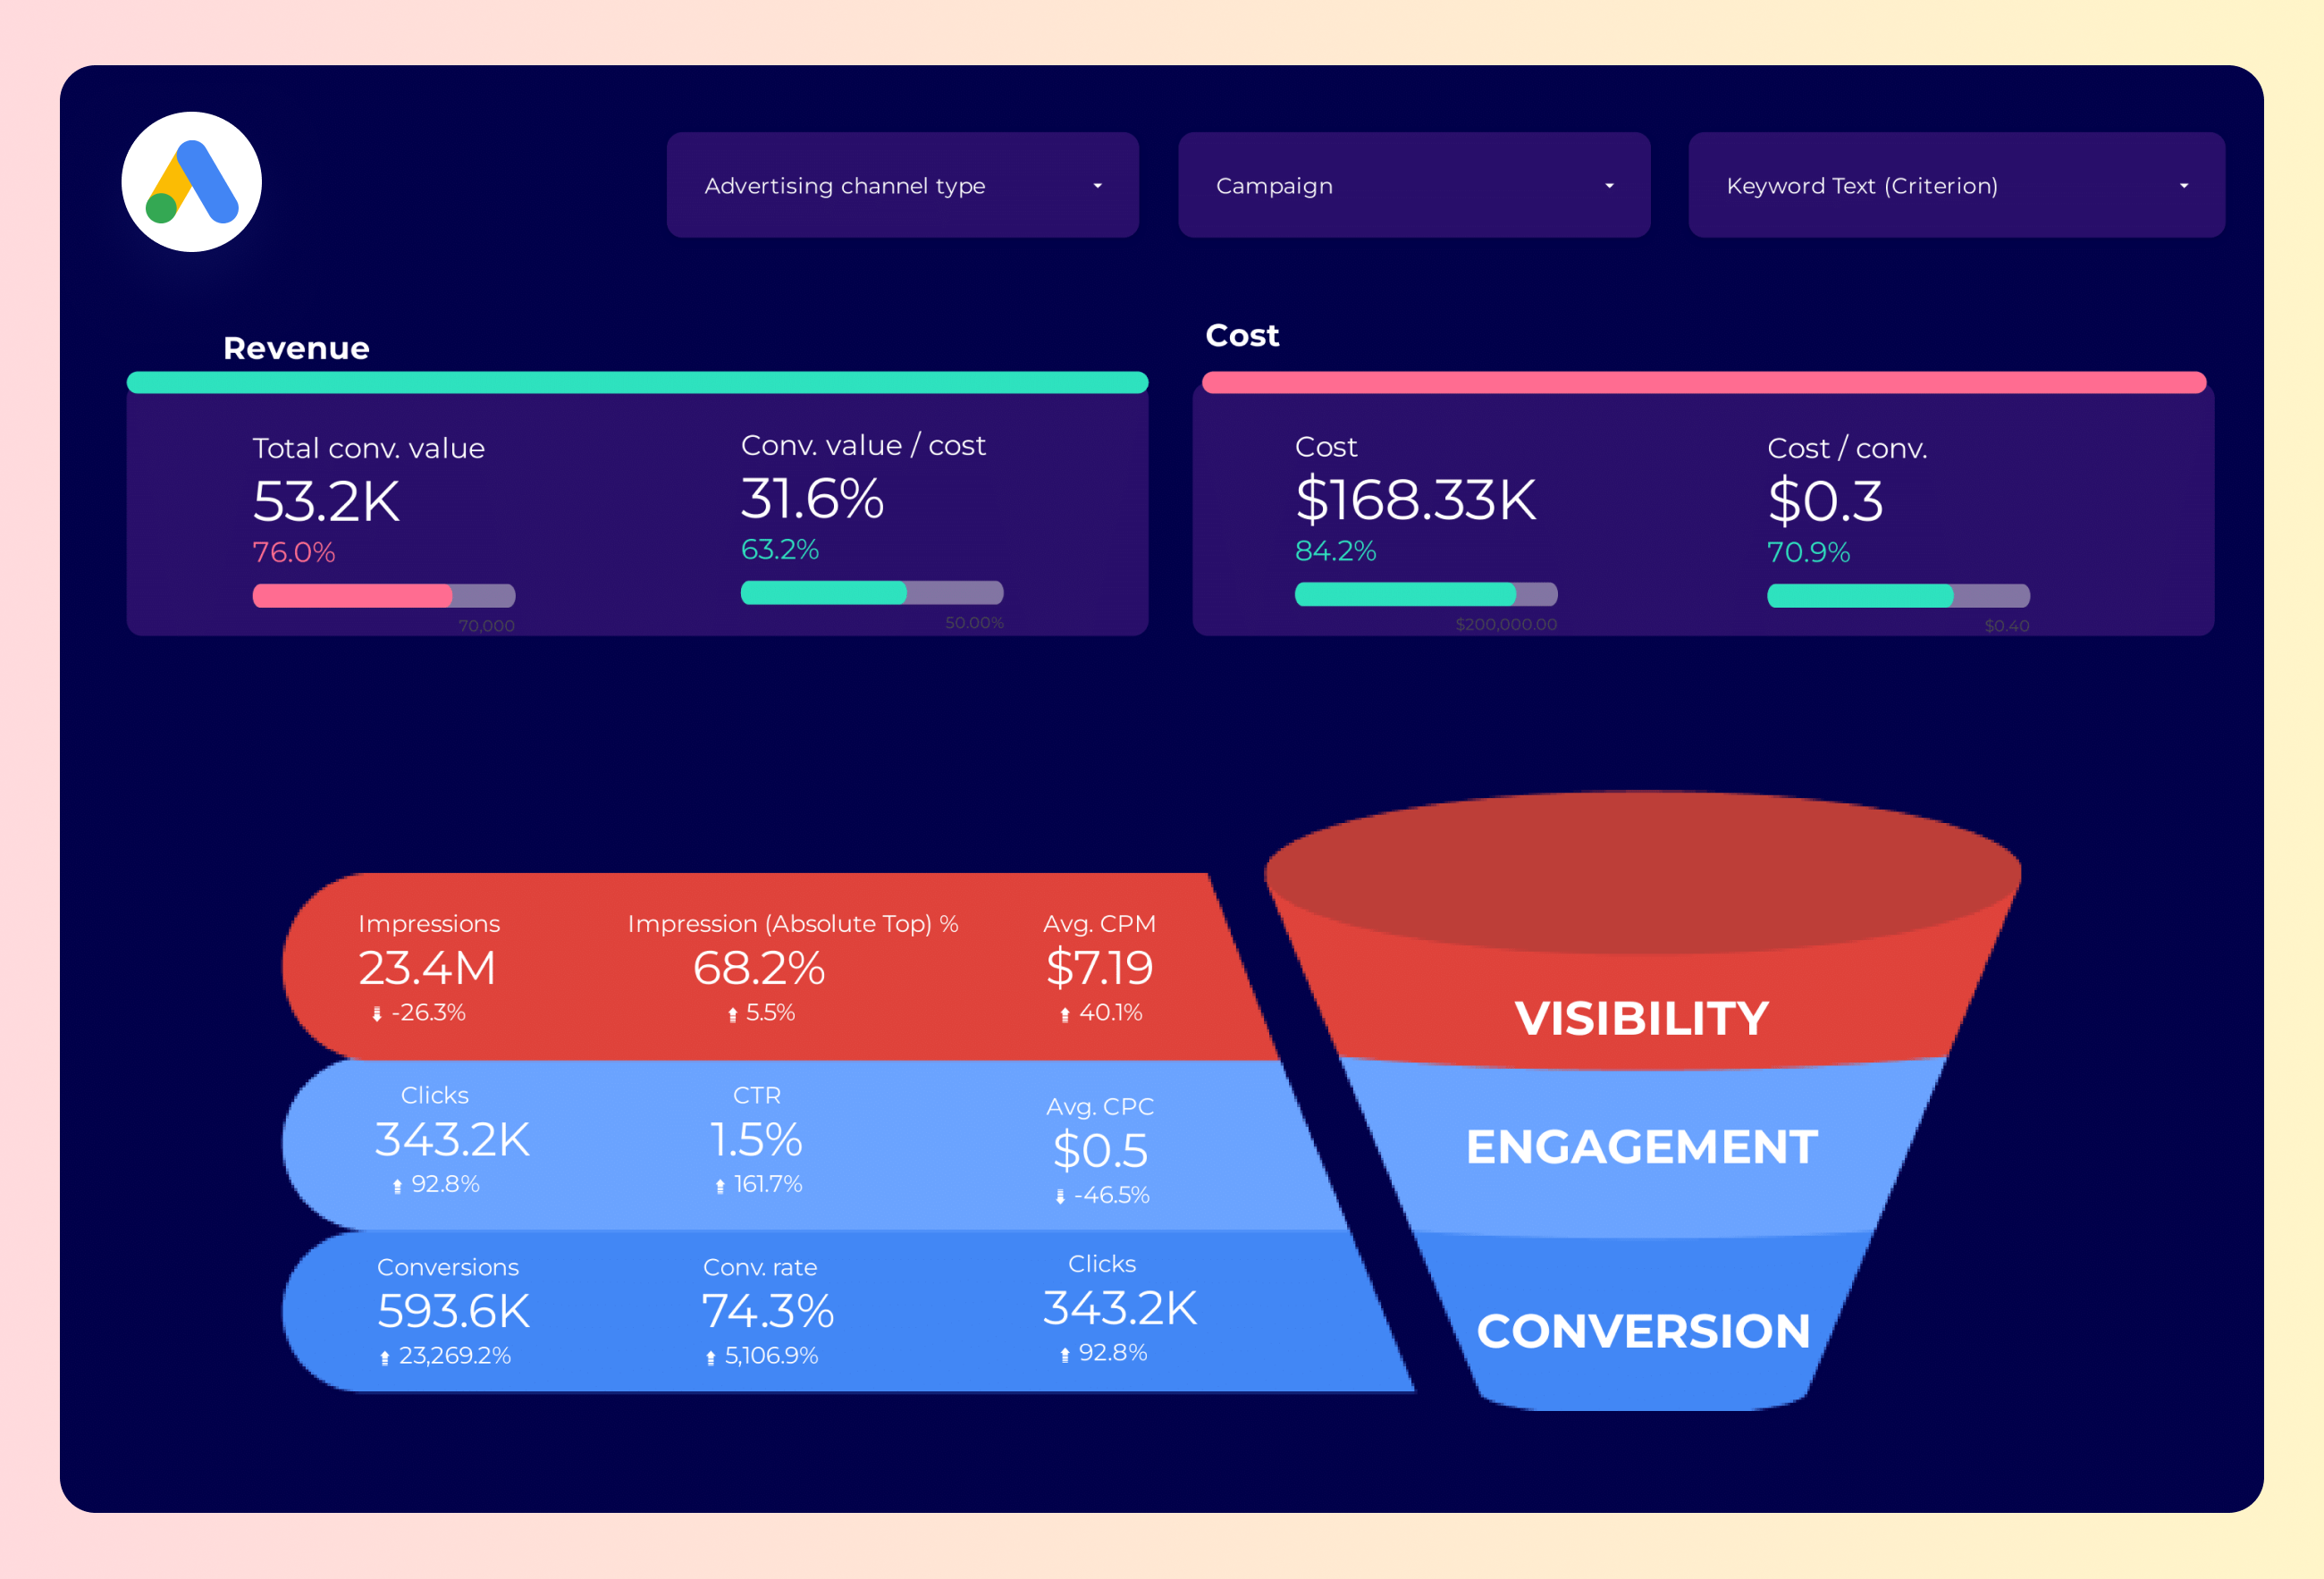
Next, select the key metrics you want to monitor to assess performance. Important metrics include Conversion Rate, Cost Per Conversion, Conversion Value, Click-through Rate (CTR), Engagement Rate, and Conversion Rate. These metrics will help you understand how well your campaigns are performing and where improvements can be made.
Once you have your metrics, segment or break down the data by various dimensions such as campaign, channel, audience, product, customer content, objective, and date. For example, you can segment data by Campaign, Ad Sets, Devices, Audience Type, Campaign, Ad Group, or by time periods like hour, day, week, month, quarter, or year. This segmentation provides deeper insights into specific areas of your advertising efforts.
To enhance the usability of your report, add filters or interactive buttons. These can include options to filter by date range or user demographics, allowing stakeholders to customize the view according to their needs. This interactivity makes the report more dynamic and user-friendly.
Finally, share your dashboard with relevant stakeholders. You can do this by exporting the report as a PDF, scheduling regular email updates, or providing direct links to the dashboard. This ensures that all parties involved have access to the latest data and insights, facilitating informed decision-making.
Yes, Looker Studio allows you to download your report as a PDF. To do it, follow these steps:
Before downloading your report choose the date range you want to visualize on your report.
Click on the “File” menu at the top left corner of the screen.
Select “Download as” from the drop-down menu and choose “PDF.”
You can choose which pages you want to download, and also you can add a password to protect the report and add a link back to the online report.
Click on “Download” to save the report on your device.