A Google Analytics 4 Audience report should include metrics such as conversion metrics like Conversions, Conversion rate, User conversion rate; engagement metrics like Engaged sessions, Average engagement time per session, Engagement rate; and visibility metrics like Active users, Total users, New users.
Then, segment and filter this data by dimensions like Campaign ID, Campaign name, Campaign medium, Audience name, Audience ID, Audience description, and by time dimensions like by hour, day, week, month, quarter, or year.
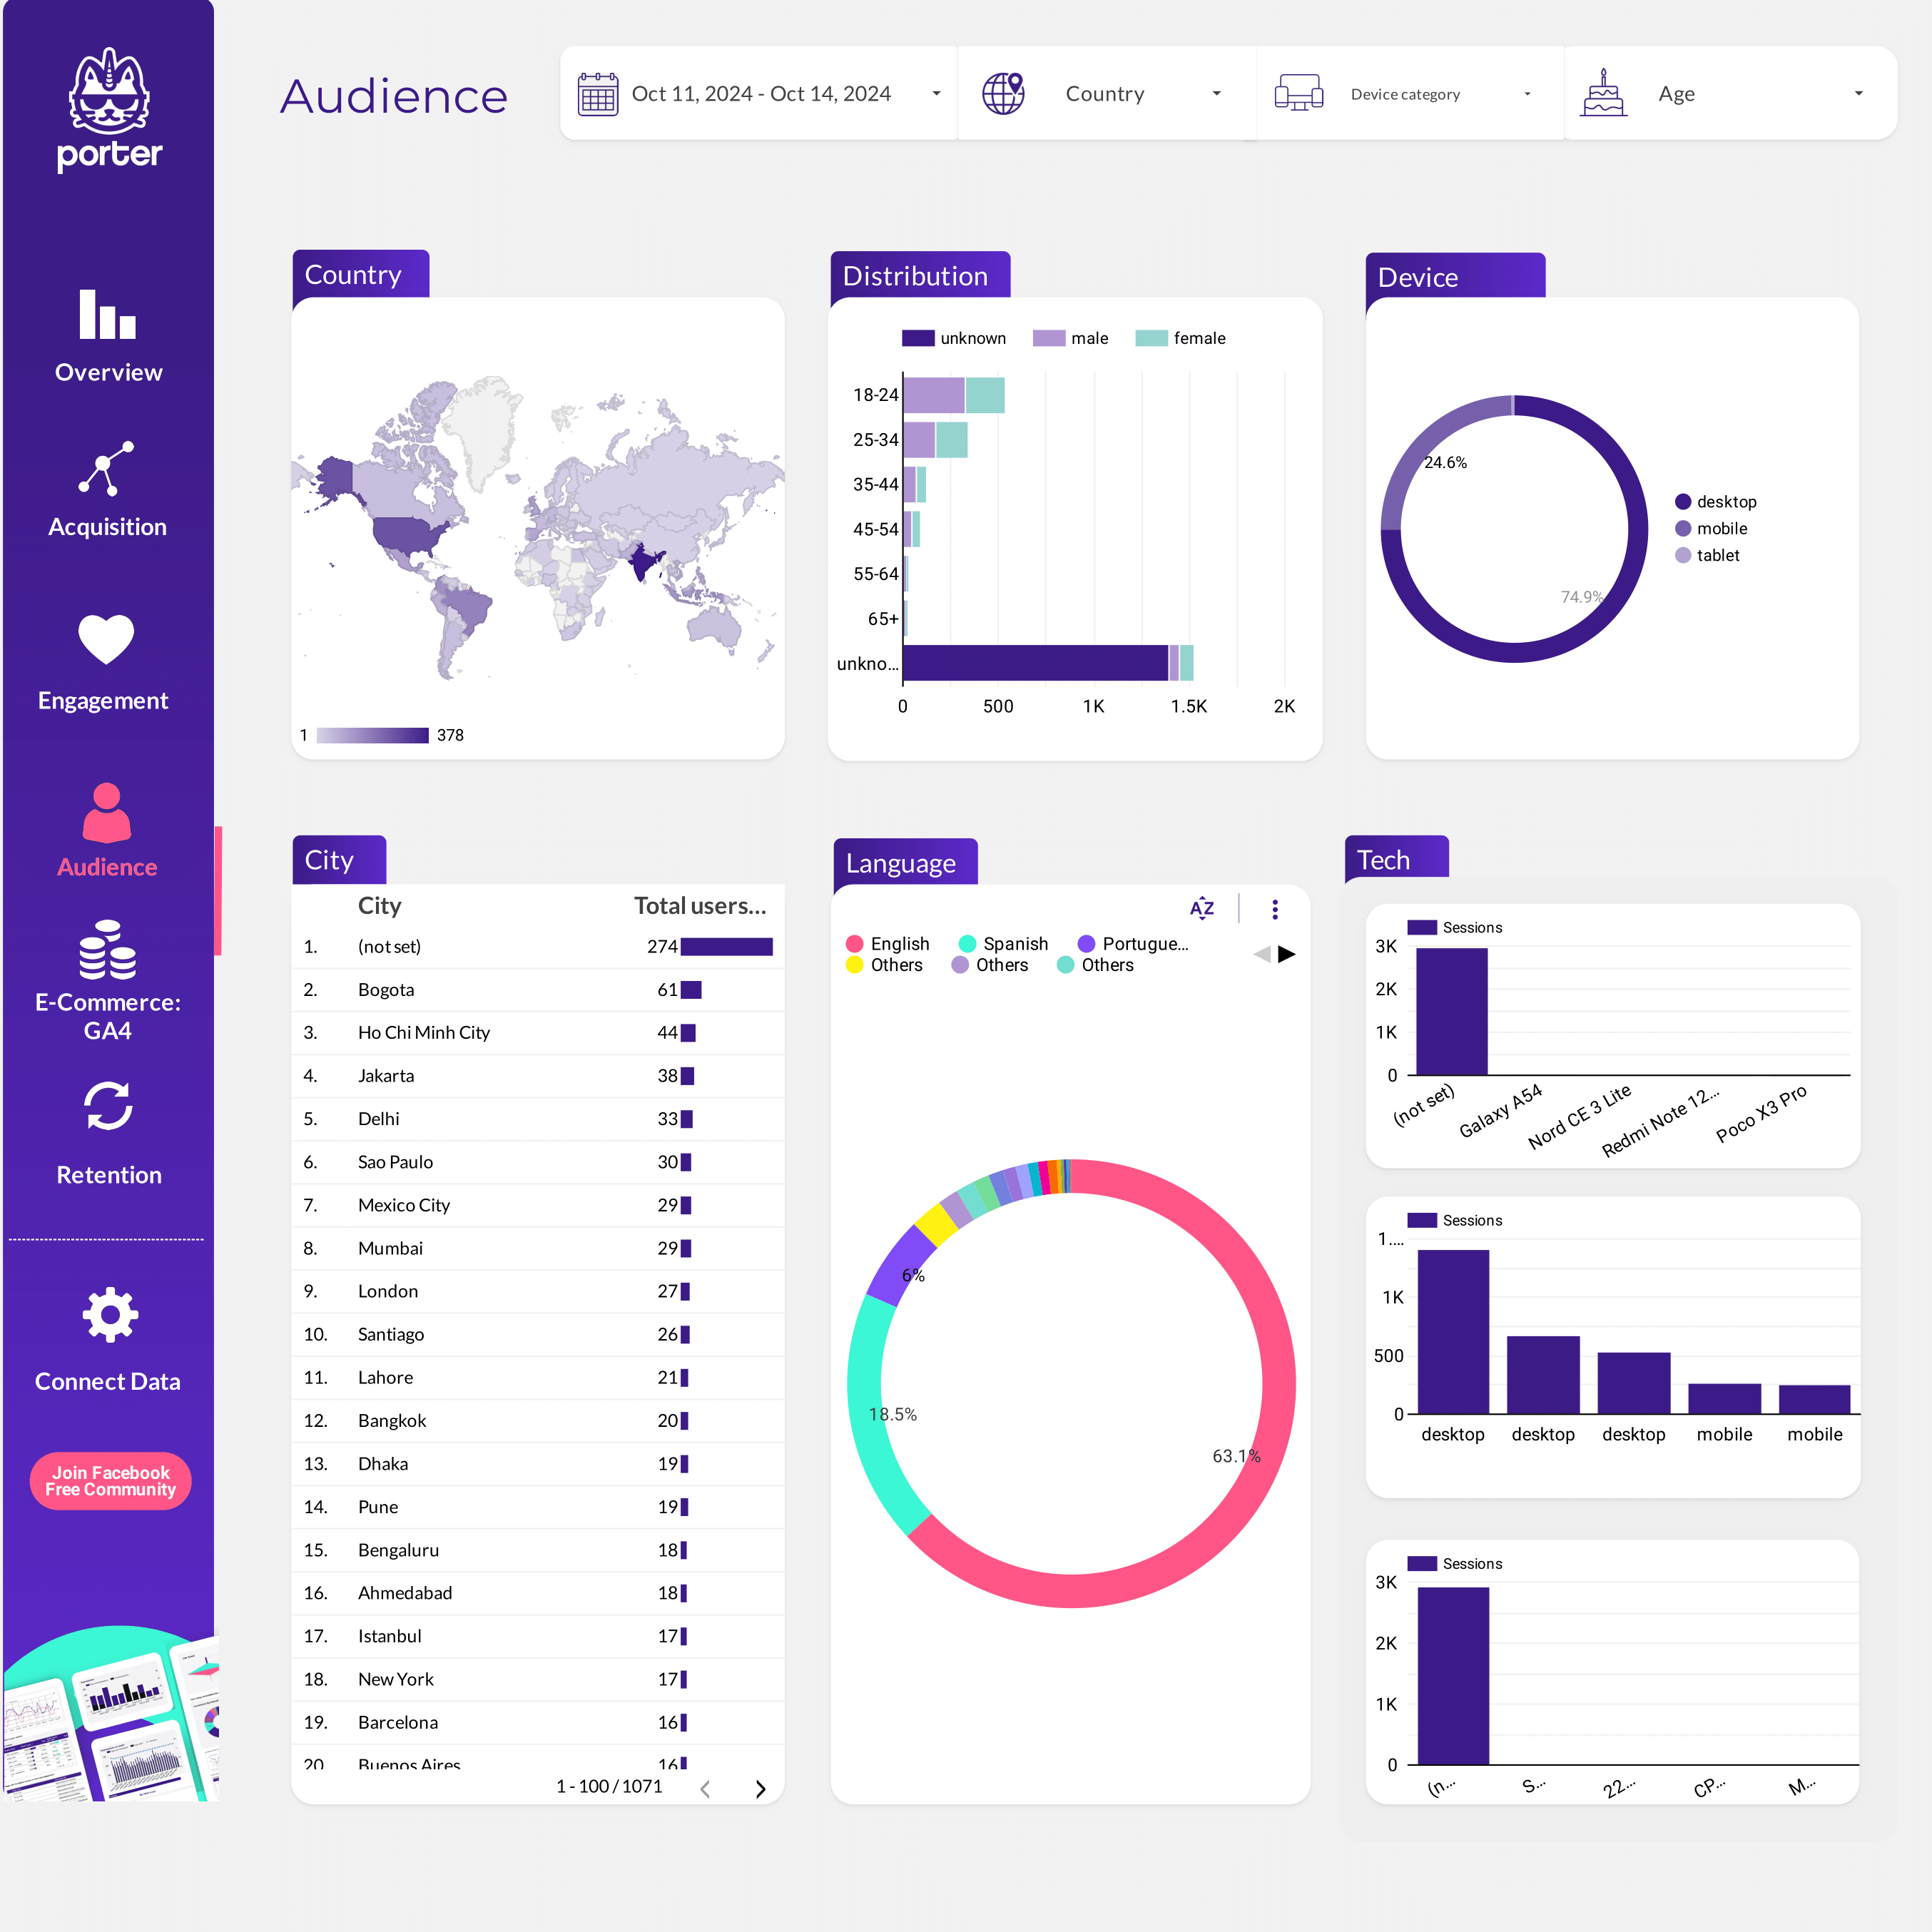
Once the data is ready, make sure to add buttons and filters to make your reports interactive, use custom colors and logos to make it white-label, and share via link, PDF, or email so your teams or clients can access it.
To build a Google Analytics 4 Audience dashboard, start by connecting your Google Analytics 4 data to platforms like Google Sheets or Google Looker Studio. Then, choose metrics such as Conversions, Conversion rate, User conversion rate, Engaged sessions, Average engagement time per session, Engagement rate, Active users, Total users, and New users to fully map your funnel. Segment and break down your data by channel, campaign, audience, product, or objective, using dimensions such as Campaign ID, Campaign name, Campaign medium, Audience name, Audience ID, and Audience description. The combination of these metrics and segmentation will help you spot trends and identify areas for optimization. Share your dashboard via PDF, scheduled emails, or links for easy access.
Yes, Looker Studio allows you to download your report as a PDF. To do it, follow these steps:
Before downloading your report choose the date range you want to visualize on your report.
Click on the “File” menu at the top left corner of the screen.
Select “Download as” from the drop-down menu and choose “PDF.”
You can choose which pages you want to download, and also you can add a password to protect the report and add a link back to the online report.
Click on “Download” to save the report on your device.