An Instagram Insights Post performance report should include the following metrics:
1. Impressions
2. Reach
3. Engagement (likes, comments, shares, saves)
4. Clicks
5. Profile Visits
6. Follower Growth
7. Post Type
8. Post ID
9. Post Caption
10. Date
11. Campaign Name
12. Location
13. Hashtags
These metrics provide a comprehensive overview of how a post is performing on Instagram.
To analyze Instagram Insights post performance data, focus on key metrics such as impressions, reach, engagement, likes, comments, shares, saves, and profile visits. Evaluate how these metrics align with your goals, such as increasing brand awareness or driving engagement. Compare performance across different post types, dates, and campaigns to identify trends and successful strategies. Additionally, consider follower growth and the impact of hashtags and locations on post performance. Use this analysis to refine your content strategy and optimize future posts for better results.
To build an Instagram Insights Post performance dashboard, follow these steps:
1. **Data Collection**: Use Instagram’s API or third-party tools to collect data on key metrics such as impressions, clicks, engagement, reach, likes, comments, shares, saves, profile visits, and follower growth.
2. **Data Organization**: Organize the data by campaign name, date, post type, post ID, post caption, location, and hashtags to provide context for each post’s performance.
3. **Dashboard Design**: Use a data visualization tool like Google Data Studio, Tableau, or Power BI to create the dashboard. Include visual elements like charts and graphs to represent each metric.
4. **Metric Analysis**: Display metrics such as impressions, engagement rate, and follower growth to analyze post performance. Use filters to allow users to view data by specific campaigns, dates, or post types.
5. **Insights and Reporting**: Provide insights on trends and patterns in post performance. Include options for exporting reports for further analysis or sharing with stakeholders.
By following these steps, you can create a comprehensive dashboard to monitor and analyze Instagram post performance effectively.
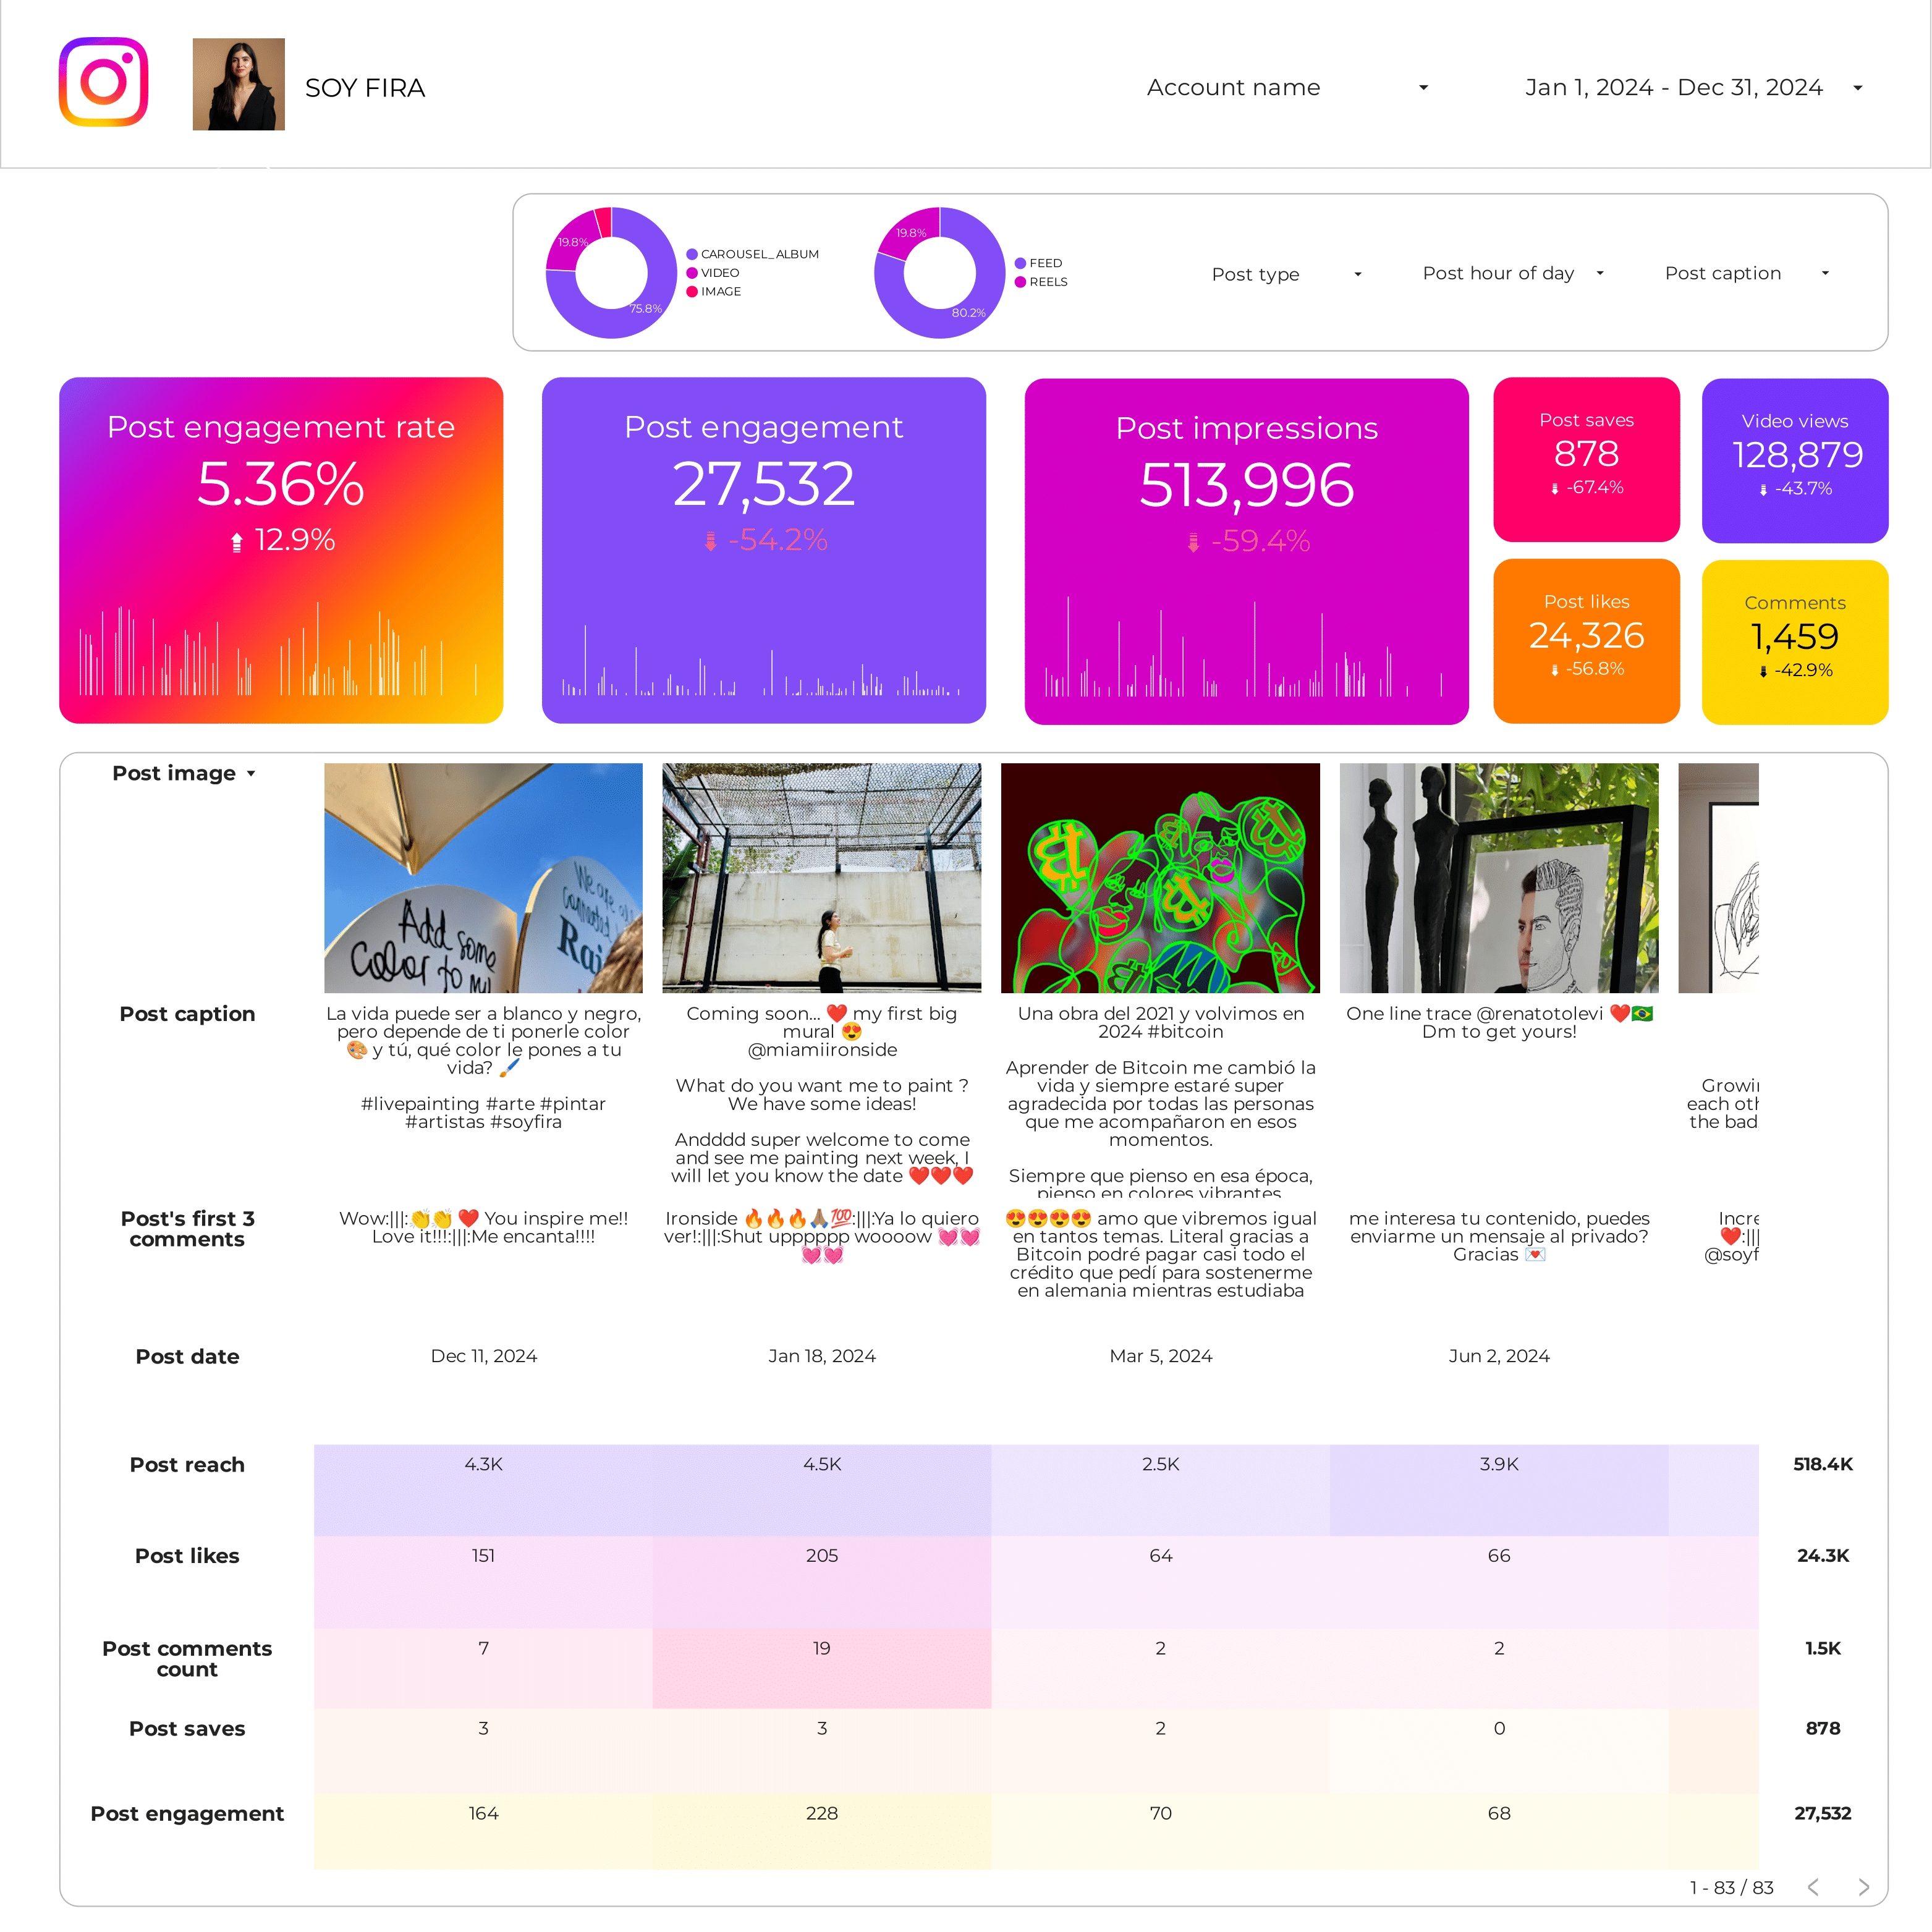
An Instagram Insights Post performance dashboard is a tool that provides detailed analytics on the performance of individual Instagram posts. It includes metrics such as impressions, clicks, engagement, reach, likes, comments, shares, saves, profile visits, and follower growth. This dashboard helps users understand how their content is performing on social media, allowing them to optimize their strategies for better engagement and reach.
I don’t know if you can download the template in PDF format based on the provided context.


 Instagram Insights
 Impressions