A Google Analytics 4 E-commerce report should include metrics such as conversion metrics like Purchase rate, Add-to-cart rate, and Cart-to-detail rate; engagement metrics like Engagement rate, Average engagement time, and Scroll depth; and visibility metrics like Impressions, Viewable impressions, and Visible time.
Then, segment and filter this data by dimensions like Campaign ID, Campaign Name, Campaign Source, User type, Session default channel group, New vs returning, and by hour, day, week, month, quarter, or year.
Once the data is ready, make sure to add buttons and filters to make your reports interactive, use custom colors and logos to make it white-label, and share via link, PDF, or email so your teams or clients can access it.
To analyze Google Analytics 4 E-commerce data, follow these steps:
1) Define your use case: Determine if the analysis is for a client presentation, performance monitoring, or an ad hoc analysis.
2) Define your metrics: Focus on key metrics such as revenue, cost, and funnel metrics like visibility (e.g., product views), engagement (e.g., add-to-cart actions), and conversion metrics (e.g., purchase completions).
3) Add context: Compare these metrics over time, against objectives, or in relation to cost (efficiency metrics) and initial input (effectiveness metrics). For example, analyze how revenue trends over different quarters or compare conversion rates against set targets.
4) Segment your data: Break down the data by channel (e.g., organic search, paid ads), objective (e.g., increasing sales, brand awareness), campaign (e.g., holiday sales, new product launch), product (e.g., electronics, apparel), and time (e.g., monthly, quarterly).
Example: To analyze an e-commerce site’s performance for a quarterly report, choose metrics like product visibility (page views), engagement (cart additions), and conversion (purchase rate). Add context by comparing these metrics to previous quarters and against sales targets. Segment the data by marketing channel (e.g., email vs social media), campaign (e.g., summer sale), and product category (e.g., electronics vs clothing) to identify which strategies and products are performing best.
To build a Google Analytics 4 E-commerce dashboard, start by connecting your E-commerce data such as Google Analytics 4 to platforms like Google Sheets or Google Looker Studio. Then, choose the metrics such as Purchase rate, Add-to-cart rate, Cart-to-detail rate, Engagement rate, Average engagement time, Scroll depth, Impressions, Viewable impressions, and Visible time to fully map your funnel. Segment and break down your data by channel, campaign, audience, product, or objective, with dimensions such as Campaign ID, Campaign Name, Campaign Source, User type, Session default channel group, and New vs returning. The combination of these metrics and segmentation will help you spot trends and identify areas for optimization. Share your dashboard via PDF, scheduled emails, or links for easy access.
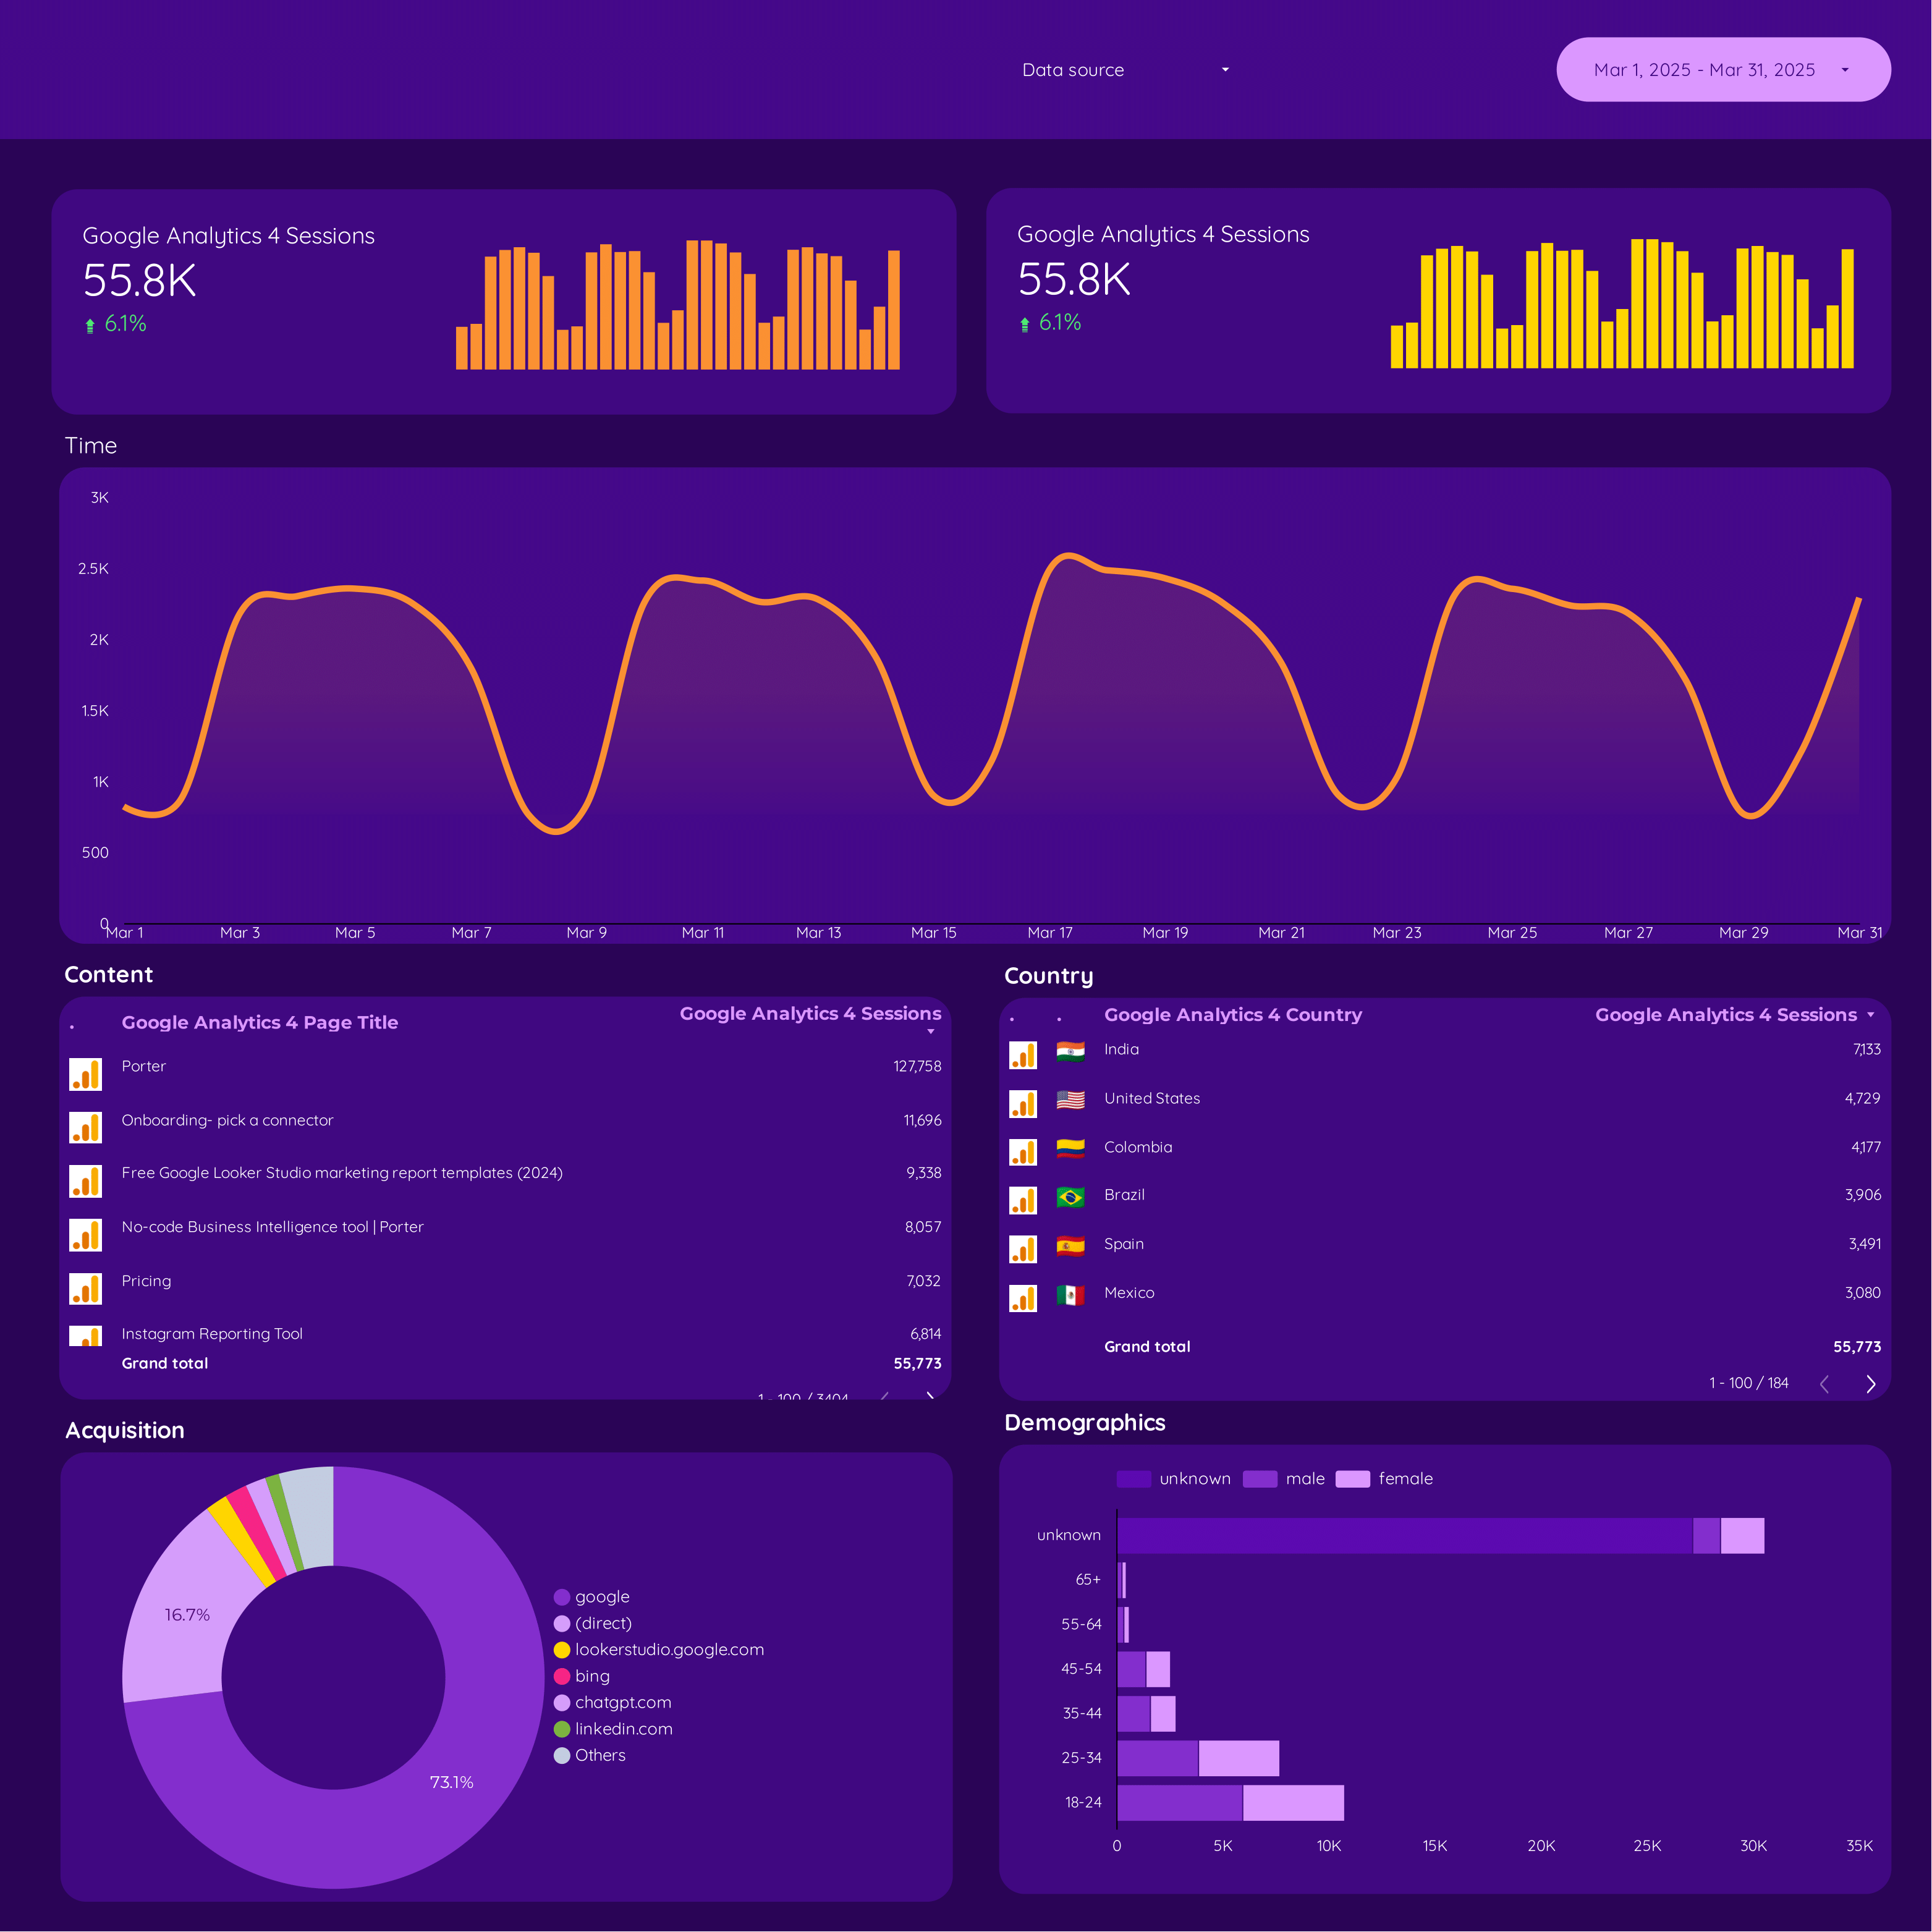
A Google Analytics 4 E-commerce dashboard is a tool that provides a visual representation of key e-commerce metrics and data collected through Google Analytics 4. It typically includes metrics such as ad spend, impressions, clicks, transactions, revenue, conversion rate, average order value, and more. This dashboard helps businesses analyze their e-commerce performance, track user behavior, and make data-driven decisions to optimize their online sales and marketing strategies.
Yes, Looker Studio allows you to download your report as a PDF. To do it, follow these steps:
Before downloading your report choose the date range you want to visualize on your report.
Click on the “File” menu at the top left corner of the screen.
Select “Download as” from the drop-down menu and choose “PDF.”
You can choose which pages you want to download, and also you can add a password to protect the report and add a link back to the online report.
Click on “Download” to save the report on your device.


 Google Analytics 4
 Ad Spend