A Google Analytics 4 report should include breaking down metrics by visibility, engagement, and conversion metrics. It should also segment data by campaign, channel, audience, content, objective, and date. For example, include the number of page views, average time on page, and conversion rate. Segment data by campaign to analyze the performance of different marketing campaigns. Segment data by channel to understand the effectiveness of various marketing channels. Segment data by audience to identify the demographics and behaviors of different user groups. Segment data by content to measure the performance of different content types. Segment data by objective to track the achievement of specific goals. Segment data by date to identify trends and patterns over time. Keep the report concise while including all these elements.
To analyze website data in Google Analytics 4, include the following elements:
1) Choose visibility metrics: Track page views, unique visitors, bounce rate, and time spent on page.
2) Break engagement metrics: Monitor average session duration, pages per session, and click-through rates.
3) Include conversion metrics: Measure goal completion, conversion rate, and eCommerce sales.
4) Add context by comparing metrics: Compare against previous date ranges, cost per acquisition, and conversion rates against industry benchmarks.
5) Segment data by campaign: Analyze performance based on different marketing campaigns.
6) Segment data by channel: Compare performance across different channels like organic search, social media, and referral traffic.
7) Segment data by audience: Analyze user behavior based on demographics, interests, or location.
8) Segment data by content: Evaluate performance based on specific landing pages or blog posts.
9) Segment data by objective: Identify the impact of different objectives such as lead generation or product sales.
10) Segment data by date: Analyze trends and performance over specific time periods.
For example, compare the conversion rate of a specific marketing campaign against the overall conversion rate for the website.
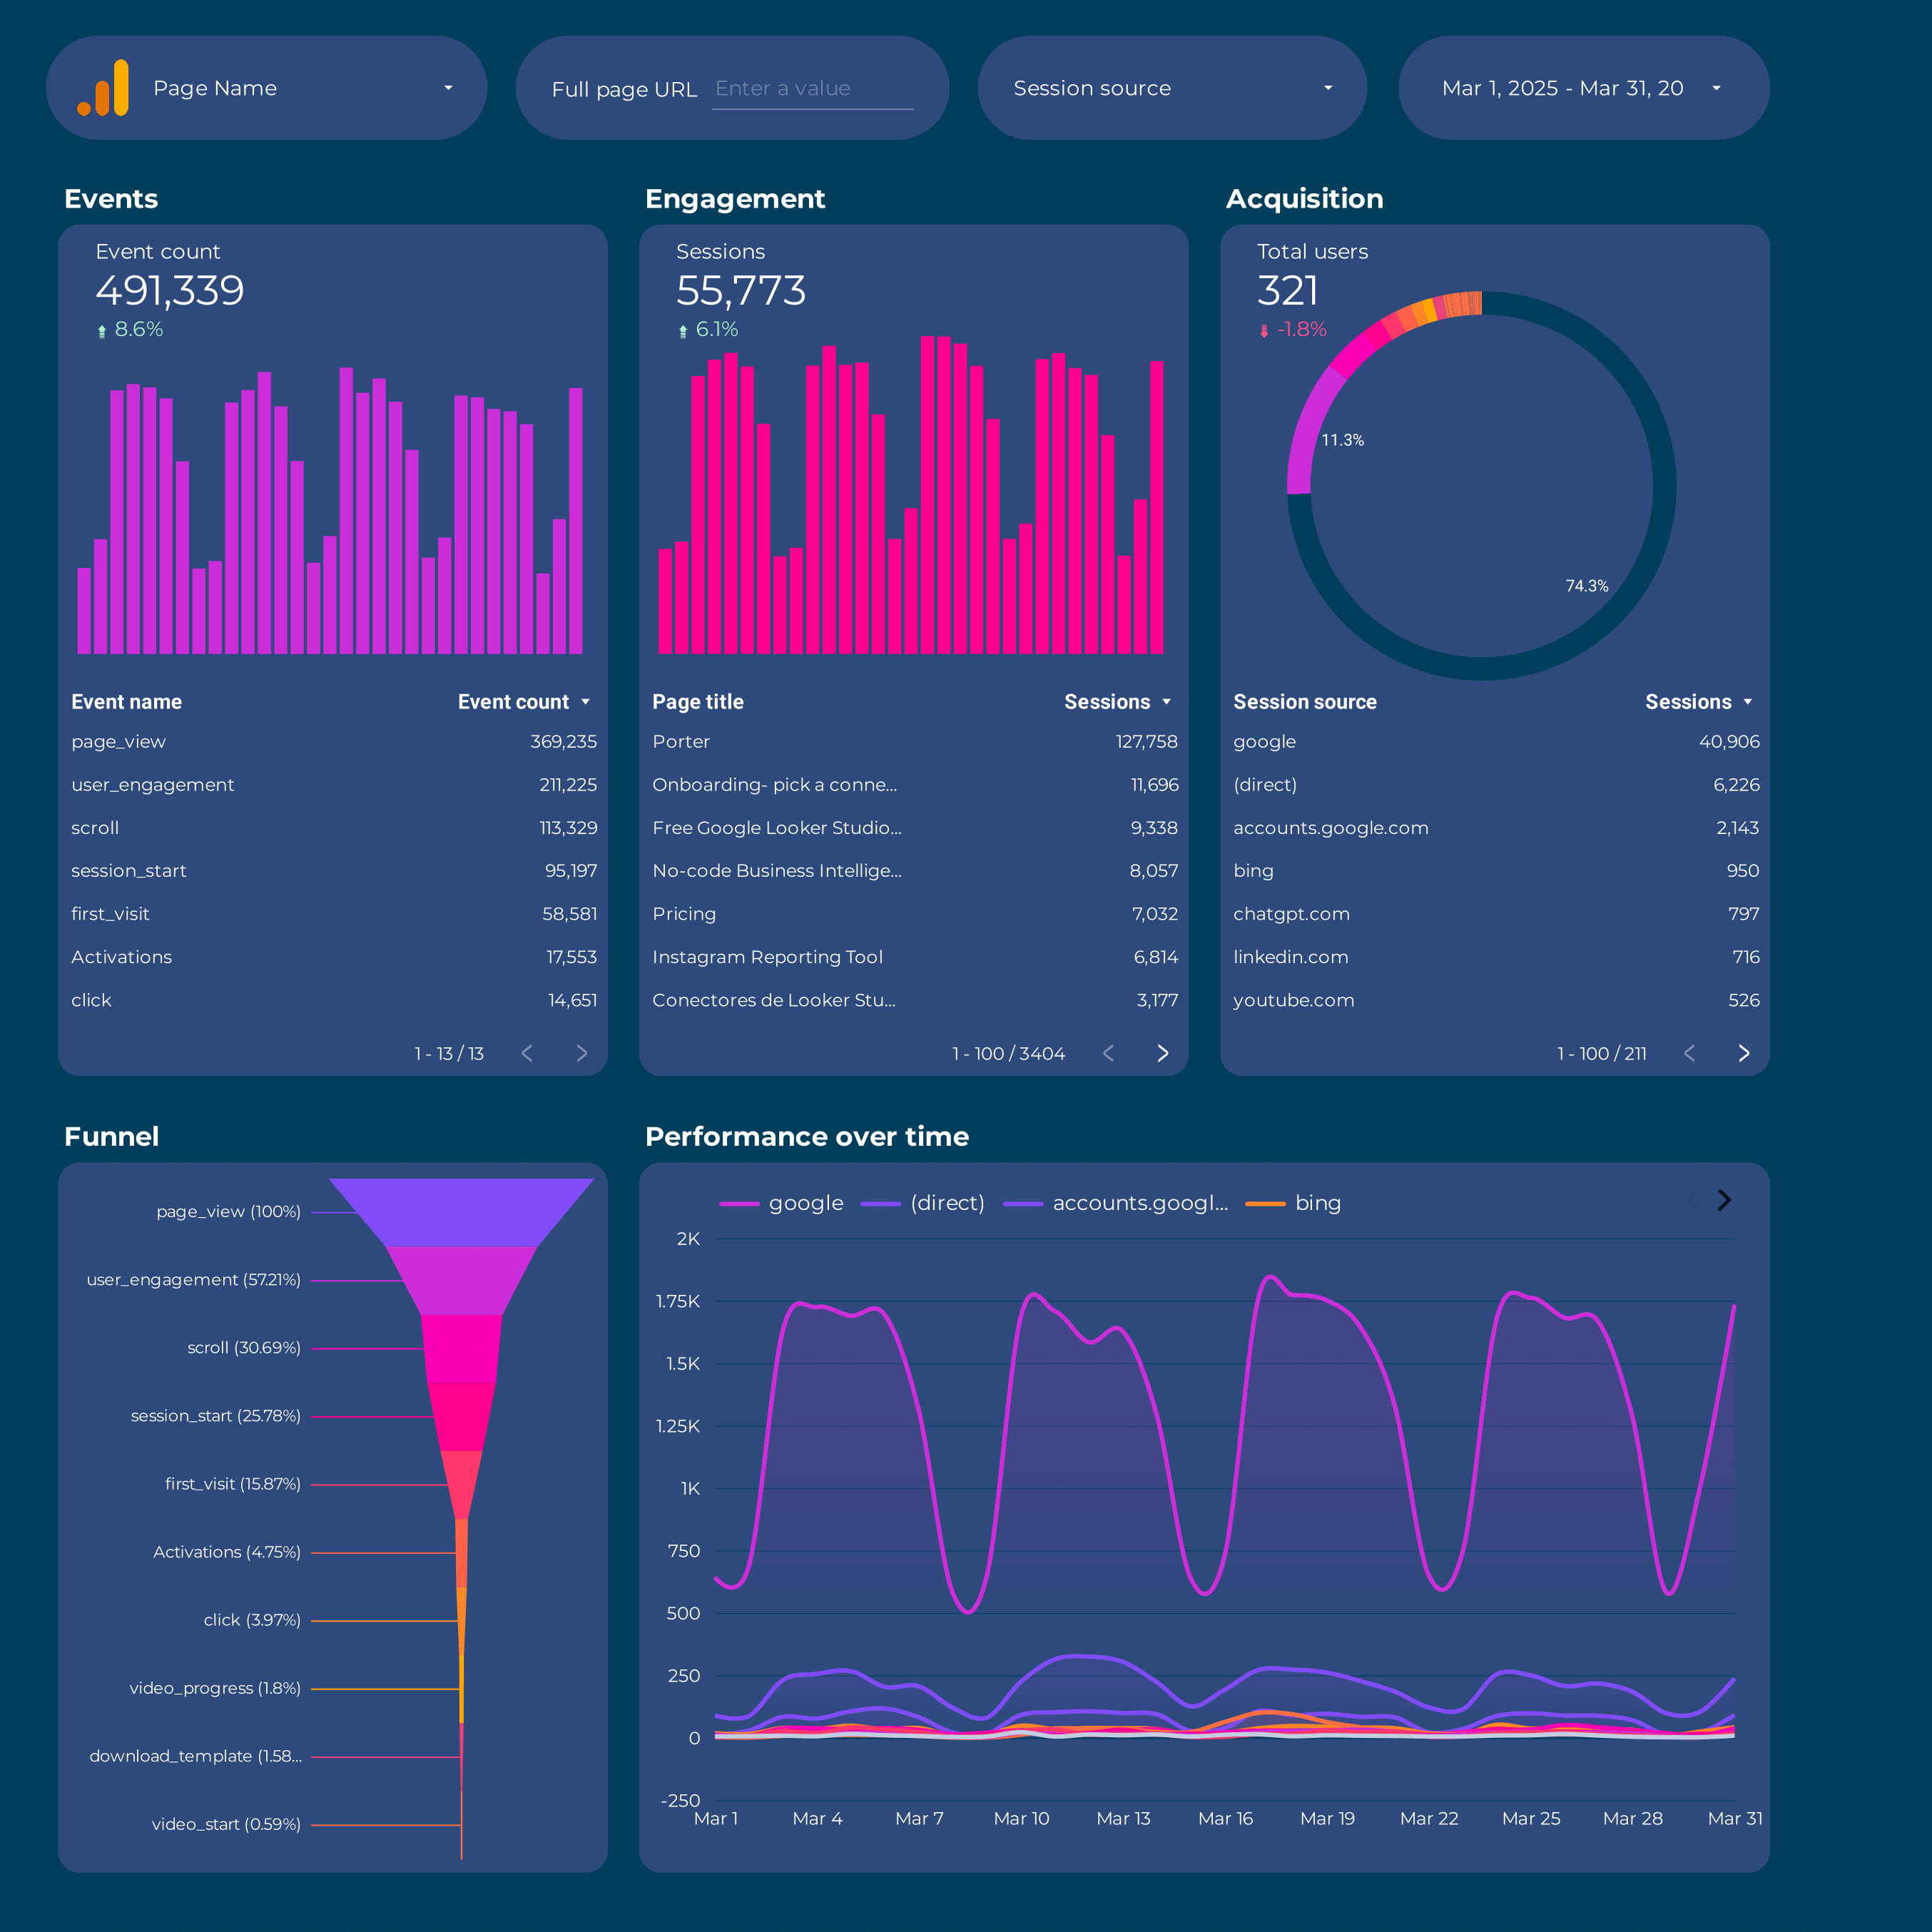
To build a Google Analytics 4 dashboard, 1) connect your website and social media accounts to gather data. 2) Select metrics such as user engagement, bounce rate, and conversion rate to monitor performance. 3) Segment data by campaign, channel, audience, product, customer content, objective, and date for detailed analysis. 4) Add filters or buttons like ‘user type’, ‘session duration’, or ‘traffic source’ to make your report interactive. 5) Share your dashboard via PDF, scheduled emails, or links for easy access.
A Google Analytics 4 dashboard is a visual representation of key metrics and data that provides insights into a business’s performance. It is significant for businesses as it allows them to monitor real-time data, track KPIs, and make data-driven decisions. Tools like Looker Studio are commonly used to create these dashboards, which typically include elements like traffic sources, user behavior, and conversion rates. Real-time data monitoring is crucial as it enables businesses to respond quickly to changes. For learning how to create a marketing dashboard using Looker Studio, check out our YouTube channel: https://www.youtube.com/@porter.metrics.
Yes, Looker Studio allows you to download your report as a PDF. To do it, follow these steps:
Before downloading your report choose the date range you want to visualize on your report.
Click on the “File” menu at the top left corner of the screen.
Select “Download as” from the drop-down menu and choose “PDF.”
You can choose which pages you want to download, and also you can add a password to protect the report and add a link back to the online report.
Click on “Download” to save the report on your device.


 Google Analytics 4
 Ad Spend