Free CPL Calculator (Template included)
Enter total marketing spend and number of leads acquired to calculate CPL, showing cost per lead in real-time.
Free YouTube CPM Calculator (Template included)
The YouTube CPM Calculator estimates ad costs by inputting total ad spend and impressions, calculating cost per 1,000 views.
Free Shopify Conversion Rate Calculator (Template included)
Enter the number of conversions and total visitors to calculate your Shopify store’s conversion rate. The calculator provides a percentage, helping you assess your store’s performance.
Modelo de relatório de Rastreador de posicionamiento de palabras clave SEO para agências e equipes de marketing
Optimiza tu estrategia con la plantilla de informe de seguimiento de ranking de palabras clave SEO. Mide métricas clave como tasas de conversión, ROI y tasas de clics. Analiza rankings de palabras clave orgánicas y pagadas, insights demográficos y comportamiento en línea. Segmenta datos por periodos de tiempo. Perfecto para equipos de marketing que buscan consolidar insights de rendimiento y alcanzar objetivos específicos.
Modelo de relatório de Embudo de Facebook Ads para agências e equipes de marketing
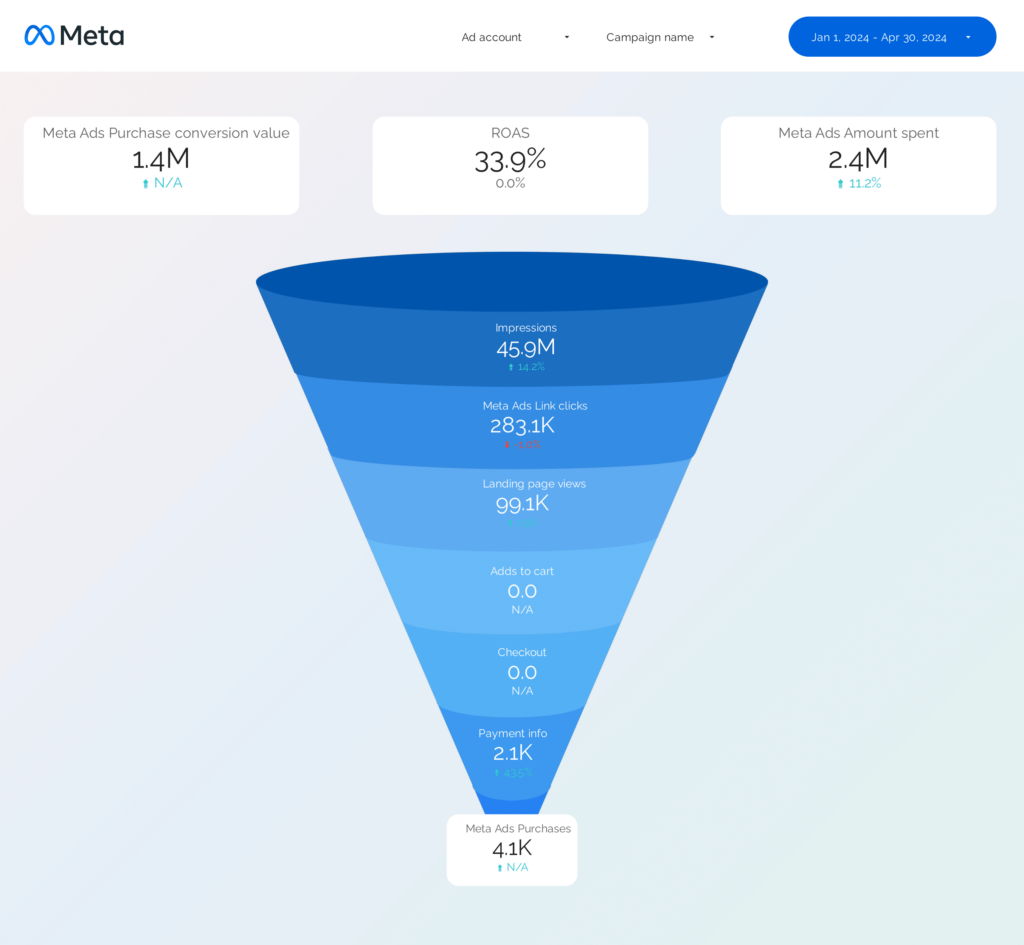
Optimiza tu embudo de anuncios de Facebook con esta plantilla de informe. Rastrea CTR, tasa de conversión, CPA y más. Analiza la segmentación de audiencia, el diseño de anuncios y la estrategia de ubicación. Segmenta por demografía y comportamiento. Ideal para especialistas en PPC y medios pagados para mejorar el rendimiento de las campañas y alcanzar los objetivos de marketing. Perfecto para comprender el alcance, las impresiones y el tráfico de búsqueda orgánica.
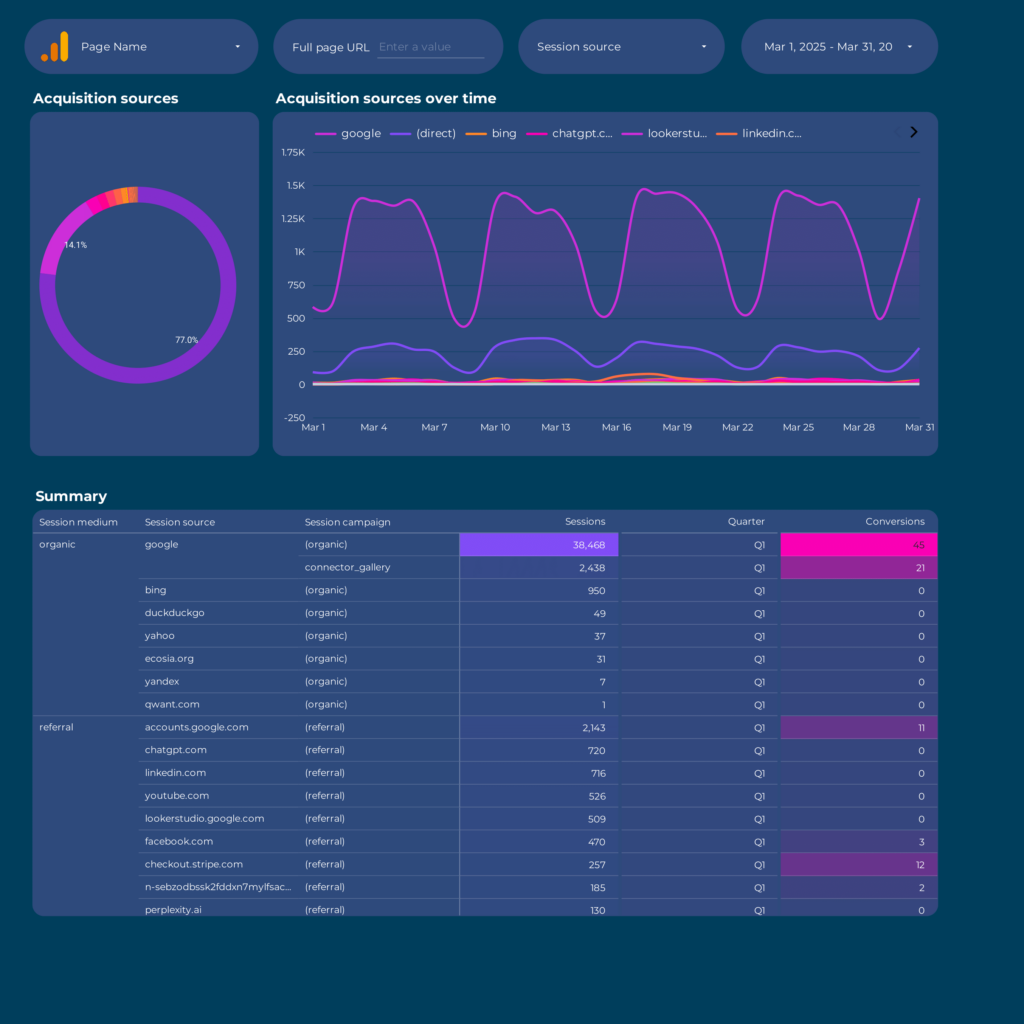
Modelo de relatório de Generación de demanda para agências e equipes de marketing
Optimiza la generación de demanda B2B con esta plantilla de reporte. Rastrea las tasas de conversión, el costo por conversión y las tasas de click-through. Analiza las comparticiones e impresiones en redes sociales. Integra datos de CRM, E-commerce, Facebook Ads, Google Analytics 4 y LinkedIn Ads. Segmenta por demografía y tiempo para obtener insights estratégicos. Ideal para equipos de marketing enfocados en el rendimiento.
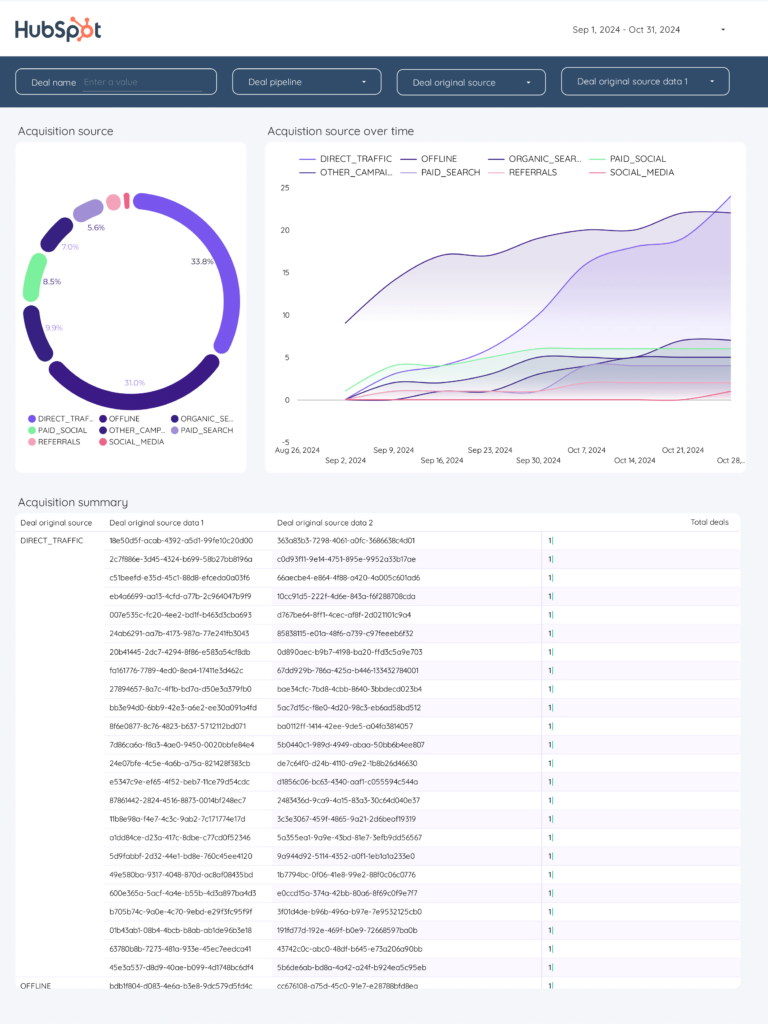
Modelo de relatório de Adquisición para agências e equipes de marketing
Esta plantilla de informe de Adquisición ayuda a los equipos de marketing a rastrear métricas clave como la tasa de conversión, ROI y CTR. Analiza dimensiones como el público objetivo y los objetivos de la campaña. Integra datos de Google Analytics 4, Copy y PPC. Ideal para medir el rendimiento y refinar estrategias para cumplir con objetivos específicos.