


How to add charts and graphs to Looker Studio
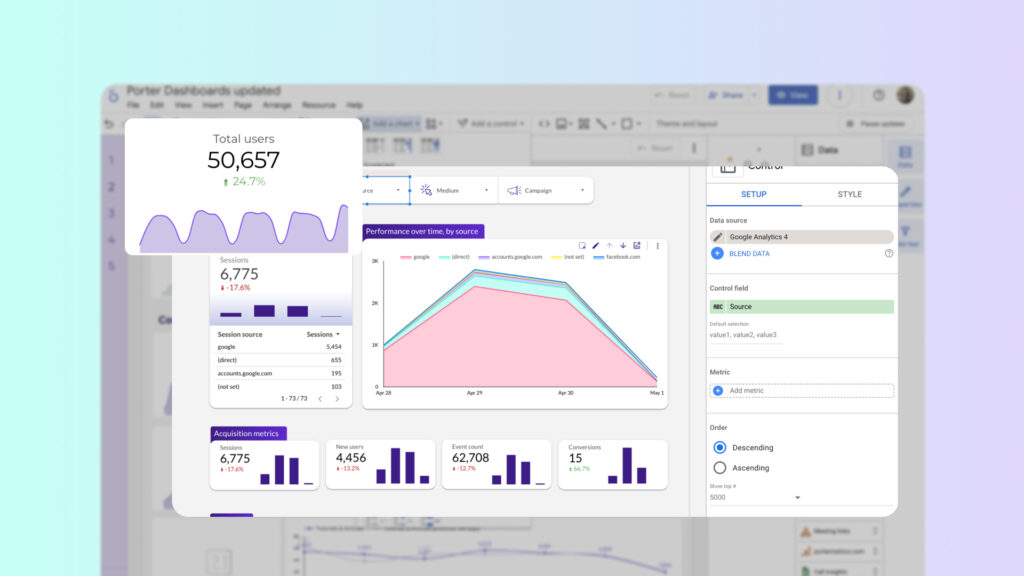
To create a good report you have to understand how to create and edit charts on Looker Studio. If you want better reports, you have to understand: Combining these two ideas will help you create engaging, useful reports. I will cover the step-by-step process of creating charts, the different types, customization options, and interactive filters- […]