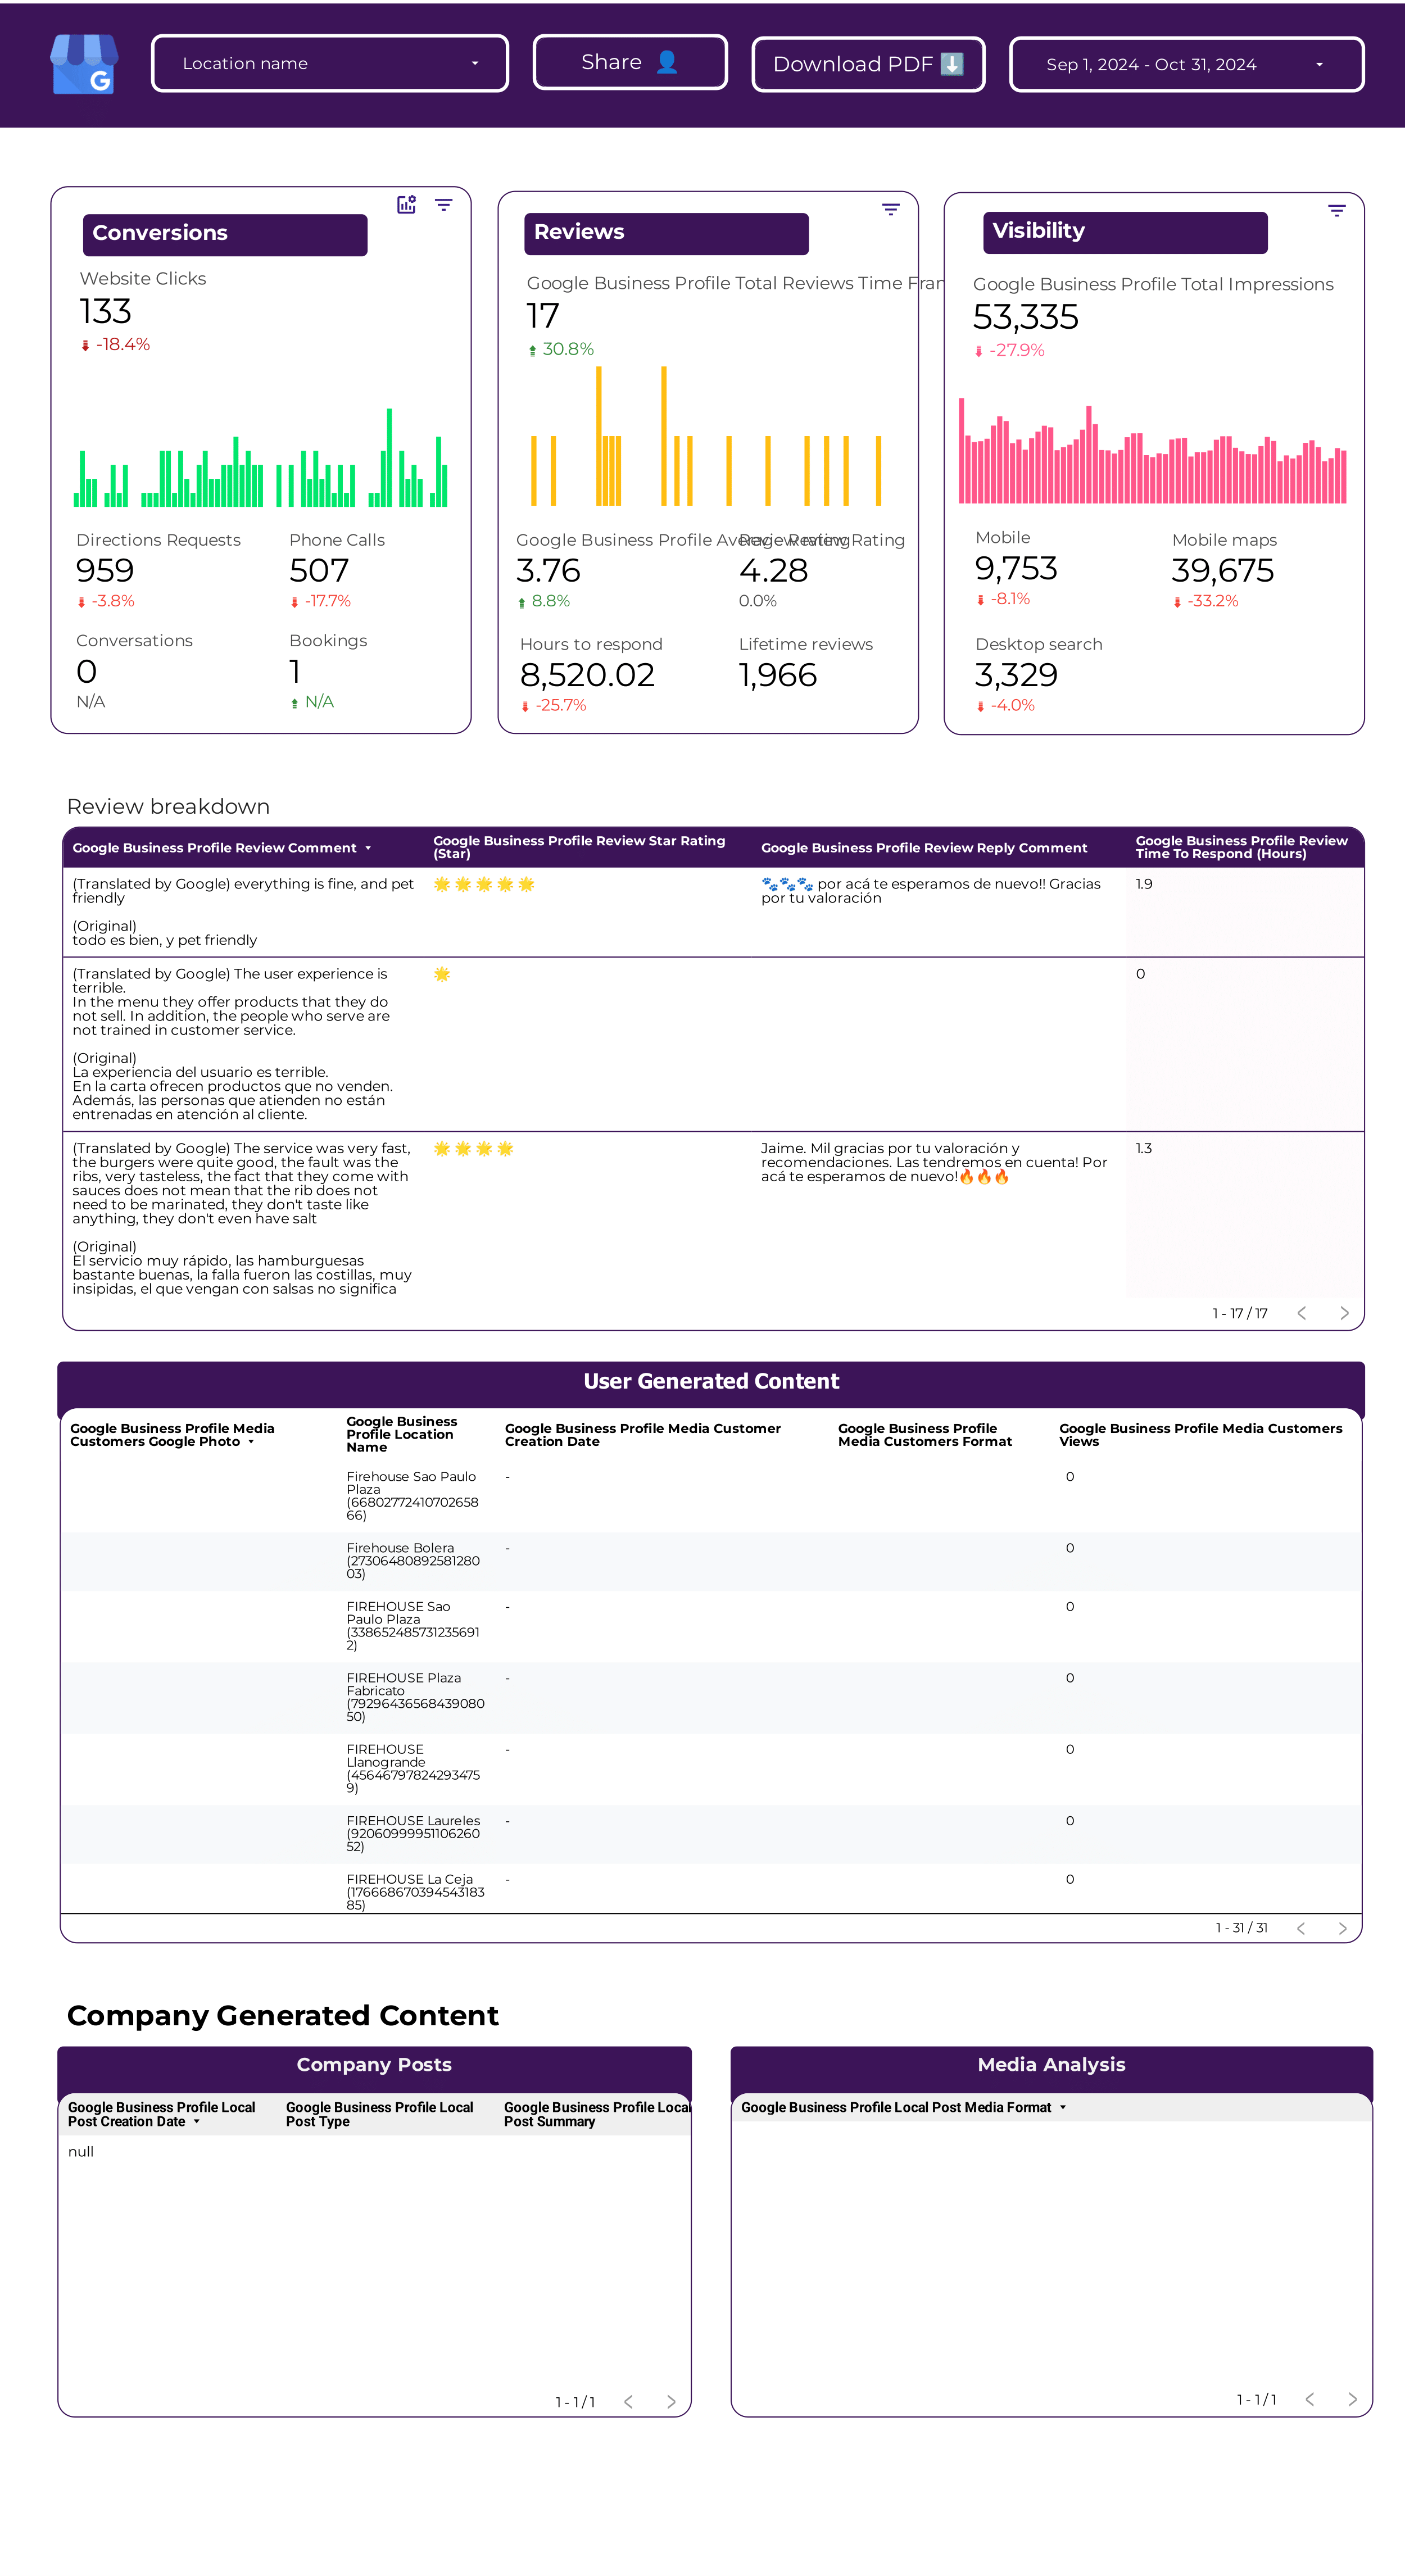
A Google Business Profile report should include metrics such as visibility (impressions, reach), engagement (clicks, actions), and conversion (conversions, revenue). Data should be segmented by campaign, channel, audience, content, objective, and date for comprehensive analysis. For example, analyzing impressions by campaign can highlight the effectiveness of different marketing strategies, while segmenting conversion data by audience can identify the most profitable customer segments.
To analyze Google Business Profile data, follow these steps:
1) Choose metrics like visibility (impressions, views), engagement (clicks, likes), and conversion (calls, website visits).
2) Add context by comparing against cost (ROI), date range (weekly, monthly), goals (increase website traffic), rates (click-through rate), and benchmarks for the industry.
3) Segment data by campaign (ad campaigns, posts), channel (Google Search, Maps), audience (gender, age), content (photos, videos), objective (awareness, sales), and date. For example, compare impressions of an ad campaign on Maps versus Google Search.
To build a Google Business Profile dashboard, 1) connect your Google Business Profile data and accounts. 2) Select metrics such as views, clicks, and follower count to monitor performance. 3) Segment or break down data by campaign, channel, audience, product, customer content, objective, and date. For example, you can segment data by the number of views per product or clicks per campaign. 4) Add filters or buttons to make your report interactive, such as a filter for date range or a button to switch between different metrics. 5) Share your dashboard via PDF, scheduled emails, or links.
A Google Business Profile dashboard is a tool that allows businesses to manage and track their online presence across Google, including Search and Maps. It is significant as it helps businesses to interact with customers, understand and expand their online presence. The dashboard typically includes elements like business information, reviews, insights, and posts. Real-time data monitoring is crucial as it provides up-to-date insights, helping businesses make informed decisions. For learning how to create a marketing dashboard using Looker Studio, refer to our YouTube channel: https://www.youtube.com/@porter.metrics.
Yes, Looker Studio allows you to download your report as a PDF. To do it, follow these steps:
Before downloading your report choose the date range you want to visualize on your report.
Click on the “File” menu at the top left corner of the screen.
Select “Download as” from the drop-down menu and choose “PDF.”
You can choose which pages you want to download, and also you can add a password to protect the report and add a link back to the online report.
Click on “Download” to save the report on your device.


 Google Business Profile
 Impressions