A Google Ads report should include metrics categorized by visibility (impressions, reach), engagement (click-through rate, average session duration), and conversion (conversion rate, cost per conversion). The data should be segmented by campaign, channel (search, display), audience (age, location), content (keyword, ad group), objective (brand awareness, lead generation), and date. For example, a report may include a breakdown of impressions by campaign, click-through rate by channel, conversion rate by audience, and cost per conversion by content.
To analyze Google Ads data, first, choose key metrics such as impressions and click-through rate (visibility), time on site and bounce rate (engagement), and conversion rate and cost per acquisition (conversion). Break them down by visibility, engagement, and conversion metrics. Second, add context by comparing against the cost, date range, goals, and industry rates. For example, compare impressions against the cost to measure the effectiveness of your ad spend. Third, segment data by campaign, channel, audience, content, objective, and date. For instance, compare conversion rates for different audience segments or analyze engagement metrics based on the content type.
To build a Google Ads dashboard, 1) connect your Google Ads account and any other relevant data sources. 2) Choose metrics such as click-through rate, cost per click, and conversion rate to monitor performance. 3) Segment your data by campaign, channel, audience, product, customer content, objective, and date for detailed analysis. 4) Incorporate filters or buttons for interactivity, such as filtering by date range or campaign type. 5) Share your dashboard via PDF, scheduled emails, or direct links for easy access and review.
A Google Ads dashboard is a visual tool that presents key performance indicators (KPIs) related to Google Ads campaigns. It is significant for businesses as it helps them track and analyze their ad performance, optimize their strategies, and make data-driven decisions. Common tools used to create such a dashboard include Google Data Studio, Looker, and Tableau, and key elements typically include metrics like click-through rates, cost per click, conversion rates, and impressions. Real-time data monitoring is crucial as it allows businesses to react quickly to changes and optimize their campaigns accordingly. For learning how to create a marketing dashboard using Looker Studio, you can refer to our YouTube channel: https://www.youtube.com/@porter.metrics.
Can I download this template in PDF?
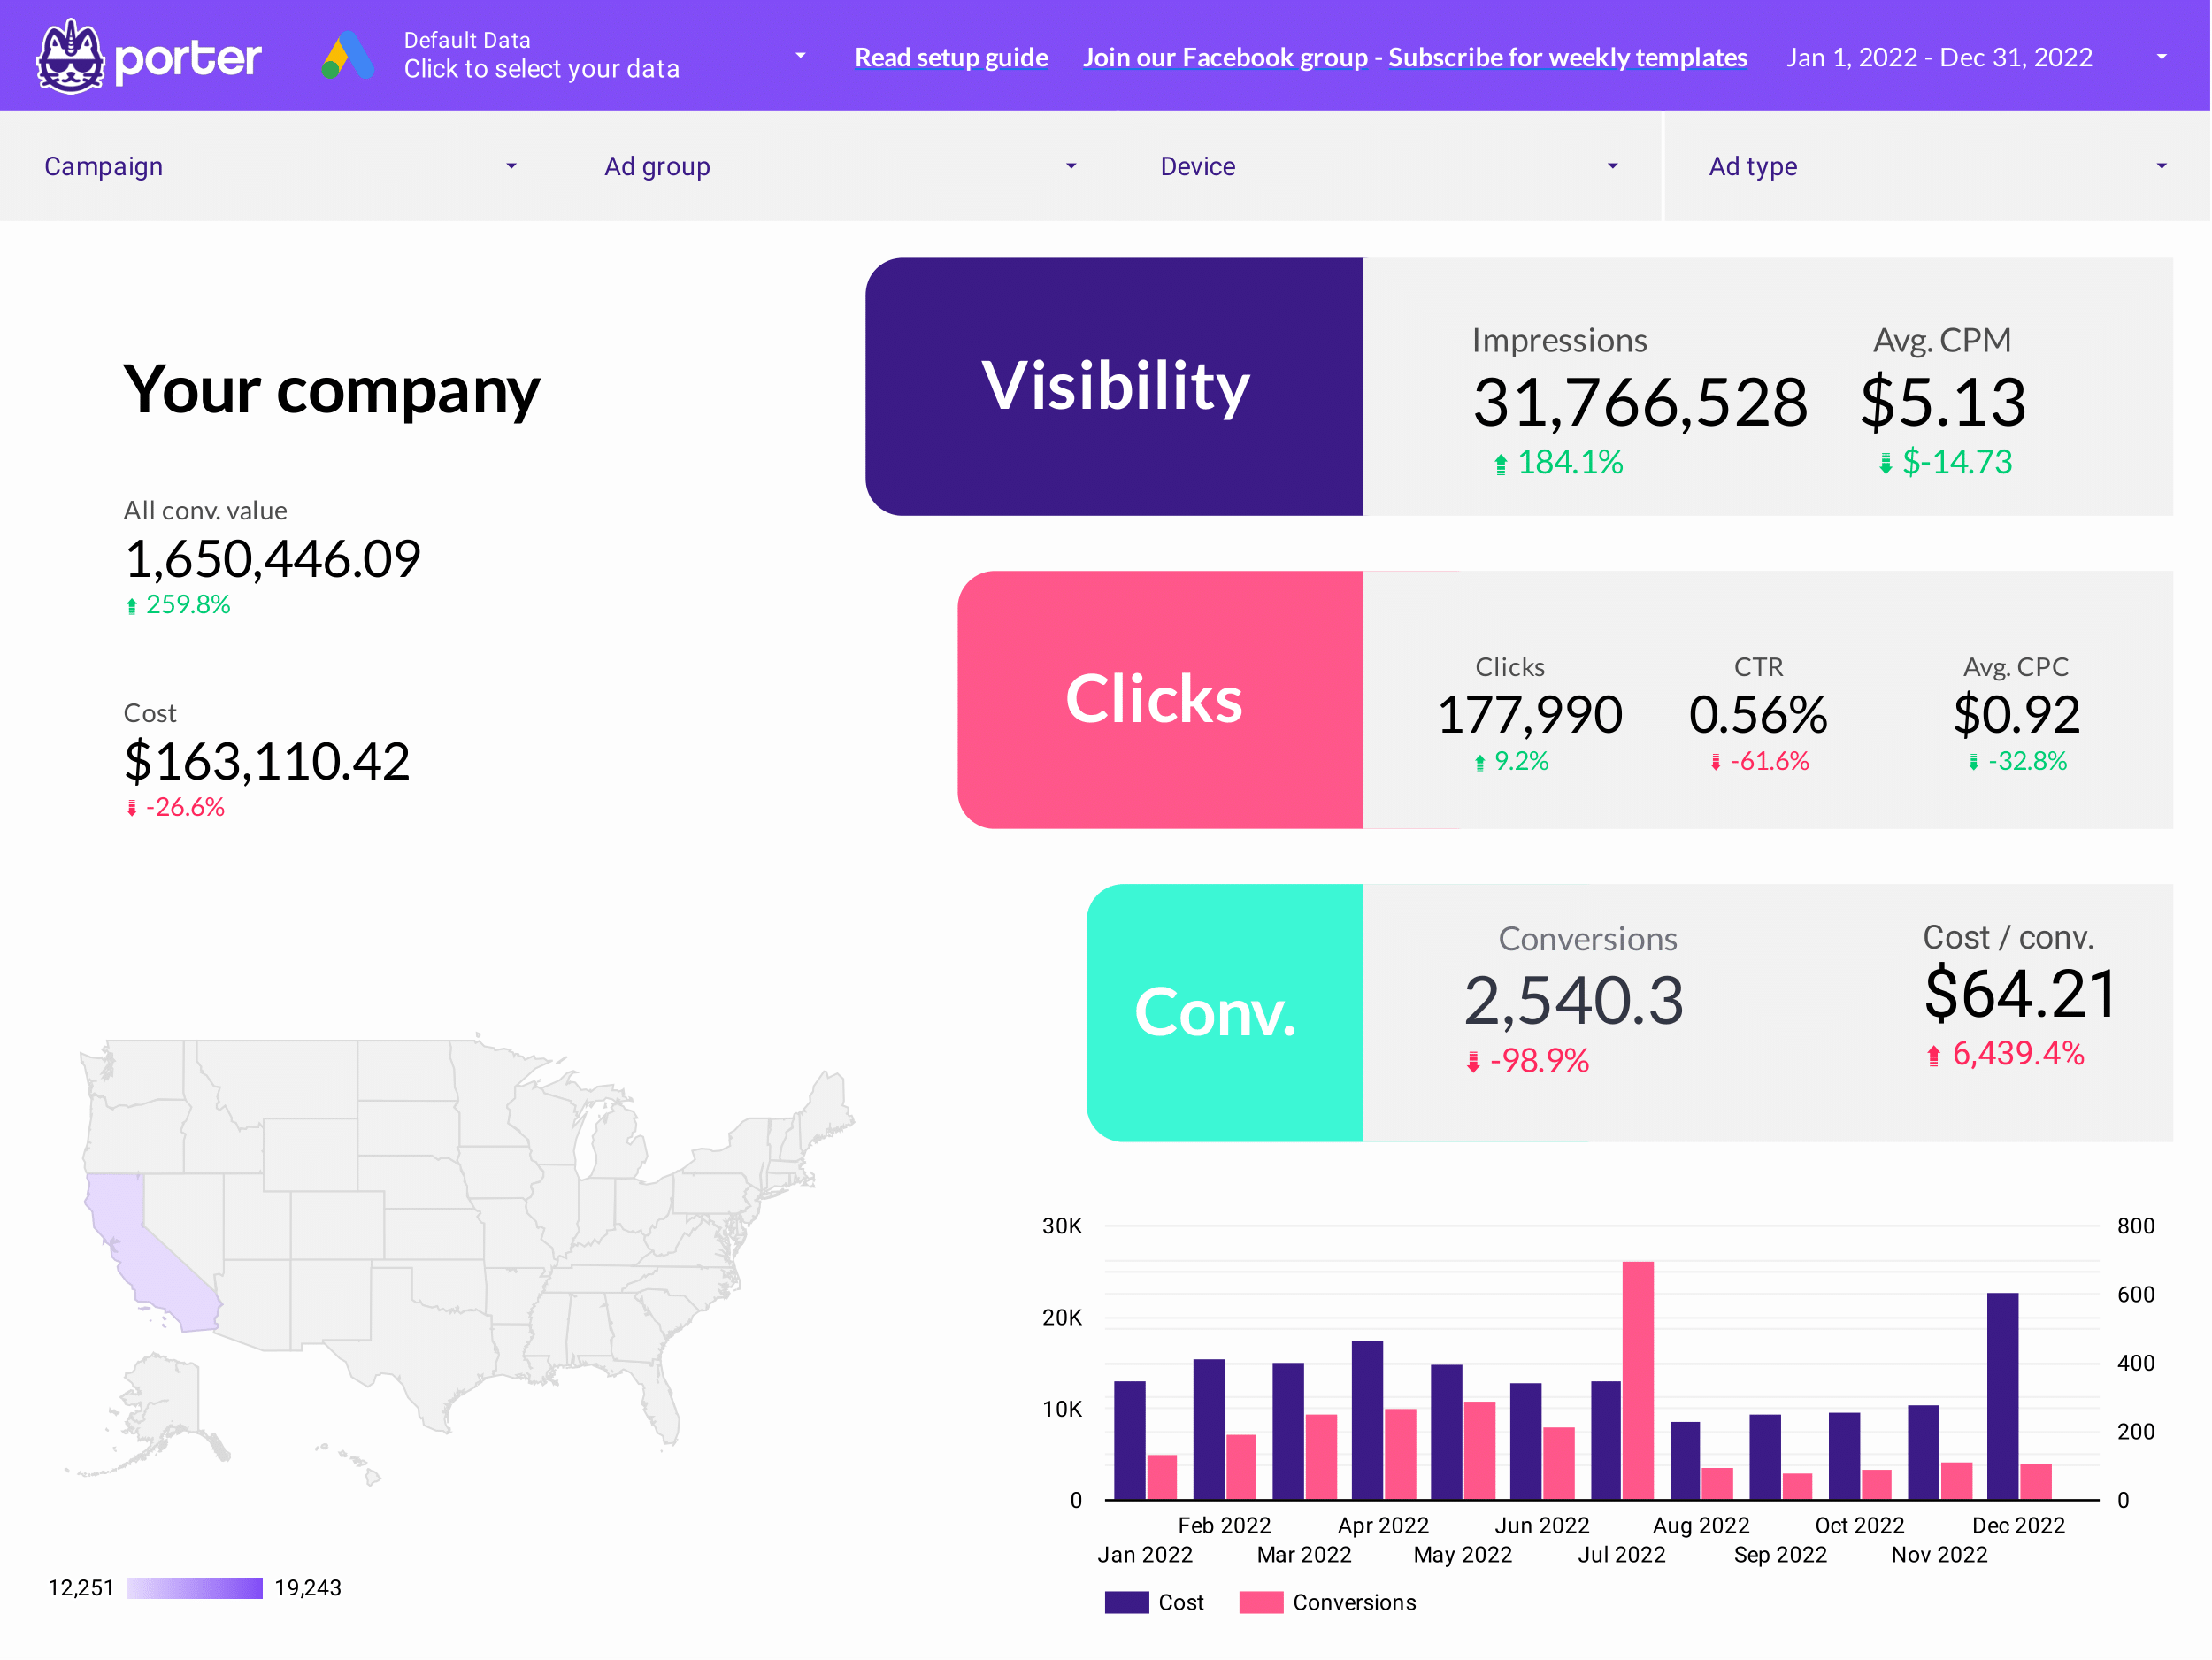


 Impressions
 Ad Spend