A Facebook Ads Audience report should include the following elements:
1. Impressions
2. Clicks
3. Ad Spend
4. Campaign Name
5. Date
6. CTR (Click-Through Rate)
7. CPC (Cost Per Click)
8. CPM (Cost Per Thousand Impressions)
9. Reach
10. Frequency
11. Ad Name
12. Ad Set Name
13. Objective
14. Placement
15. Age
16. Gender
17. Location
These metrics and attributes provide a comprehensive overview of the performance and demographics of your Facebook Ads audience.
To analyze Facebook Ads Audience data, focus on key metrics such as impressions, clicks, ad spend, CTR (Click-Through Rate), CPC (Cost Per Click), CPM (Cost Per Thousand Impressions), reach, and frequency. Evaluate the performance by comparing these metrics across different campaigns, ad sets, and ads. Consider audience demographics like age, gender, and location to understand which segments are most responsive. Analyze the data over time to identify trends and optimize targeting and budget allocation for better performance.
To build a Facebook Ads Audience dashboard, follow these steps:
1. **Data Collection**: Use Facebook Ads Manager to export data related to your campaigns. Ensure you include metrics such as Impressions, Clicks, Ad Spend, CTR, CPC, CPM, Reach, Frequency, and demographic details like Age, Gender, and Location.
2. **Choose a Dashboard Tool**: Select a dashboard tool like Google Data Studio, Tableau, or Power BI that can integrate with Facebook Ads data.
3. **Data Integration**: Connect your Facebook Ads data to the dashboard tool. This can be done through direct integration or by importing data files.
4. **Design the Dashboard**: Organize the dashboard to display key metrics. Use visual elements like charts and graphs to represent data such as:
– Campaign performance (Impressions, Clicks, CTR)
– Cost analysis (Ad Spend, CPC, CPM)
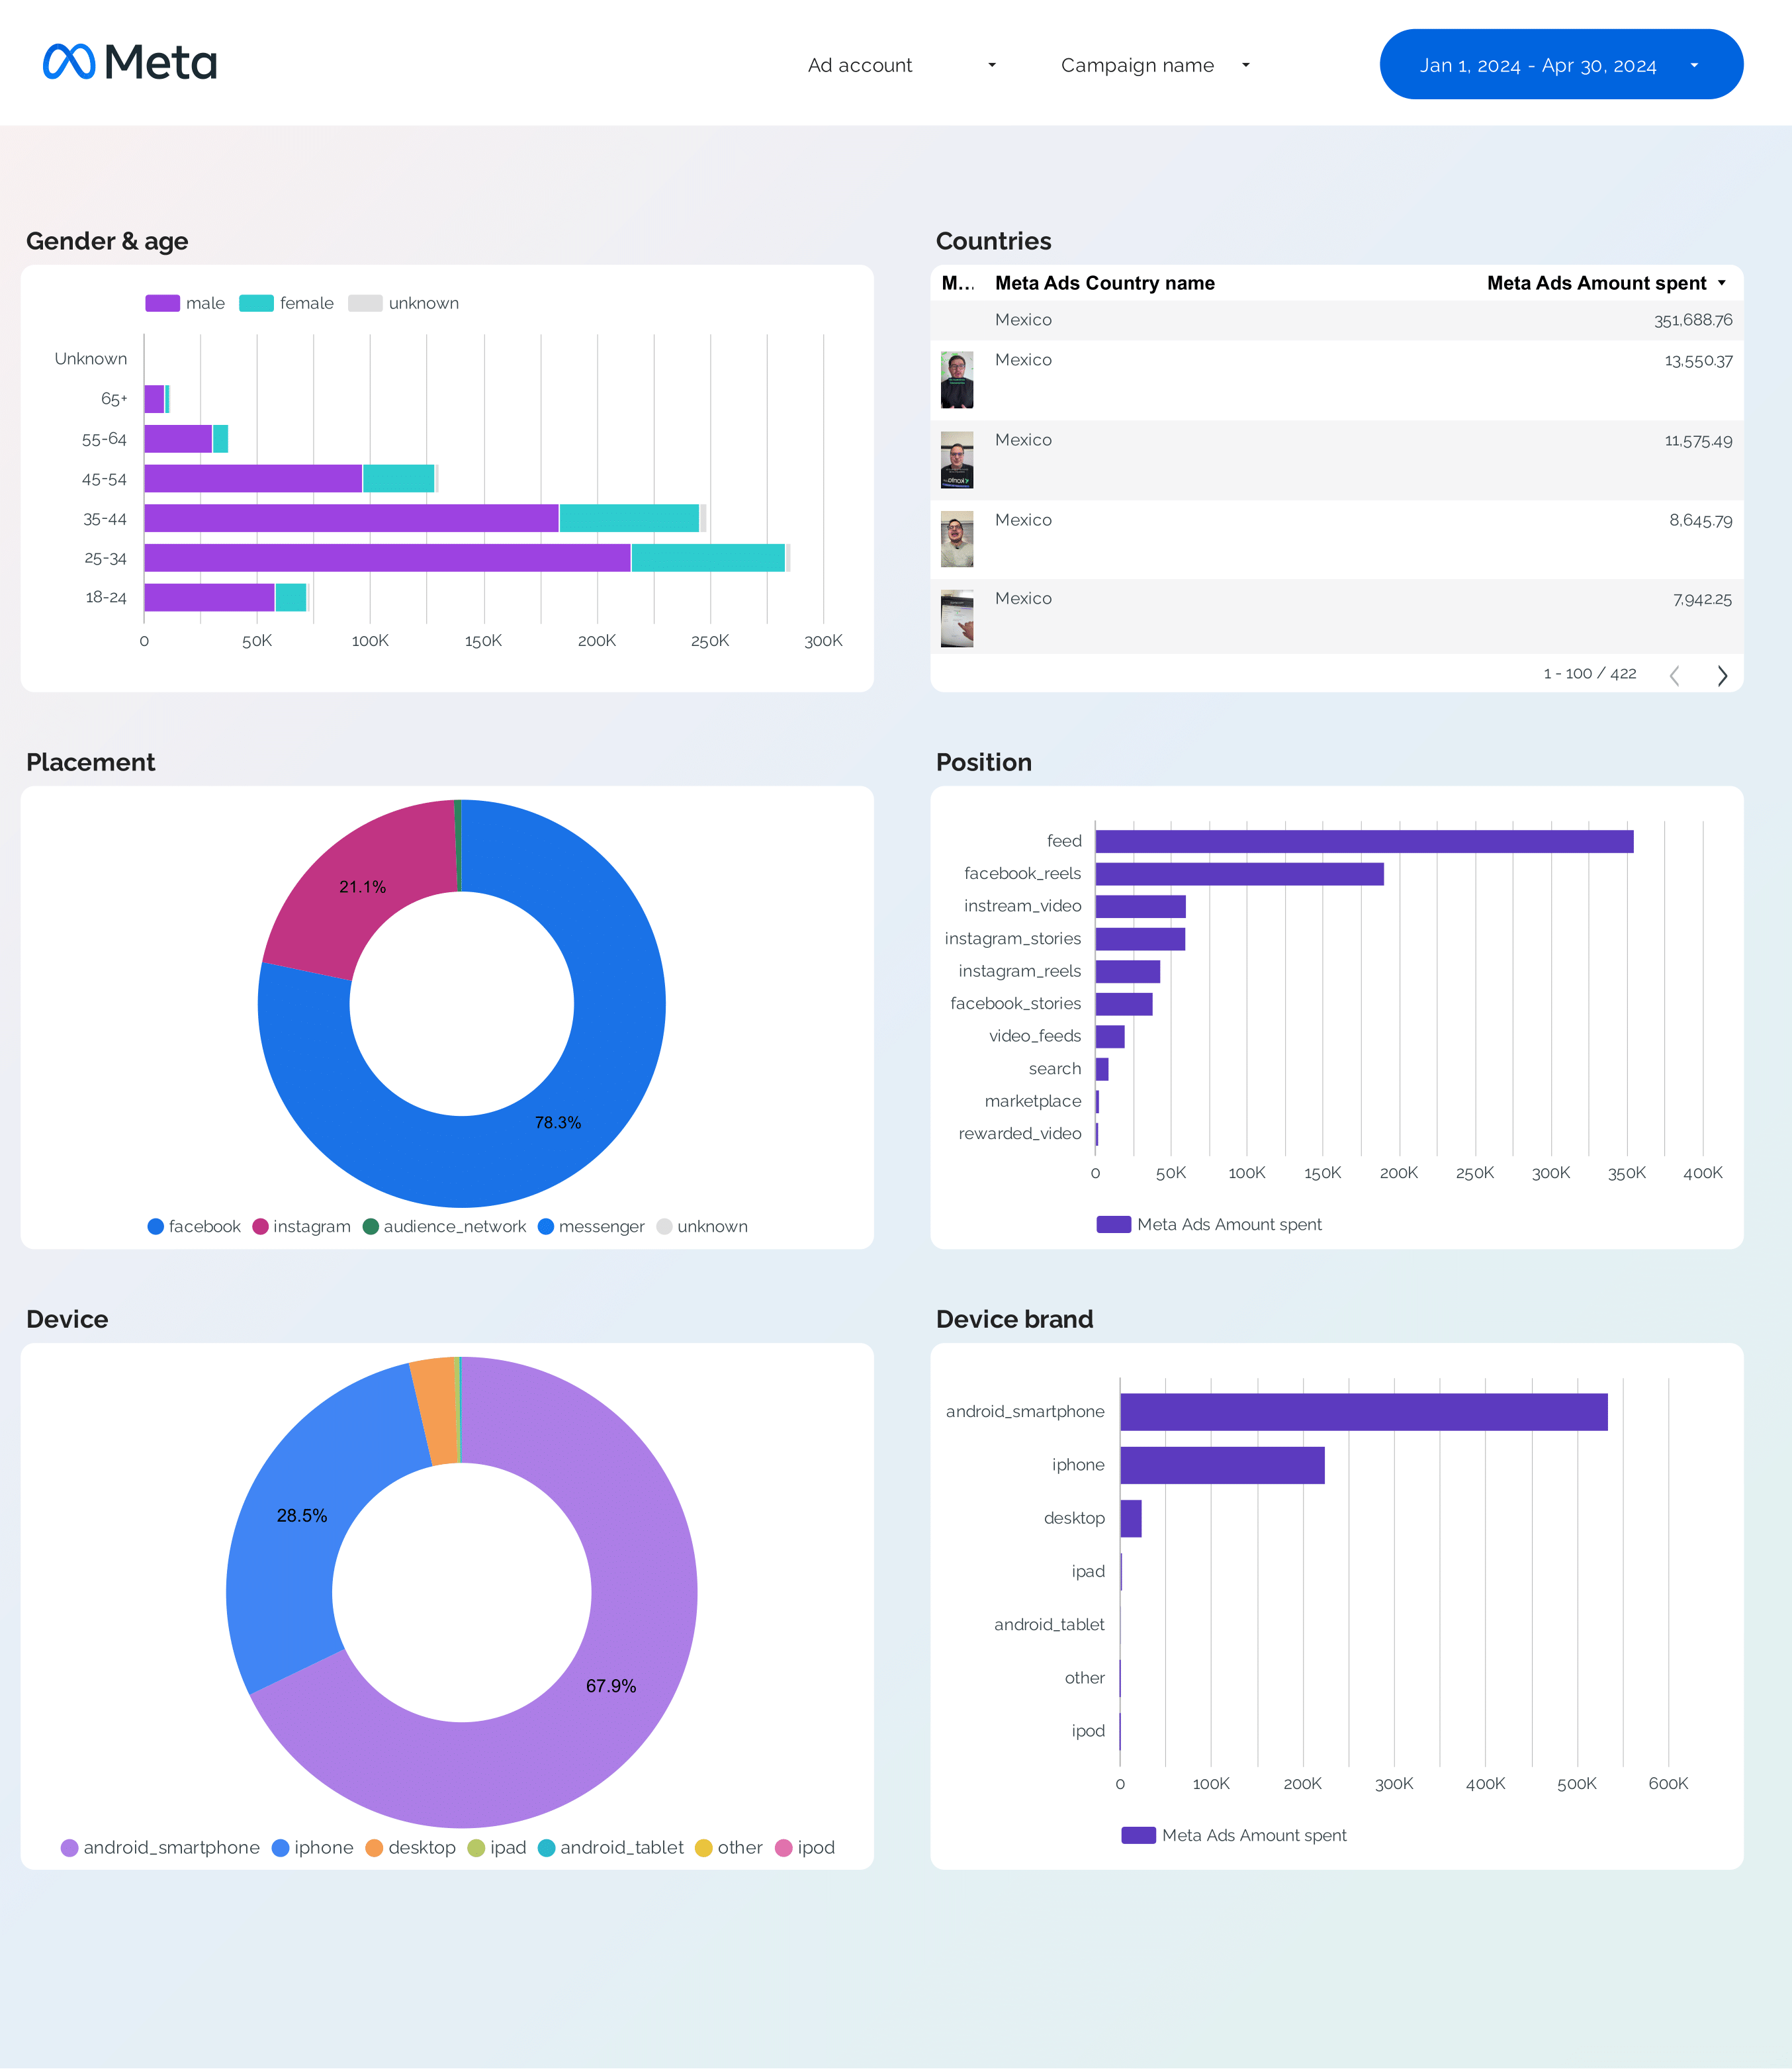
– Audience insights (Age, Gender, Location)
– Ad details (Campaign Name, Ad Name, Ad Set Name, Objective, Placement)
5. **Customization**: Customize the dashboard to highlight important KPIs and trends. Use filters to allow users to view data by specific time periods or audience segments.
6. **Testing and Iteration**: Test the dashboard for accuracy and usability. Gather feedback and make necessary adjustments to improve clarity and functionality.
7. **Regular Updates**: Ensure the dashboard is updated regularly with the latest data to provide accurate insights.
A Facebook Ads Audience dashboard is a tool that provides insights and analytics about the audience interacting with your Facebook Ads. It includes metrics such as impressions, clicks, ad spend, CTR (Click-Through Rate), CPC (Cost Per Click), CPM (Cost Per Thousand Impressions), reach, and frequency. The dashboard also offers details about campaign names, ad names, ad set names, objectives, placements, and audience demographics like age, gender, and location. This information helps advertisers optimize their PPC (Pay-Per-Click) campaigns by understanding audience behavior and engagement.
Can I download this template in PDF?


 Impressions
 Ad Spend