Facebook Ads + Google Ads report template for Looker Studio by Porter

Get the actual Facebook Ads + Google Ads on Looker Studio template used by Porter to monitor PPC performance.

Meet the creator

Porter

This template is built by the same marketers behind all our tutorials, support, and our template gallery.

+40,000 marketers have downloaded our dashboards

Template setup

Copy-paste the same dashboards that other teams and agencies use to monitor their PPC performance

Facebook Ads + Google Ads report template overview

With this Facebook Ads + Google Ads report template, monitor specific metrics such as click-through rate (CTR), cost per click (CPC), conversion rate, impressions, and return on ad spend (ROAS). Segment data by campaign, ad group, device, location, and demographic breakdowns. Metrics and dimensions included are tailored for Facebook Ads and Google Ads, focusing on PPC performance. Share the report through a link, PDF, or email to influence your team or clients. Answer questions such as: What is the overall performance of our PPC campaigns? How do different demographics respond to our ads? What is the cost per conversion across different platforms? How does device type impact ad performance? What are the trends in ad spend versus return?

Metrics and dimensions included

Customize the template’s metrics and dimensions as you like. See all available fields.

Metrics

Conversion metrics

– Conversion rate – Cost per conversion – Return on investment (ROI)

Engagement metrics

– Likes – Comments – Shares

Visibility metrics

– Impressions – Reach – Click-through rate (CTR)

Dimensions

Campaign

– Target audience – Campaign objectives – Messaging strategy

Audience

Time

By hour, day, week, month, quarter, or year

Features

100% custom charts

White-label

Custom metrics​

All-time historical data

Schedule email alerts​

Filters

Goals​

Data blending

FAQs

A FB + GA report should include a breakdown of metrics by visibility (e.g., impressions, reach), engagement (e.g., likes, comments), and conversion metrics (e.g., click-through rate, conversion rate). The data should be segmented by campaign, channel, audience, content, objective, and date. For example, presenting the number of impressions generated by each campaign or the conversion rate based on different channels used. Being concise and precise, this report provides essential insights into the performance of Facebook and Google Analytics efforts.
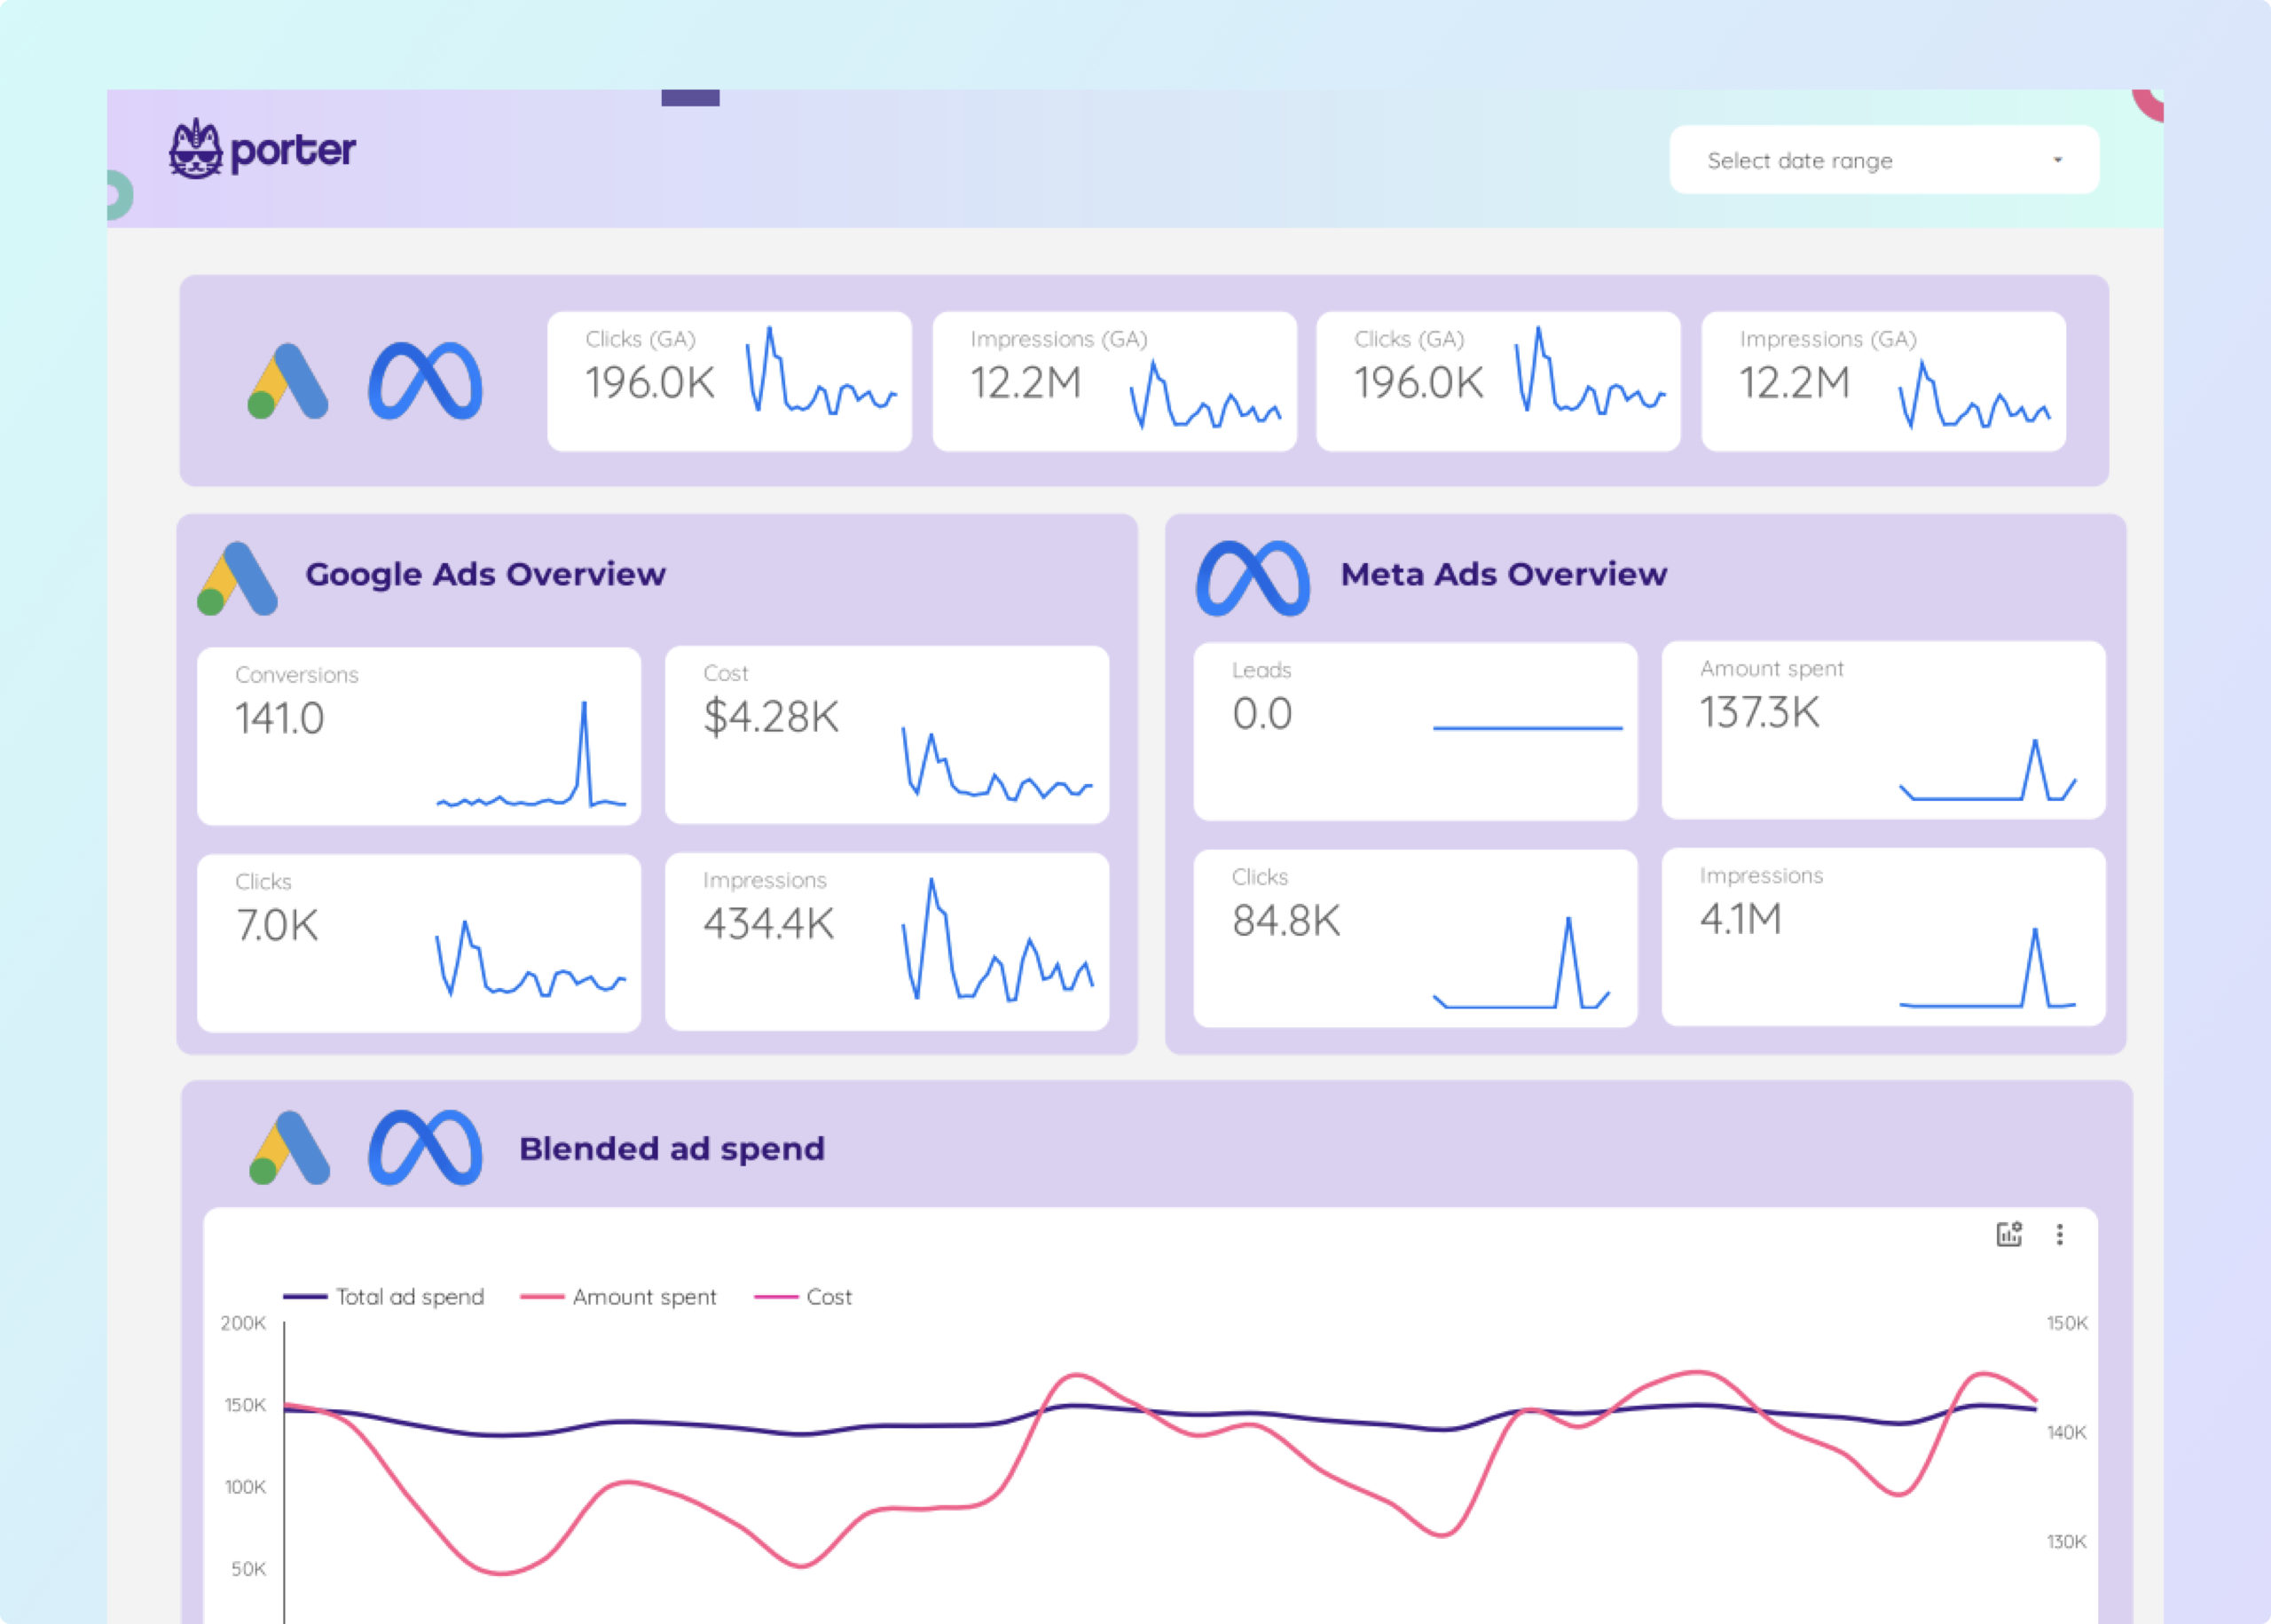
To build a combined Facebook and Google Ads dashboard, 1) connect your Facebook Ads Manager and Google Ads accounts. 2) Select metrics such as click-through rates, cost per click, and conversion rates to monitor performance. 3) Segment data by campaign, channel, audience, product, customer content, objective, and date for a detailed analysis. 4) Add filters or buttons for metrics like ad spend or impressions to make your report interactive. 5) Share your dashboard via PDF, scheduled emails, or links for easy access.
Yes, Looker Studio allows you to download your report as a PDF. To do it, follow these steps: Before downloading your report choose the date range you want to visualize on your report. Click on the “File” menu at the top left corner of the screen. Select “Download as” from the drop-down menu and choose “PDF.” You can choose which pages you want to download, and also you can add a password to protect the report and add a link back to the online report. Click on “Download” to save the report on your device.