+40,000 marketers have downloaded our dashboards
100% custom charts
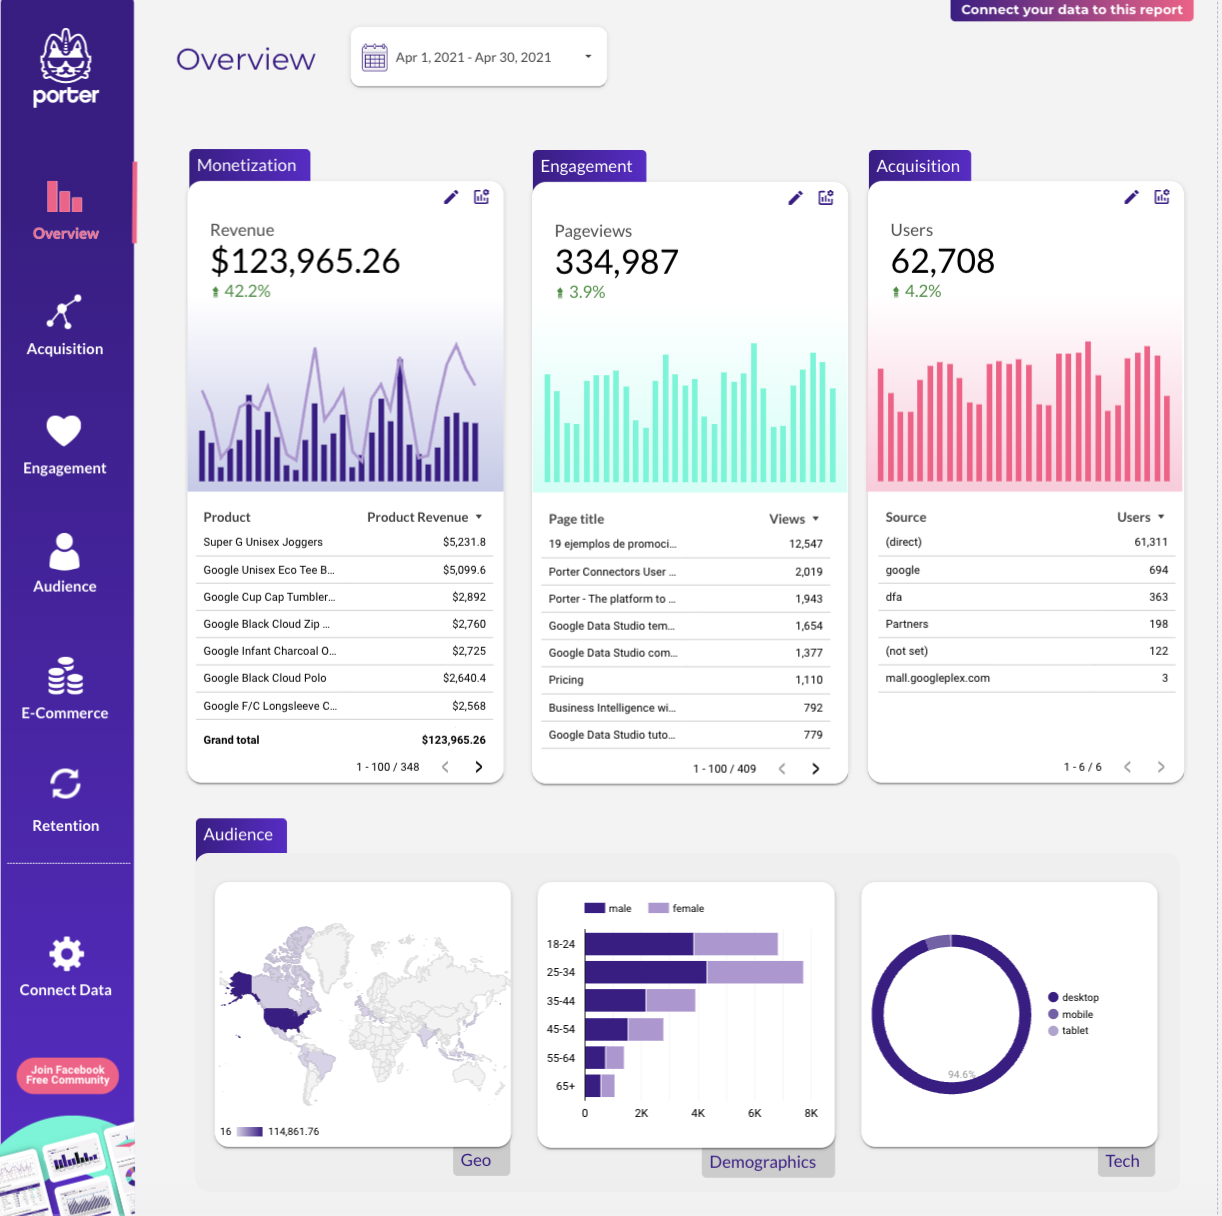
White-label
Custom metrics
All-time historical data
Schedule email alerts
Filters
Interactive
Goals
Data blending
To analyze cross-channel data for a report, follow these steps:
A Cross-channel dashboard is a tool that consolidates data from multiple marketing channels into a single interface, providing businesses with a comprehensive view of their marketing performance. It is significant for businesses as it aids in making informed decisions, tracking KPIs, and identifying trends or issues across different channels. Tools like Looker Studio are commonly used to create these dashboards, which typically include key elements like traffic sources, conversion rates, customer engagement metrics, and ROI. Real-time data monitoring is crucial in these dashboards to provide up-to-date insights and prompt decision-making. For learning how to create a marketing dashboard using Looker Studio, you can refer to our YouTube channel: https://www.youtube.com/@porter.metrics.

