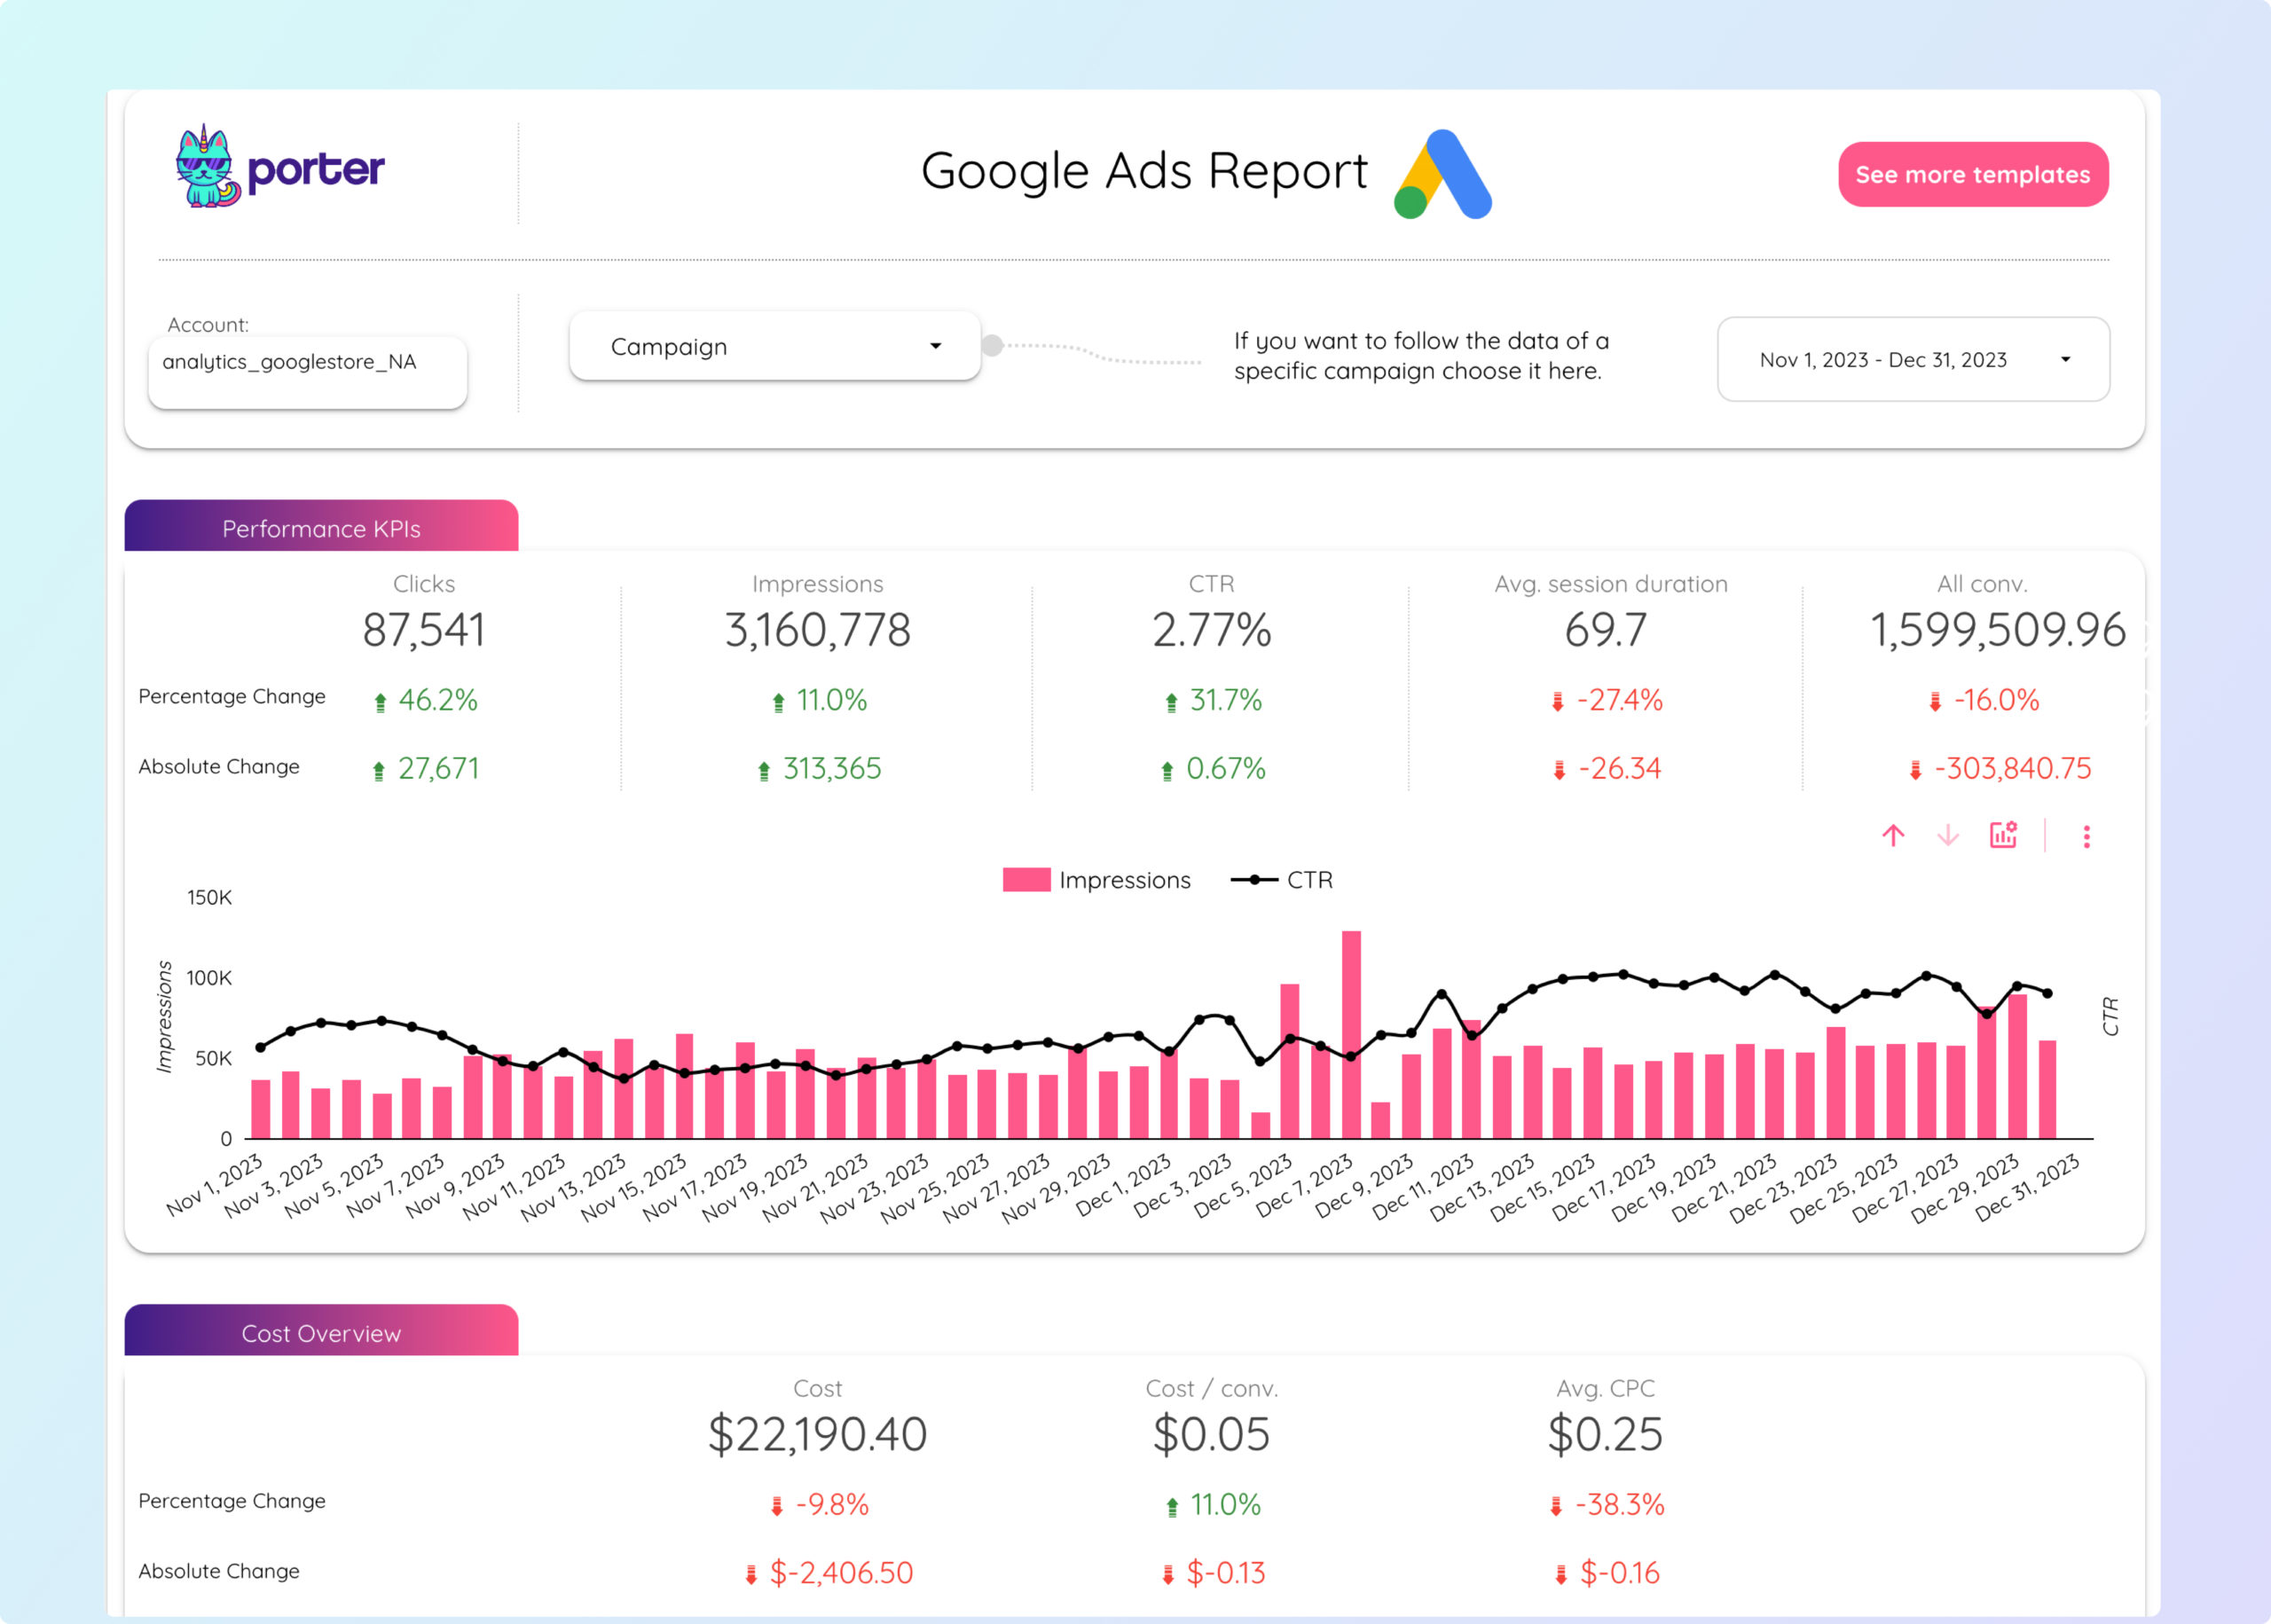
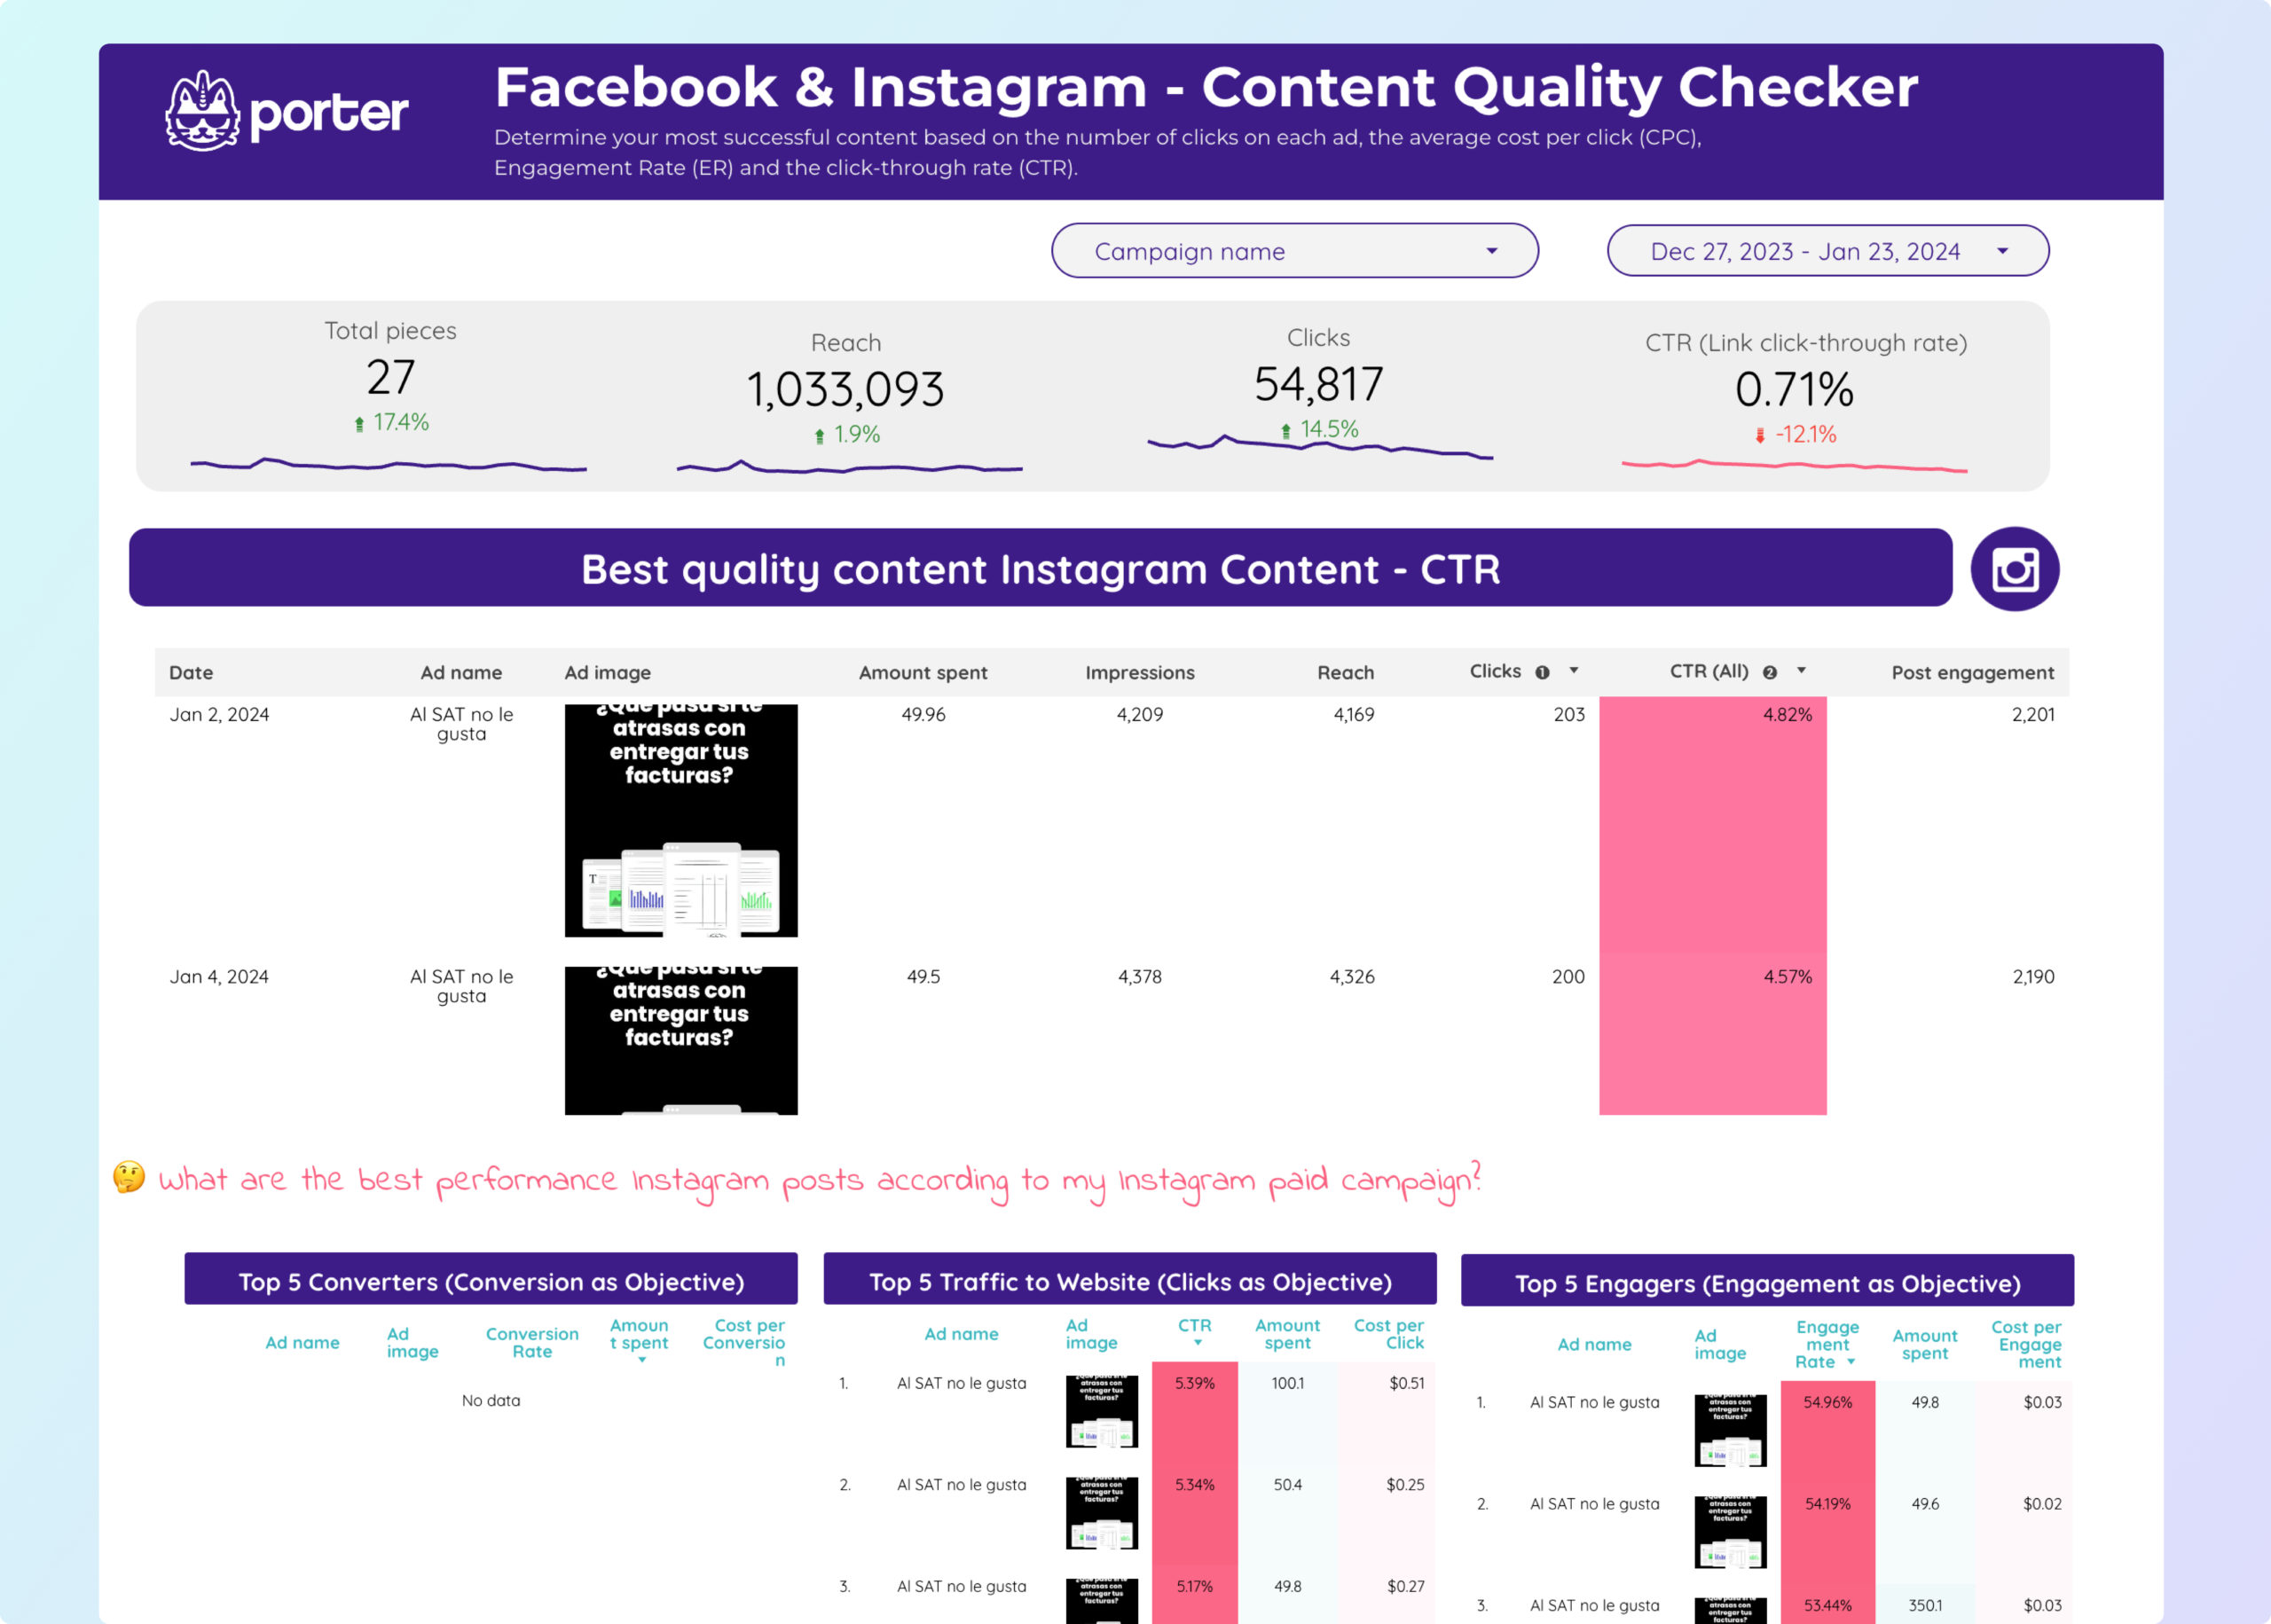
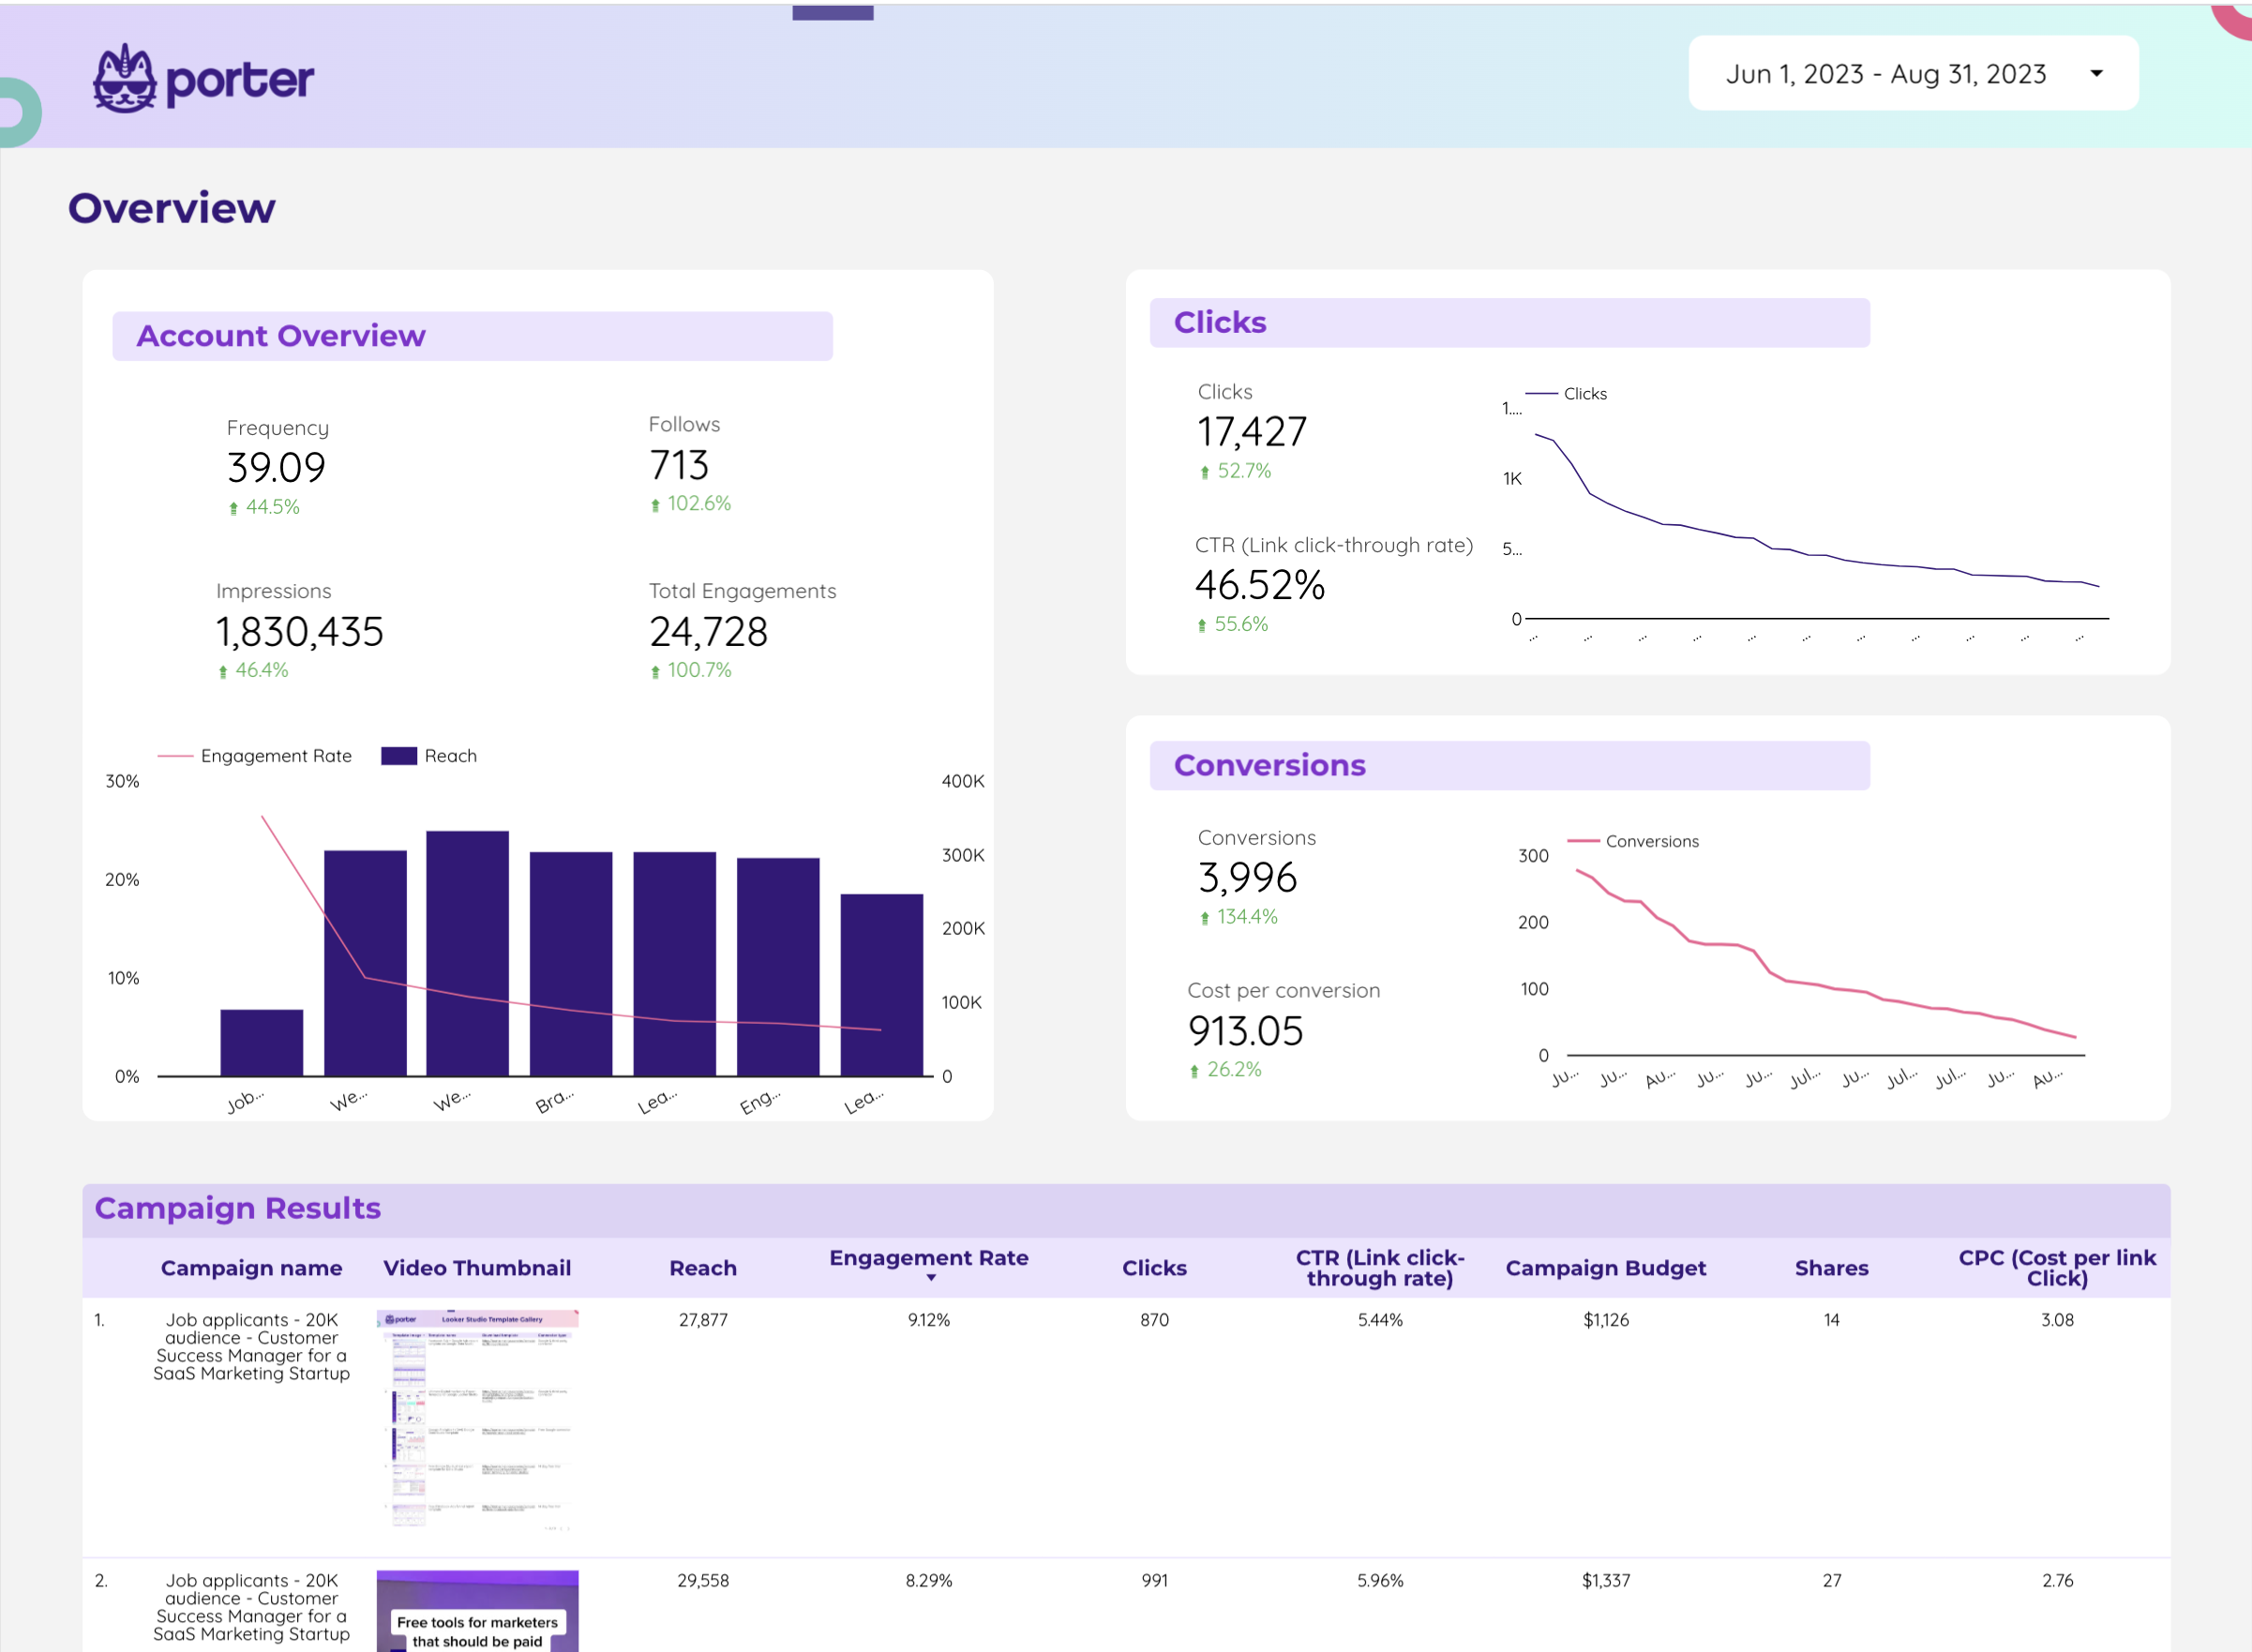
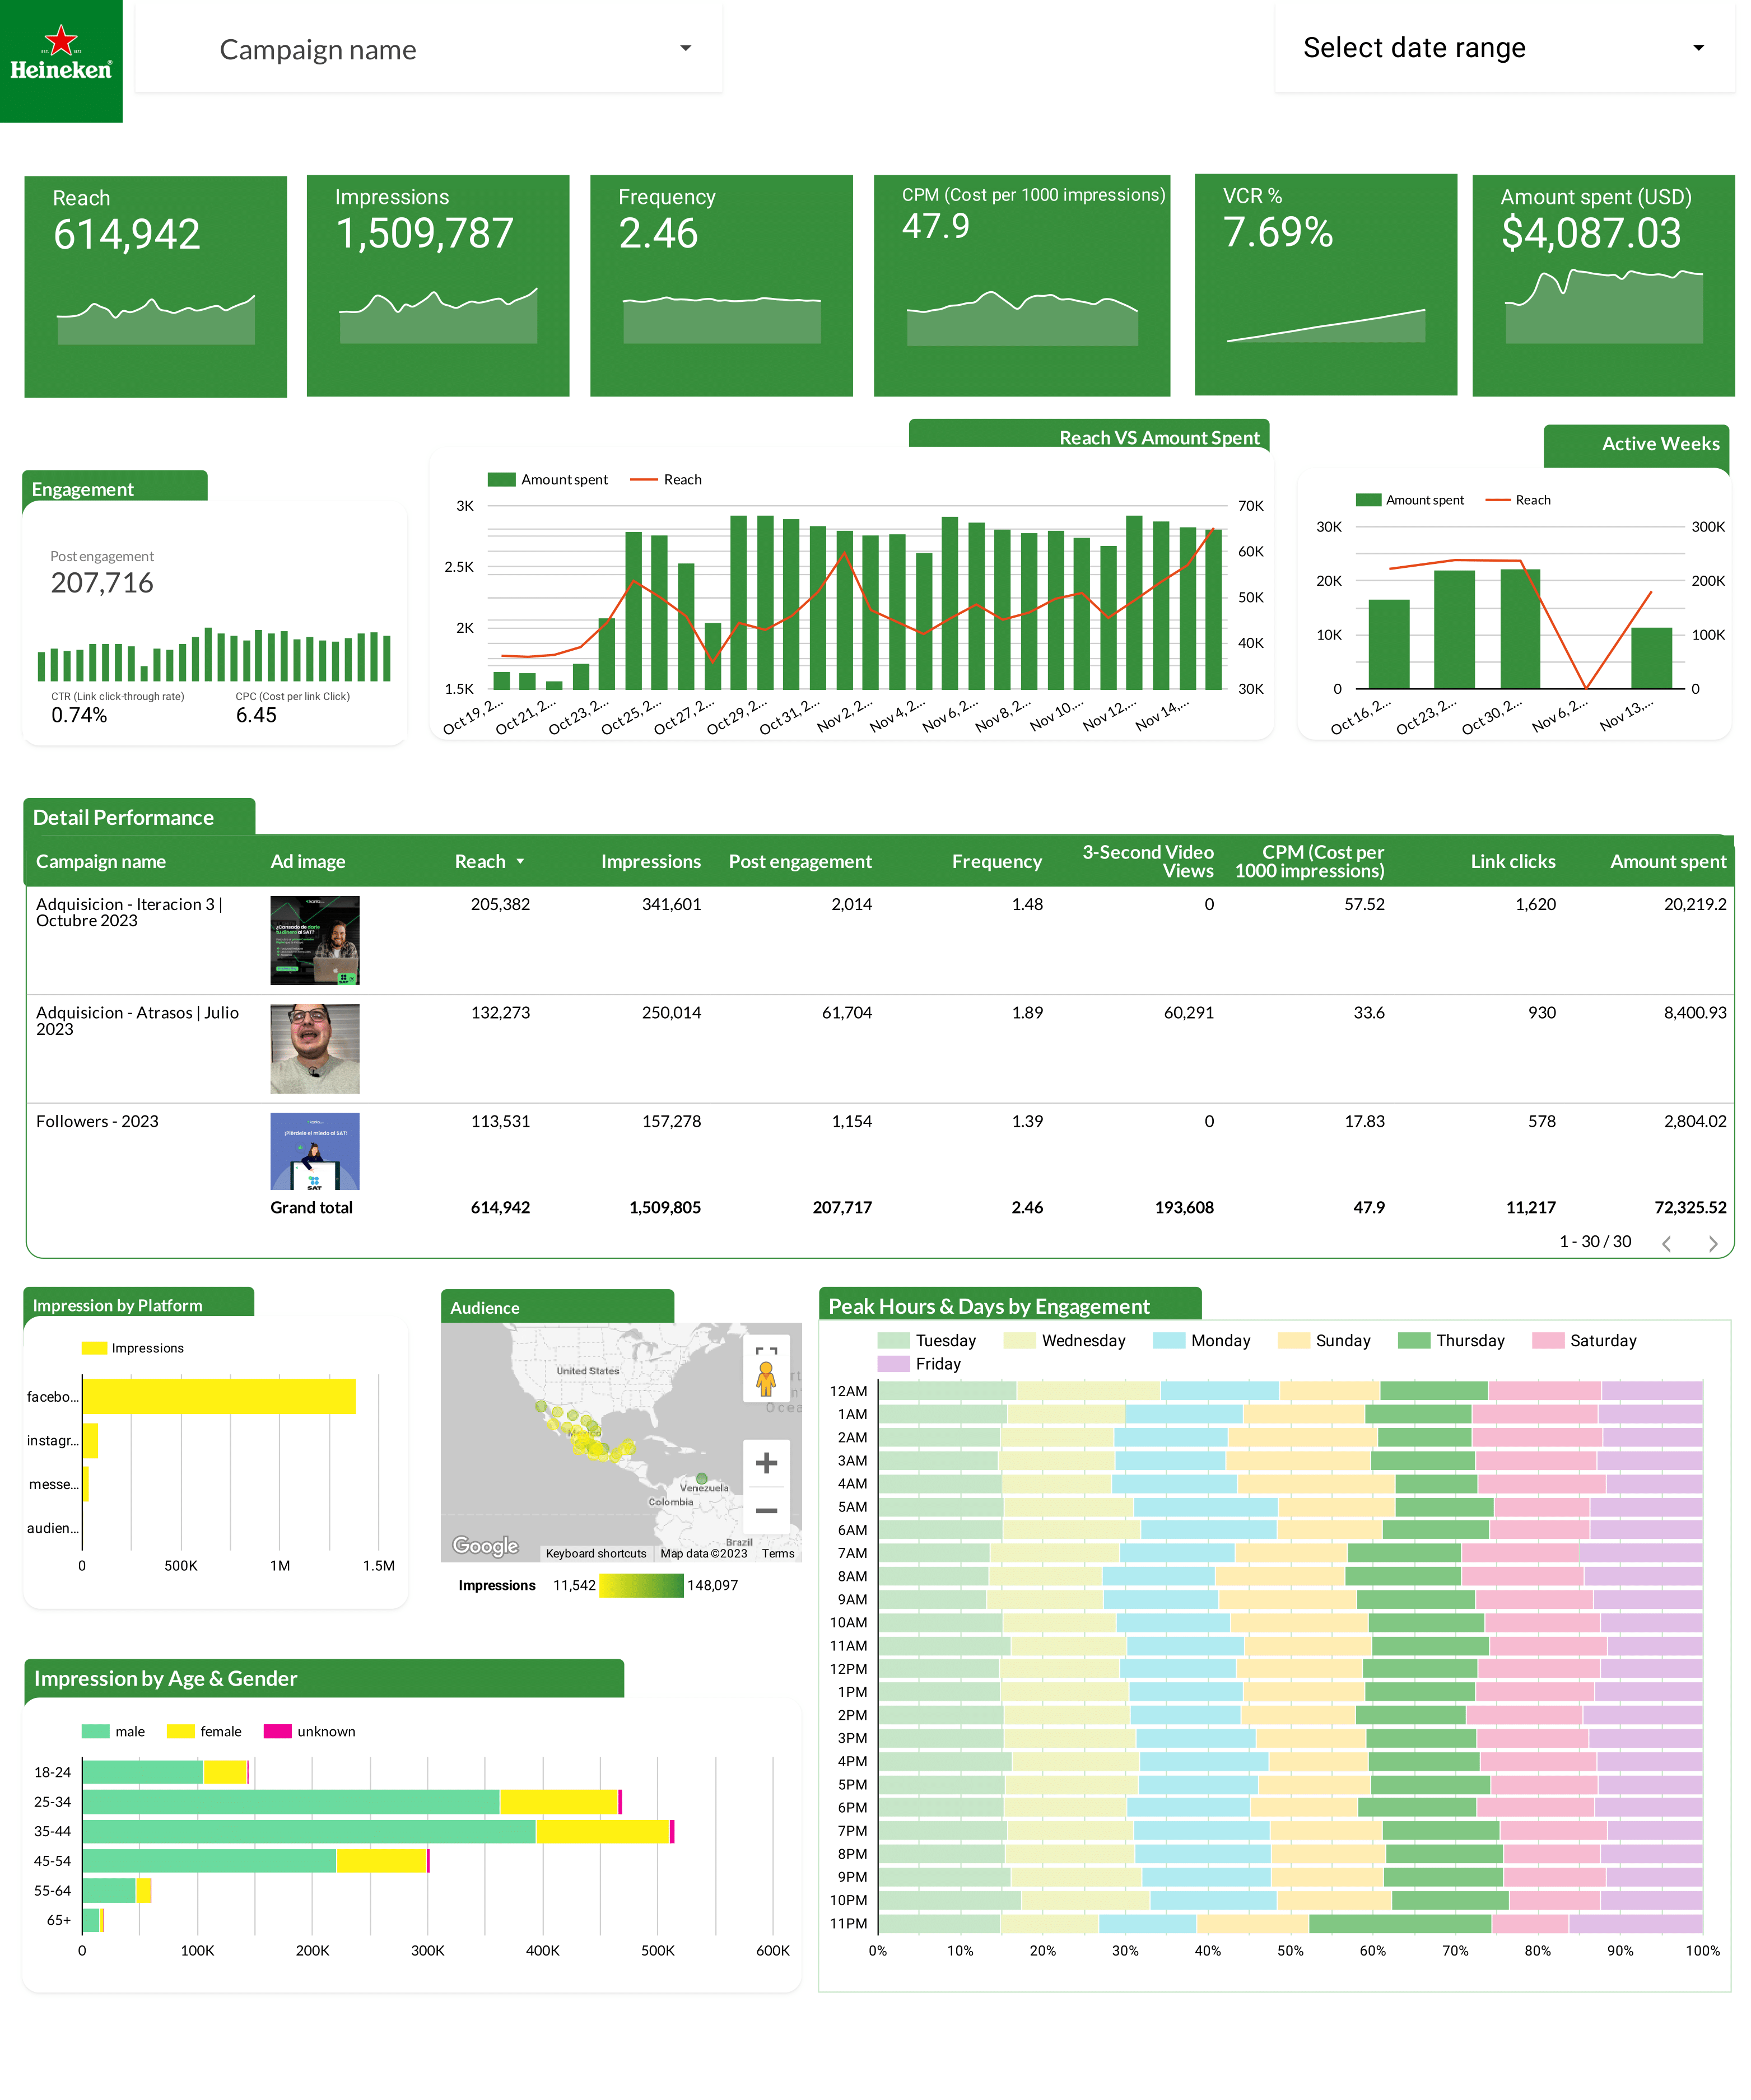
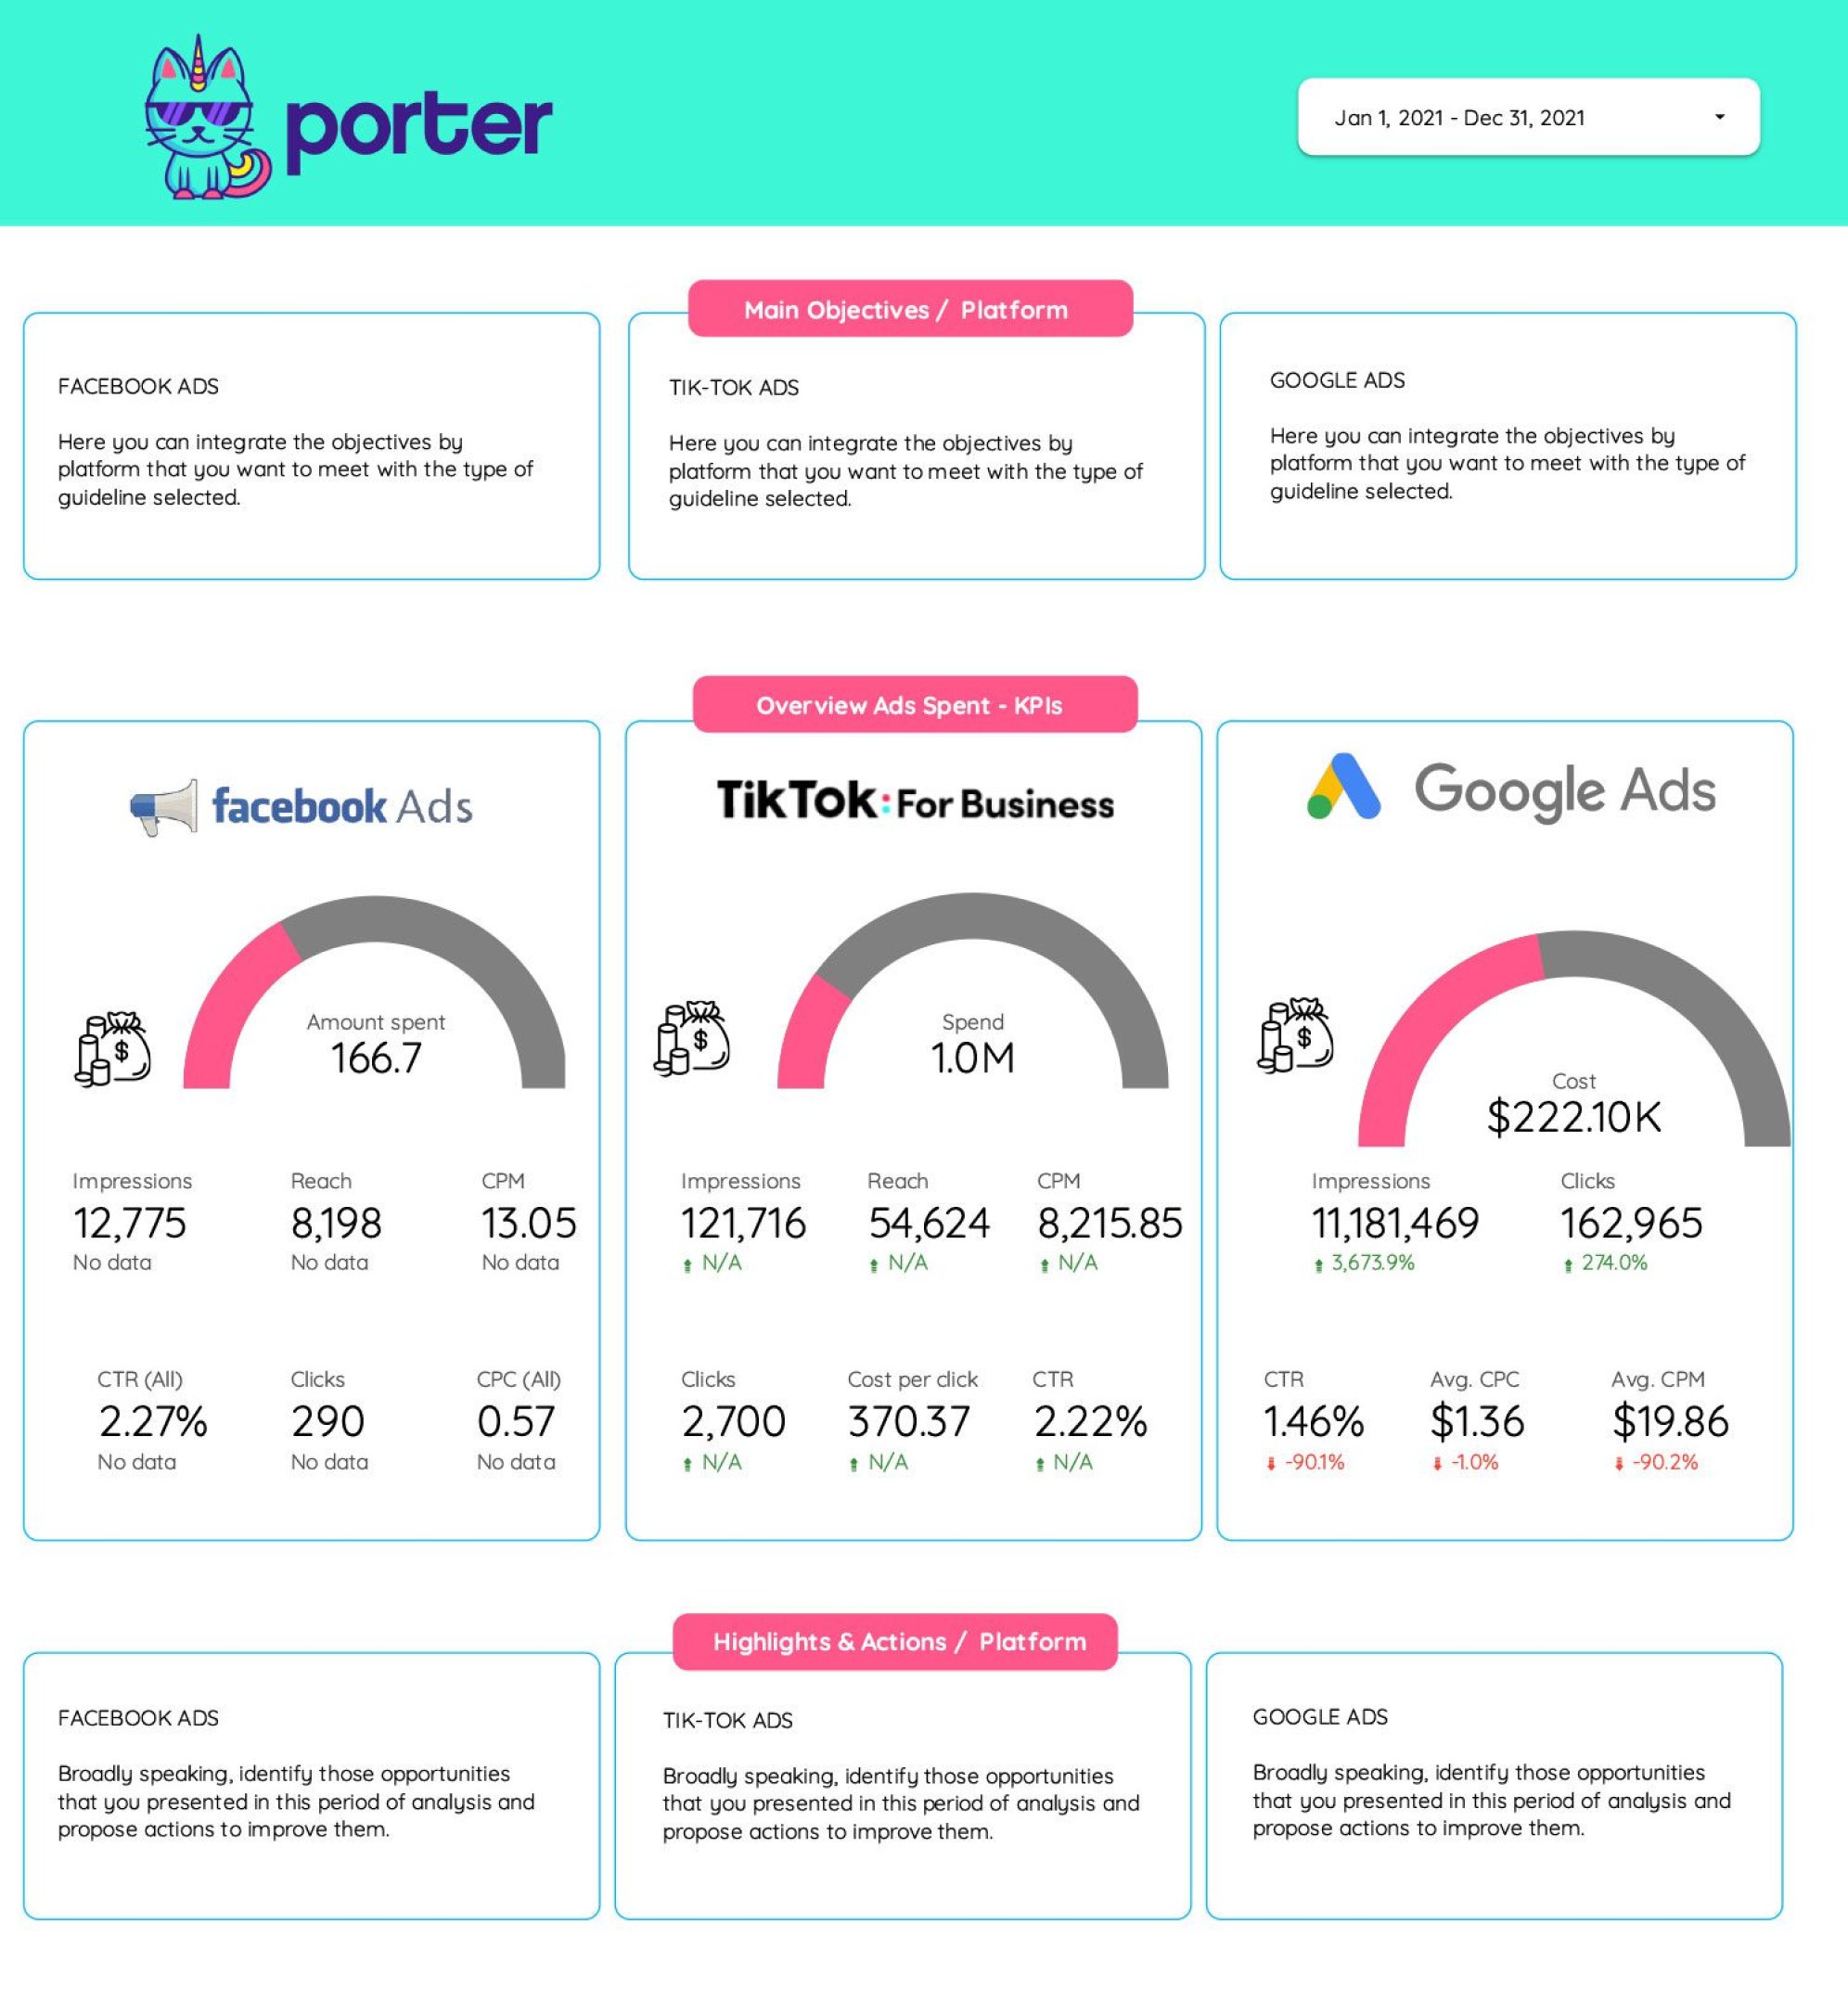
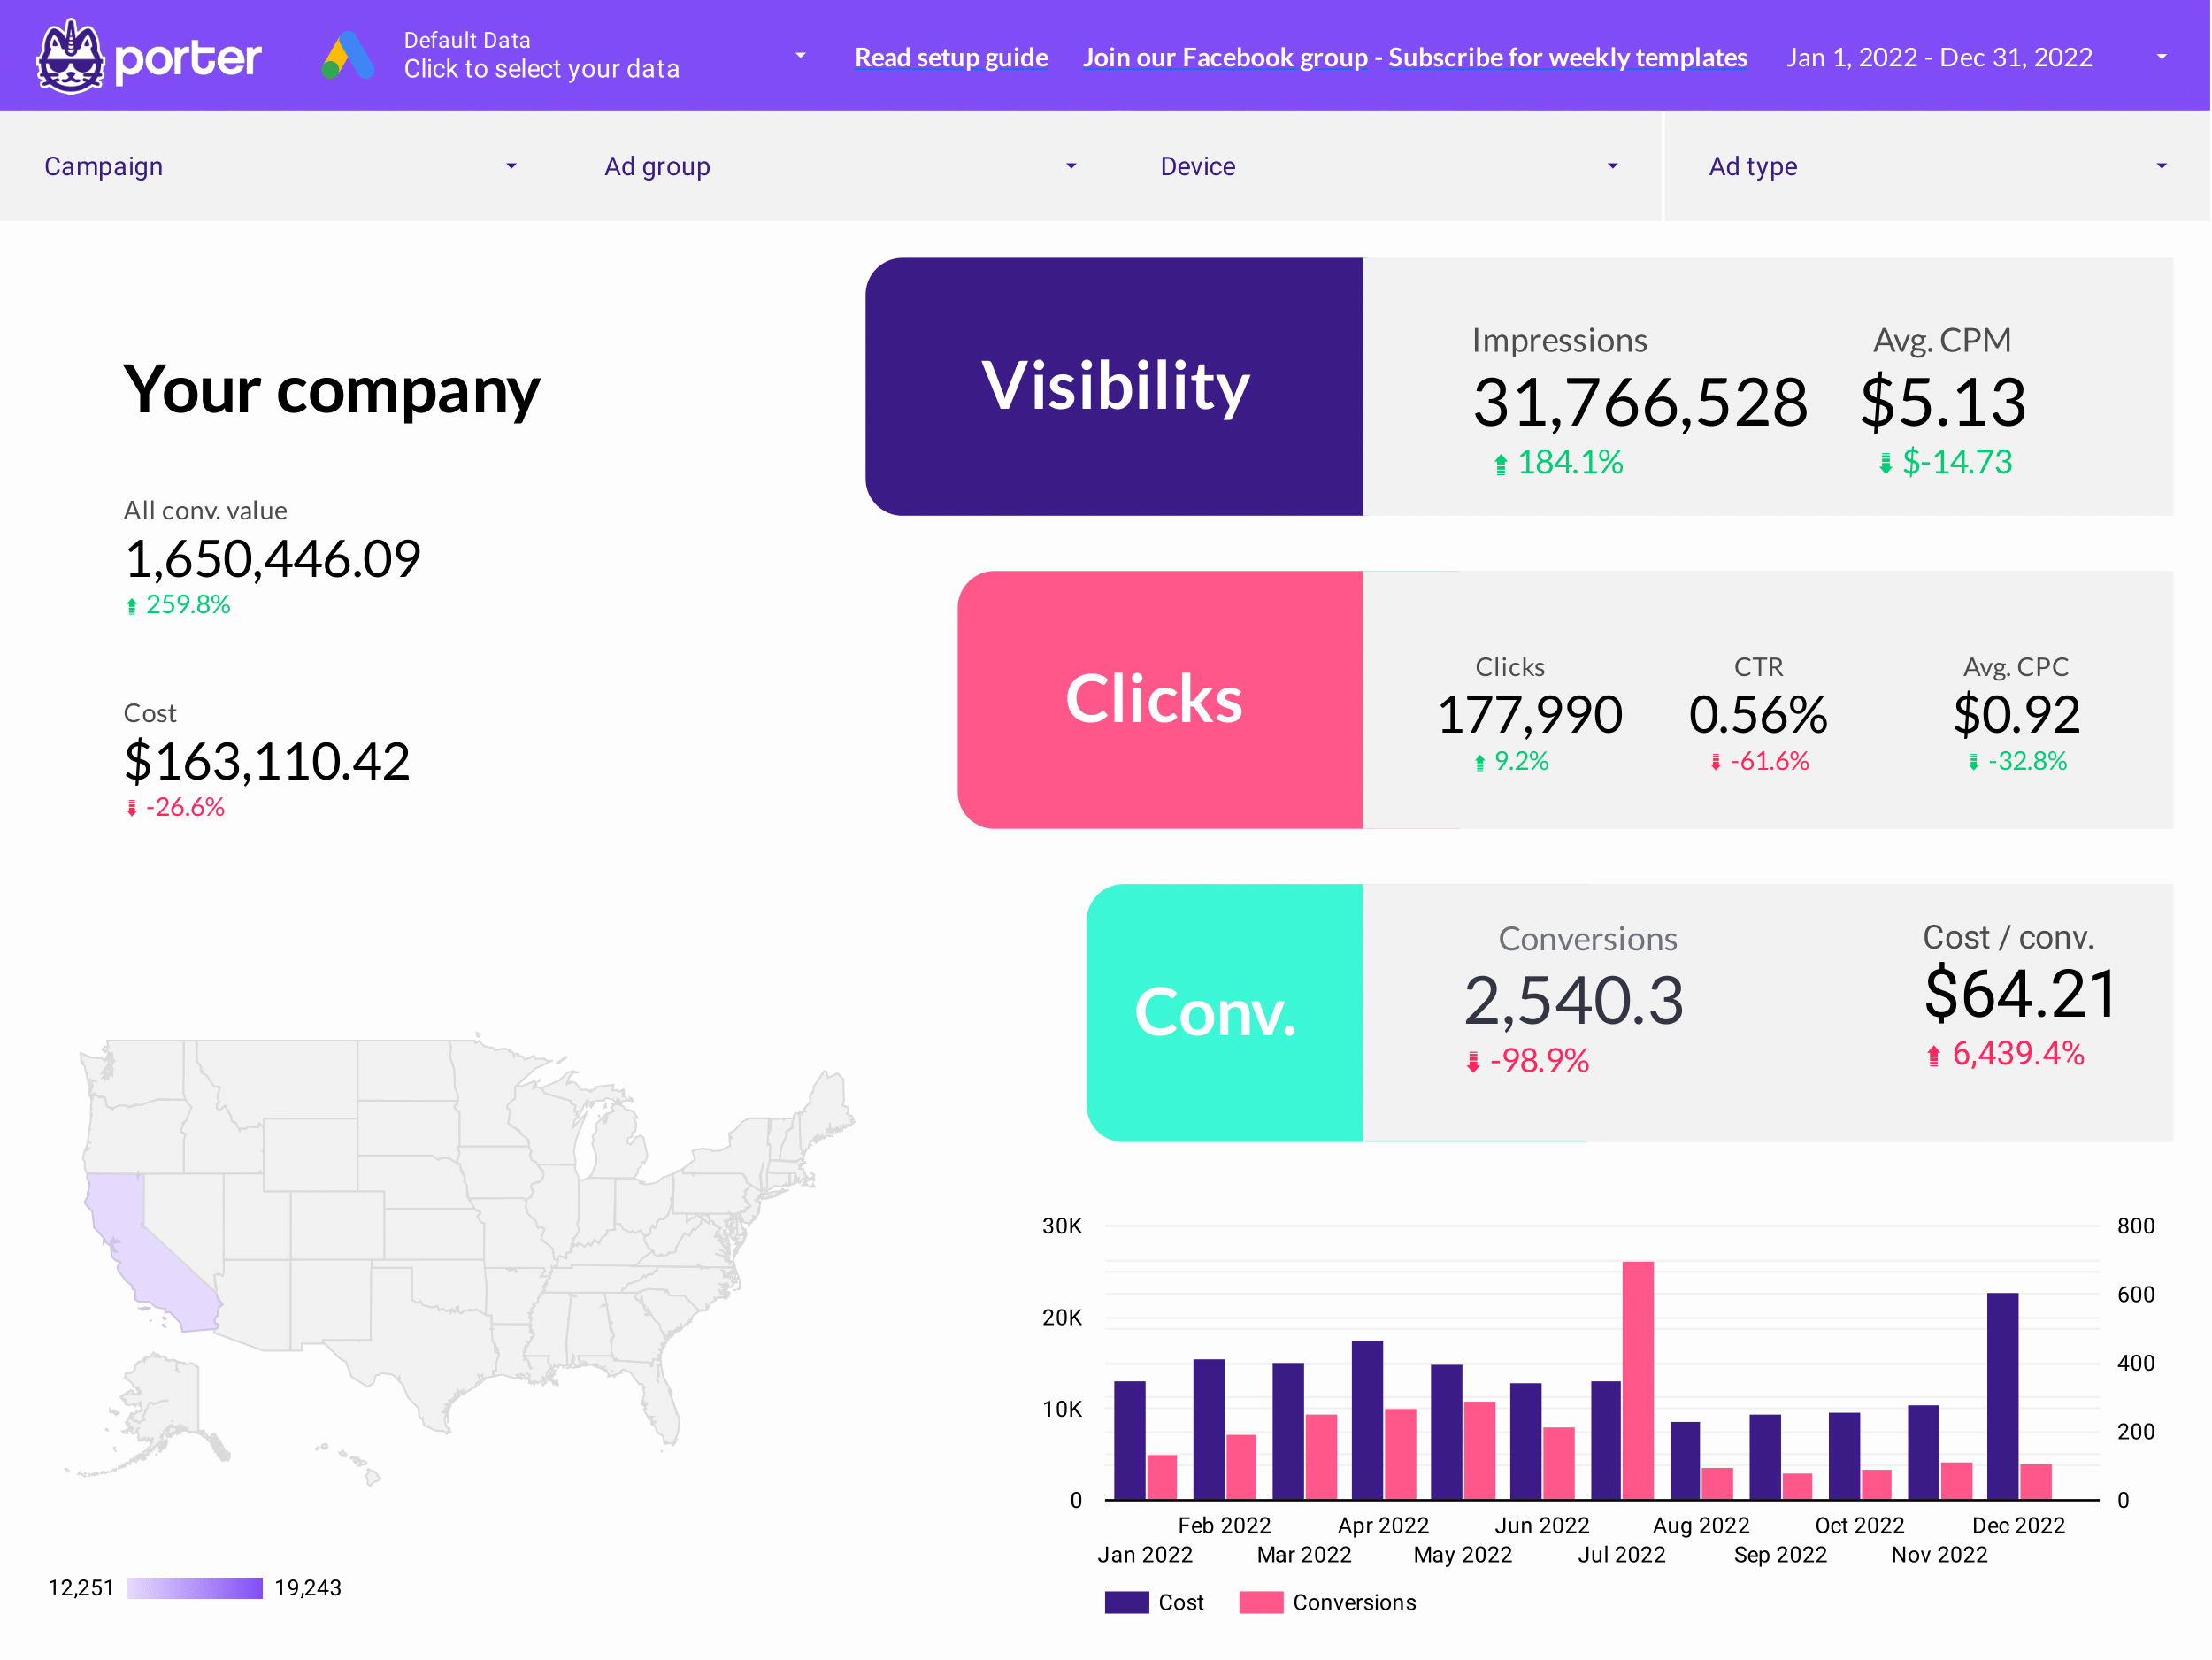
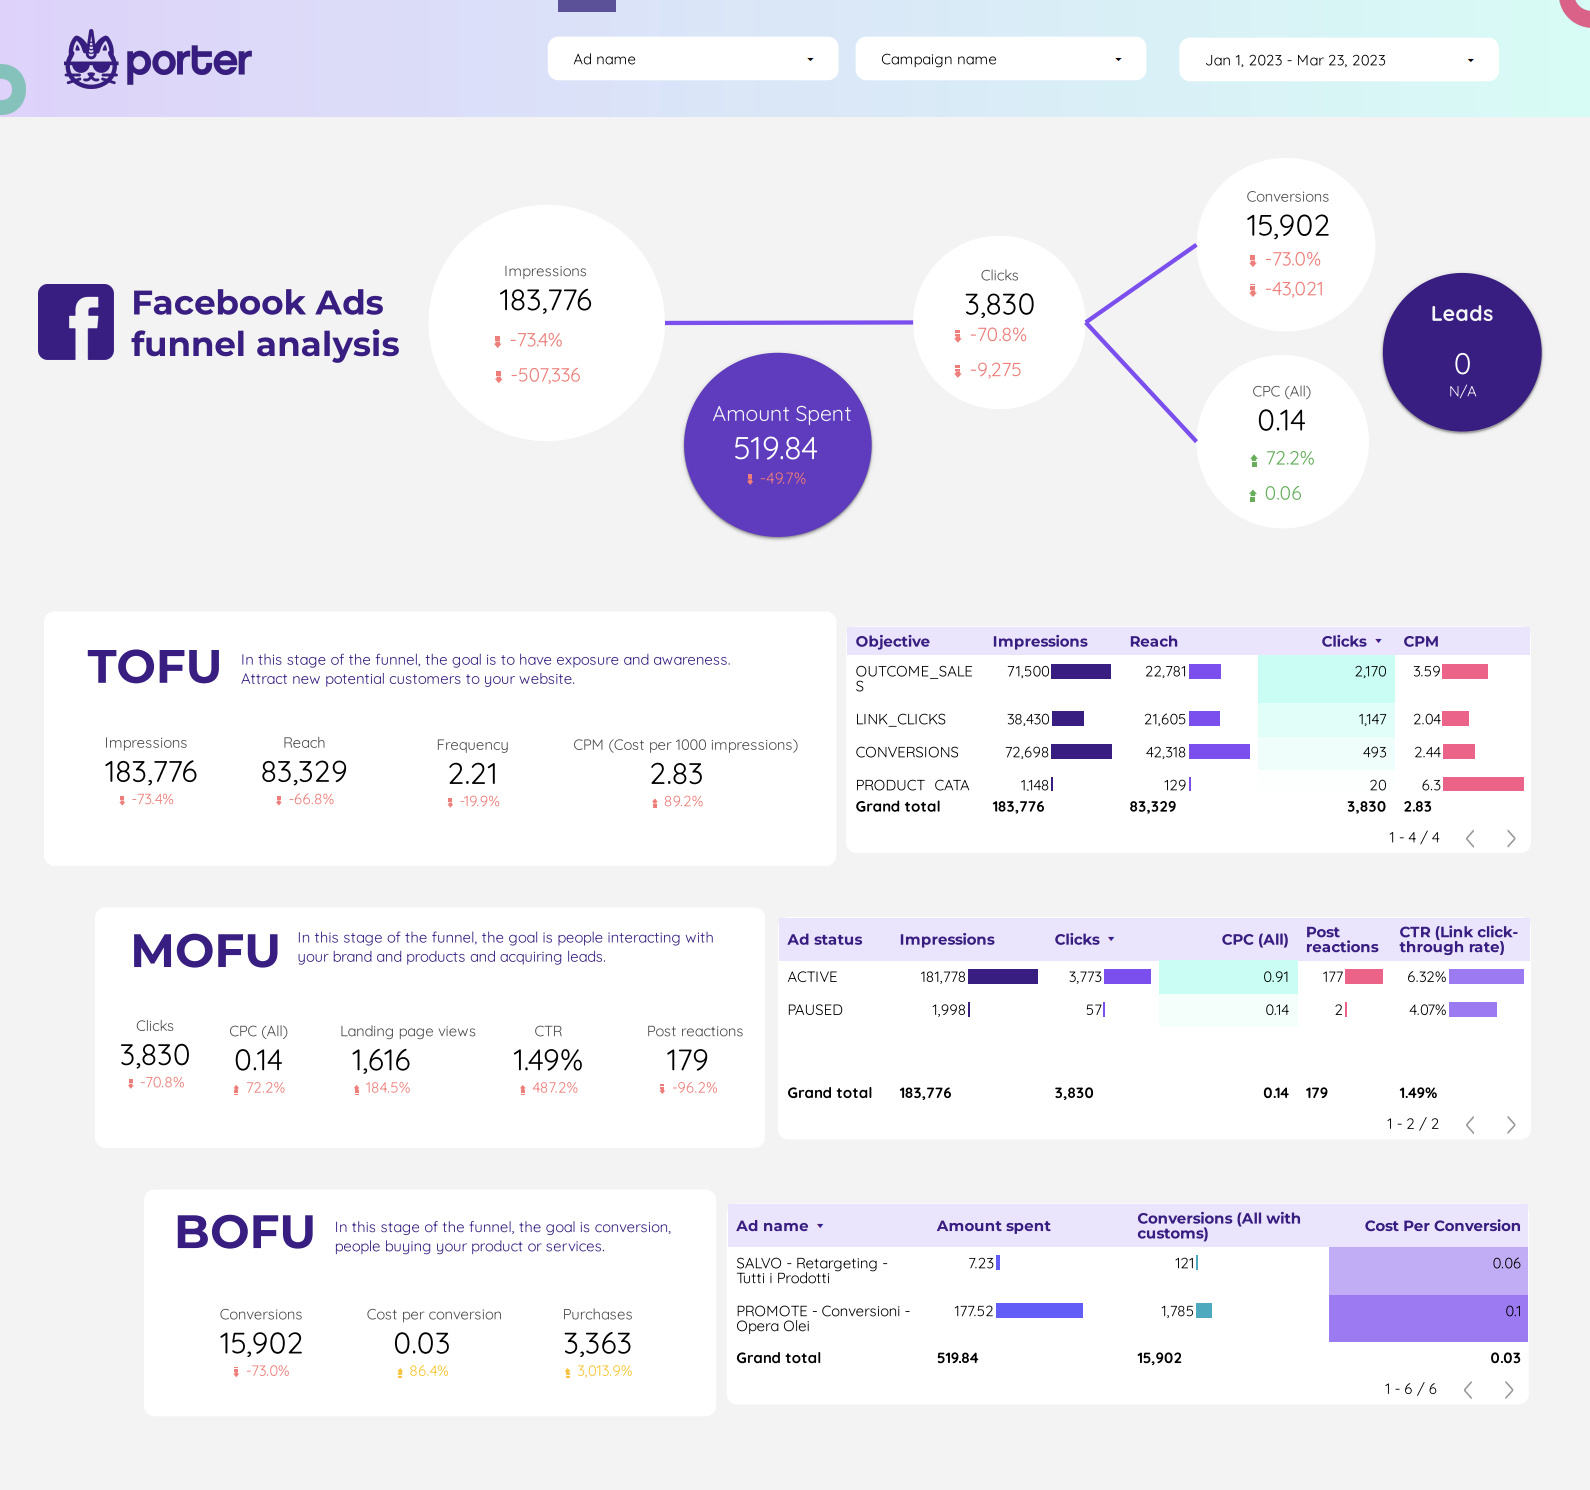
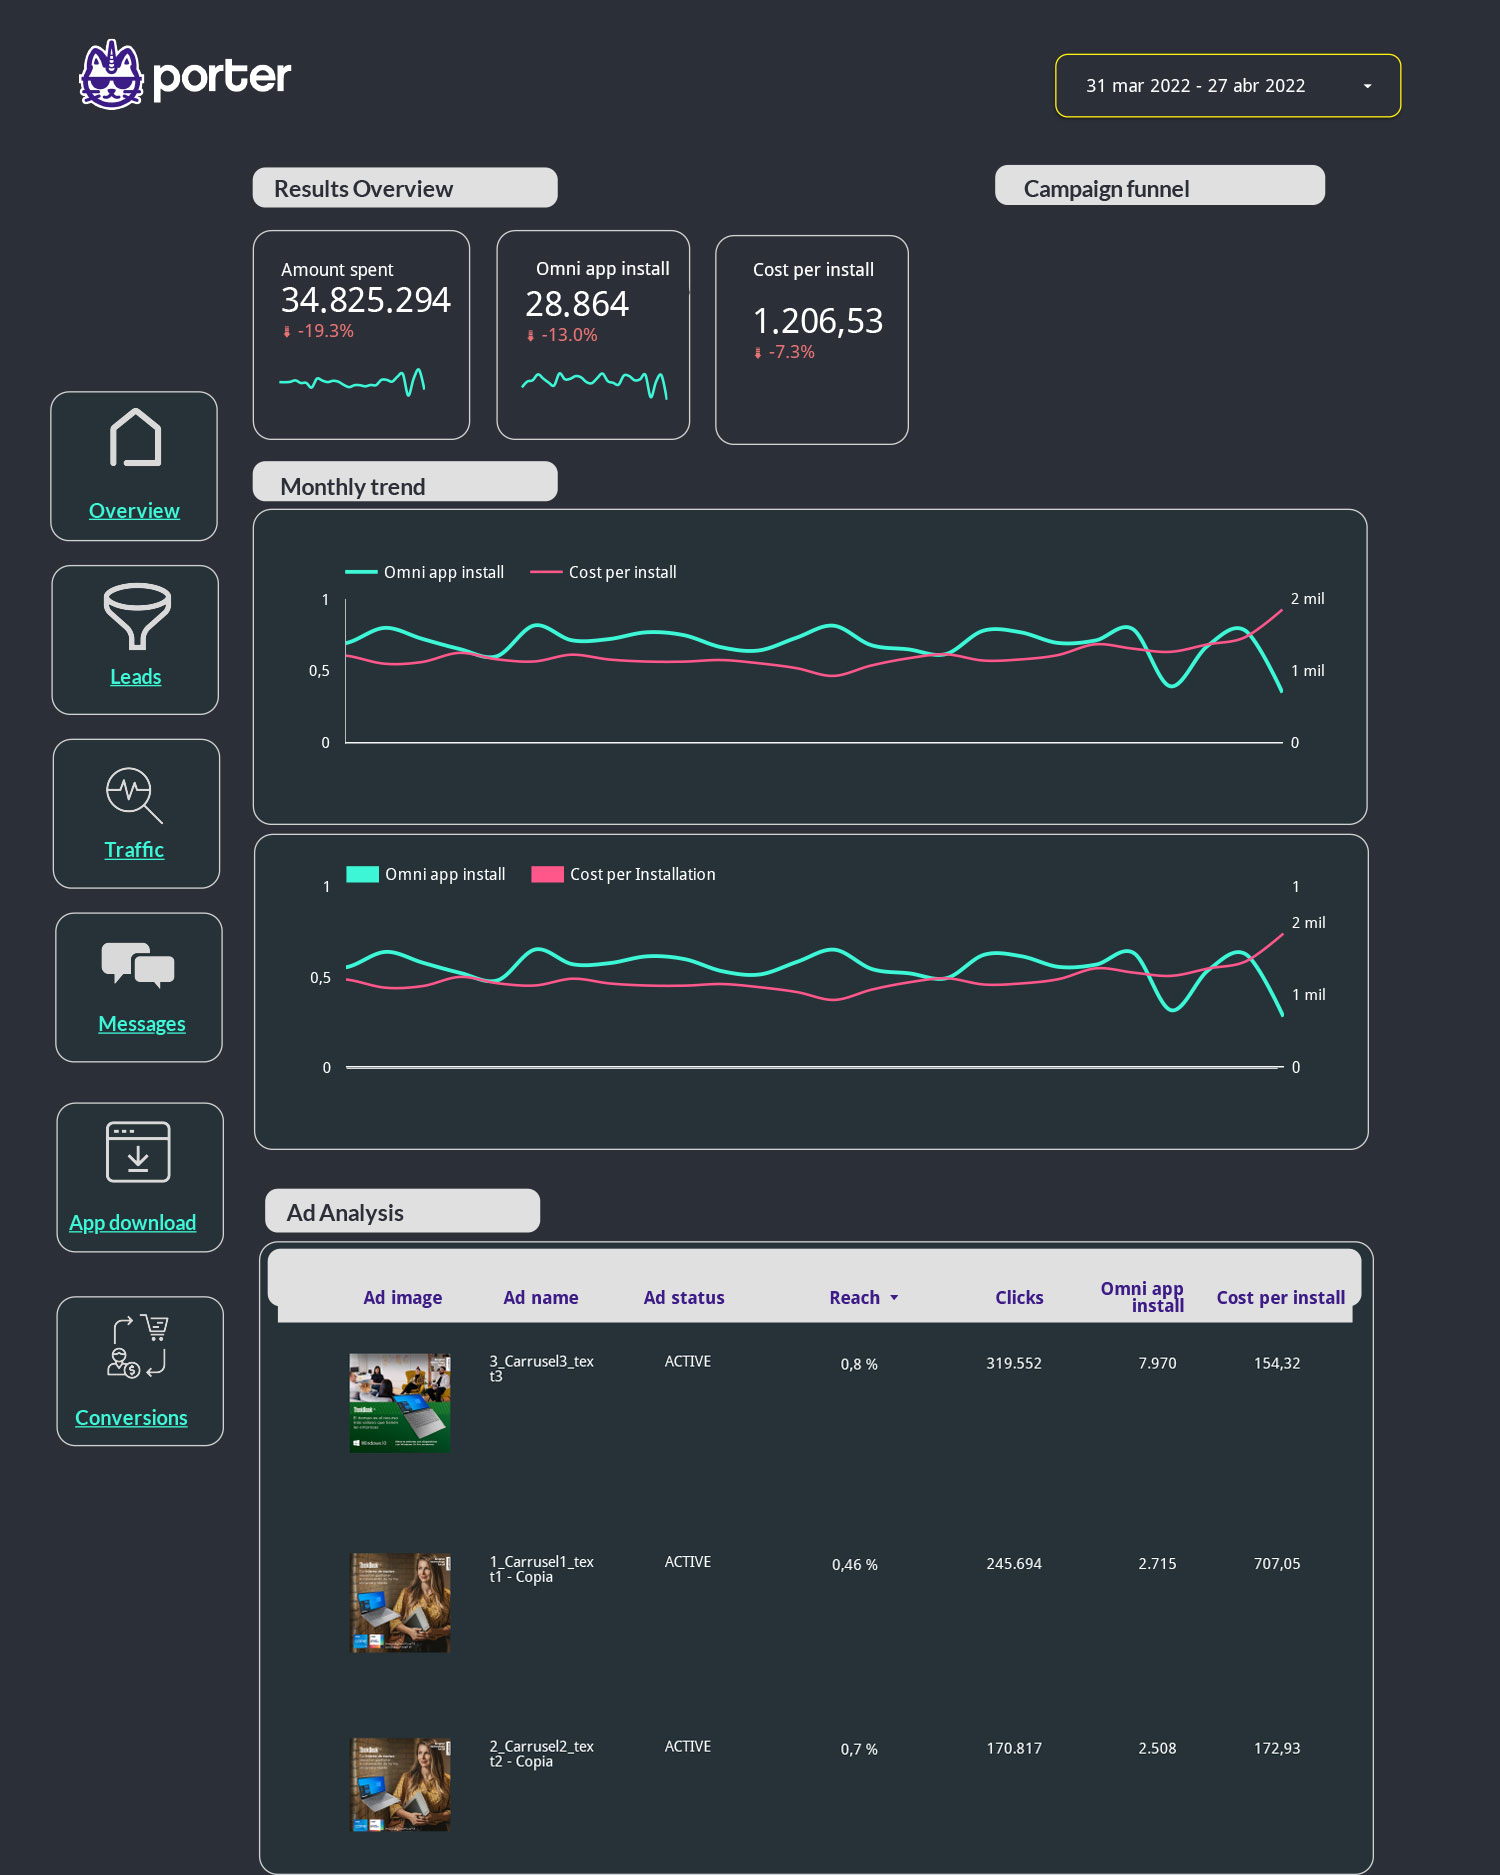
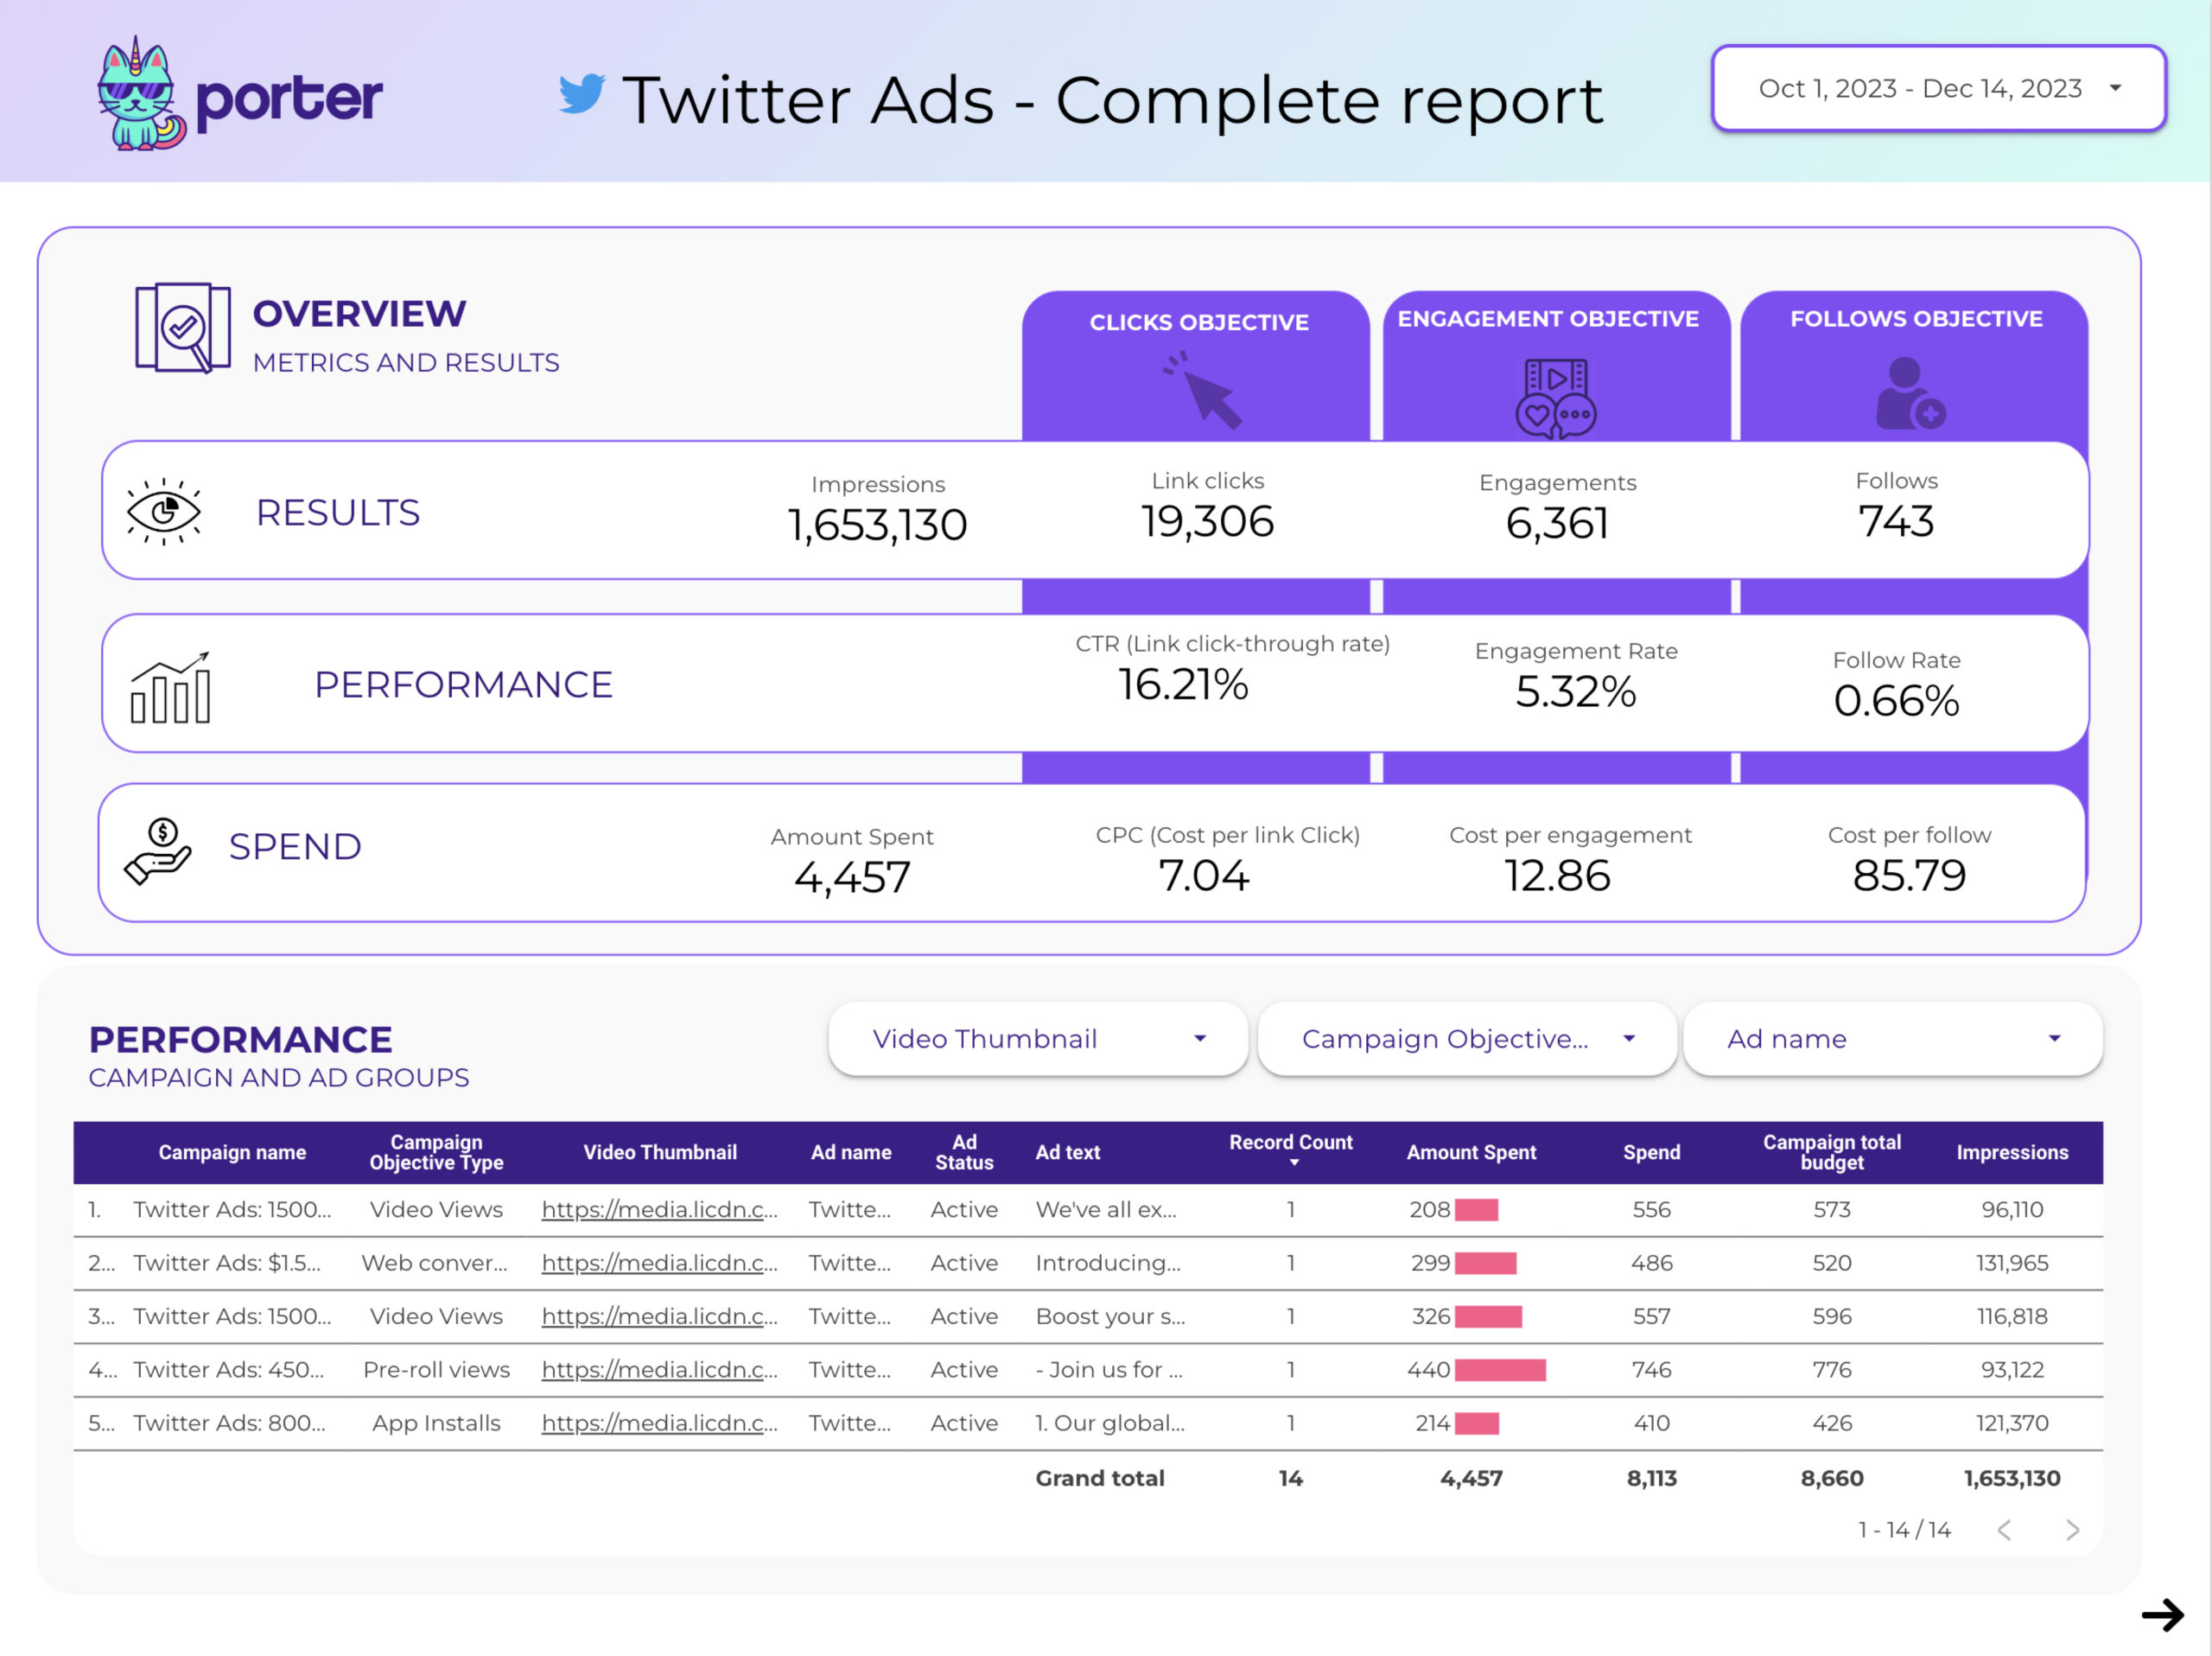
Looker Studio is now Google Data Studio →

Best free Advertising report templates for Looker Studio (2026)

Automate paid media reporting across Meta Ads, Google Ads, LinkedIn Ads, and TikTok with our free, white-label Advertising report templates on Google Data Studio (Looker Studio). Used by +10,000 marketing teams and agencies in 60 countries.

Google Data StudioGet all Advertising templates for free →

How to build an Advertising dashboard on Looker Studio

From copying a template to a live multi-channel paid media report in under 10 minutes:

1

Pick an Advertising template

  • Use the gallery above — start with PPC or Paid Media if you run multi-channel; pick channel-specific templates (Google Ads, Facebook Ads, LinkedIn Ads, TikTok Ads) if you focus on a single platform
  • Click “Get template” on the card
  • In Looker Studio, click the three-dot menu (⋮) in the top-right and select “Make a copy”
  • The copy is now yours — fully editable, in your own Looker Studio account

Full tutorial: How to copy a Looker Studio report template

2

Connect your ad accounts

  • Google Ads & Google Analytics 4 — native connectors in Looker Studio, no extra setup
  • Meta Ads (Facebook + Instagram), LinkedIn Ads, TikTok Ads, Twitter Ads — use Porter Metrics connectors (one click to authorize)
  • Mix and match channels in the same template — spend, conversions, and ROAS pull in automatically
  • Data refreshes on its own — no manual exports, no broken CSVs

Specific guides: Connect Facebook Ads · Connect LinkedIn Ads · Connect TikTok Ads

3

Blend channels and set the KPIs

  • Combine spend across channels so you see total paid spend in one number — Porter’s data blending handles the join automatically
  • Build blended ROAS as a calculated field: Revenue / Total Spend
  • Add campaign and audience filters so you can slice by brand vs non-brand, prospecting vs retargeting, or top-of-funnel vs bottom-of-funnel
  • Compare periods — enable period-over-period on date ranges to spot week-over-week or month-over-month shifts
4

White-label and share

  • Brand it: swap logos, change colors and fonts, remove Porter branding — the result looks like your agency built it
  • Share a live link with clients or stakeholders (view-only or edit)
  • Schedule weekly/monthly PDF emails from Looker Studio so reports land in inboxes without you lifting a finger
  • Embed the dashboard in your own client portal or Notion workspace

Full tutorial: How to share Looker Studio reports


What should an Advertising dashboard include?

A solid Advertising dashboard organizes paid media metrics by funnel stage — so you can see at a glance where budget is going, what’s working, and where the drop-offs are. Every template in this gallery is built around this structure:

visibility

Awareness & reach

Impressions, reach, frequency, CPM. How many unique users saw your ads, how often they saw them, and what it cost to reach them. Watch frequency for creative fatigue (usually above 3-4x per week).

ads_click

Engagement & clicks

CTR, CPC, clicks, landing page views. Whether your creative and targeting actually pull users in. A low CTR at decent CPM usually points to creative or audience issues.

shopping_cart

Conversion & revenue

Conversions, CPA, ROAS, revenue, AOV. The bottom-line numbers. Break down by campaign, ad set, creative, and channel to know what to scale and what to pause.

payments

Pacing & budget

Daily spend vs. target, projected monthly spend, budget remaining. Prevents over-spending early in the month and under-spending that leaves performance on the table.

A good Advertising dashboard — whether you call it an advertising dashboard, paid media dashboard, marketing campaign dashboard, or marketing analytics dashboard — also layers in three cross-cutting views:

Every template in this gallery includes these layers out of the box — you just connect your ad accounts and the charts populate automatically.


Who are these Advertising templates for?

These templates are built around the KPIs paid media teams actually report on — spend, CPA, ROAS, CTR, frequency, and attribution. Each one is designed for a specific role and use case:


What you get with these Advertising templates

palette

White-label ready

Add your logo, brand colors, and fonts. Remove all Porter branding. Deliver paid media reports to clients as your own work.

bolt

Auto-updating spend & ROAS

Once connected, Meta Ads, Google Ads, and the rest refresh automatically. Schedule weekly or monthly PDFs — reporting stops being a manual task.

hub

All paid channels in one view

Connect Meta Ads, Google Ads, LinkedIn Ads, TikTok, Twitter (X), Amazon Ads, and more — via Porter connectors. Blended spend, CPA, and ROAS out of the box.

tune

Built for paid media KPIs

Campaign, ad set, and creative breakdowns. Calculated fields for blended ROAS, cost per qualified lead, and custom conversion definitions — already set up.


Video tutorials: connect your ad accounts

Step-by-step walkthroughs for connecting every major paid channel to Looker Studio:

More tutorials: Looker Studio tutorial hub — covers report creation, design customization, calculated fields, and sharing reports.


Frequently asked questions

What KPIs should an Advertising dashboard track?

The core paid media KPIs most templates here focus on:

  • Spend — total ad spend, per channel, per campaign, and vs. budget
  • CPA (Cost per Acquisition) — spend divided by conversions, per campaign
  • ROAS (Return on Ad Spend) — revenue from ads divided by ad spend
  • CTR (Click-through Rate) — clicks divided by impressions, by ad and audience
  • Frequency — how often the same user sees your ad (watch for creative fatigue)
  • Conversion rate — clicks that turn into sales, signups, or leads

For agencies and e-commerce, add blended ROAS (combining all paid channels + revenue) and pacing vs. budget — two of the most requested custom metrics.

Can I combine Meta Ads, Google Ads, and other channels in one report?

Yes — and that’s exactly what the PPC, Paid Media, and Cross-channel templates do.

With Porter connectors, spend and conversions from each platform blend automatically — no manual joins or BigQuery setup. You get blended ROAS, total cost per lead, and channel-mix charts out of the box.

How do I track ad spend vs budget in Looker Studio?

Use the PPC budget tracking and pacing or Facebook Ads pacing templates. They include:

  • Daily spend vs. monthly budget (with target line)
  • Days remaining in the month
  • Projected monthly spend (based on current run rate)
  • Over-pacing / under-pacing indicators by campaign

You set the budget as a calculated field parameter and the template does the rest.

How does attribution work in these templates?

Each ad platform reports its own attribution (click, view, or mixed) by default. Looker Studio shows whatever the platform sends.

For multi-touch attribution across channels, the Facebook Ads Attribution template compares first-touch, last-touch, and view-through conversions. For cross-channel attribution using GA4 data-driven models, combine paid channels with the GA4 template and use GA4’s attribution report as the source of truth for blended ROAS.

Are these Advertising templates free?

Yes, 100% free. Every template on this page is free to copy, use, and customize — no credit card required.

The data connectors are also free to start:

  • 14-day unlimited free trial when you connect your first ad account through Porter
  • Free Forever plan after trial — 3 connected accounts, 30 days of data, all templates and destinations included
  • No card charged automatically when the trial ends

See Porter Metrics pricing for full plan details.

Can I white-label these templates for client reports?

Yes. After copying, replace logos, change colors/fonts, and remove Porter branding. Share the dashboard with clients using a custom domain via Looker Studio sharing options or schedule branded PDF reports to land in their inbox weekly or monthly. Agencies typically use the same template across many clients by duplicating and swapping the connected ad account.

Do I need to know SQL or coding?

No. Looker Studio is drag-and-drop, and these templates come pre-built. If you want custom metrics (e.g., “cost per qualified lead excluding brand campaigns”), you can use calculated fields — or describe what you need in plain English and let Porter’s AI field builder generate the formula for you.

How does Porter Metrics compare to other paid media reporting tools?

Most connector tools stop at moving data. Porter Metrics gives you both connectors and ready-to-use templates plus:

  • Automatic cross-channel blending — Meta Ads + Google Ads + GA4 data joins without manual SQL
  • Built-in data warehousing — heavy sources (Amazon Ads, HubSpot, Shopify) stored in BigQuery behind the scenes for fast dashboards
  • Anomaly alerts and AI summaries — paid media spend anomalies pushed to Slack or Gmail
  • Custom fields with AI — natural-language formula builder for metrics like blended ROAS or funnel stage cost
  • Free Forever plan — 3 ad accounts, all destinations, data blending included

Full comparison: Porter Metrics overview — features, pricing, and how it compares.

What should an advertising dashboard include?

A complete advertising dashboard organizes metrics by funnel stage so you can see where budget goes and where performance drops off:

  • Awareness: impressions, reach, frequency, CPM
  • Engagement: clicks, CTR, CPC, landing page views
  • Conversion: conversions, CPA, ROAS, revenue, AOV
  • Pacing: daily spend vs. target, projected monthly, budget remaining

On top of those, a solid dashboard also shows channel mix (share of spend and ROAS across Meta, Google, LinkedIn, TikTok), campaign and creative breakdowns, and period-over-period comparisons. Every template in this gallery includes these layers pre-built.

What are the main types of advertising dashboards?

Advertising dashboards generally fall into four types, each with a different audience and purpose:

  • Executive / KPI dashboards — high-level headline metrics (total spend, blended ROAS, conversions vs target) for CMOs and stakeholders. See the PPC KPIs template.
  • Operational / campaign dashboards — day-to-day performance by campaign, ad set, and creative. Used by paid media specialists and media buyers. See the PPC Campaign performance template.
  • Funnel / attribution dashboards — impressions → clicks → conversions across channels, plus first-touch vs last-touch views. See the PPC Funnel template.
  • Client / agency reports — white-label monthly deliverables with branded visuals, spend vs. target, and commentary space. See the Agency template.

Most marketing teams run 2-3 of these in parallel: one for leadership, one for ops, one for clients.

Can I use ChatGPT to build an advertising dashboard?

ChatGPT can help draft ideas for what to measure, but it can’t connect to your ad accounts or build the visual dashboard itself. For a live, auto-updating report you still need a BI tool (Looker Studio, Power BI, Tableau) and a way to pull data in.

With Porter Metrics you get the shortcut: the templates are already built around the right KPIs, and the AI field builder lets you describe what you need in plain English — for example, “cost per qualified lead excluding brand campaigns” — and Porter generates the formula. So the AI piece is inside the workflow, right where it’s useful, without replacing the dashboard itself.

Ready to automate your Advertising reports?

Connect Meta Ads, Google Ads, LinkedIn Ads, and TikTok to Looker Studio in minutes. No coding required.

Get started for free →